Yet more bumps on the path to normal
Financial markets swung widely, eventually netting a sharp correction, during the period under review, which started in mid-September. Asset prices fell across the board and US government yields widened in October before retracing that increase and dropping further as the selloff of risk assets spread. Volatility and term premia jumped. A further round of turbulence, this time accompanied by lower yields, hit markets in December. The repricing took place amid mixed signals from global economic activity and the gradual, yet persistent, tightening of financial conditions. It also reflected the ebb and flow of ongoing trade tensions and heightened political uncertainty in the euro area. These bumps were a reminder of the narrow path that central banks are treading in their quest for policy normalisation, in a generally challenging policy environment.
Financial conditions became somewhat tighter in the United States. In October, US 10-year government bond yields consistently traded above the 3% threshold that had capped this benchmark during the past 12 months. Higher yields persisted through most of November, driven by real yields, before falling below 3% in early December. Risk premia, including the term premium, picked up and search for yield abated. Spearheaded by the technology sector, US equity valuations dived in October, despite good quarterly earnings announcements. Stock prices were volatile in November and fell again in December. Investors appeared unnerved by poor forward visibility of results, against the background of trade tensions, weakening global conditions and the Federal Reserve's determination to move forward with gradual policy normalisation. Corporate spreads widened, particularly for segments of lower credit quality.
The repricing of risk assets was global. US stock markets dragged down those in other advanced and emerging market economies, in what turned out to be a widespread stock market rout. In Europe, corporate spreads also increased materially, especially for financial firms. In particular, bank valuations came under renewed pressure as political uncertainties grew, notably concerning the Italian budget and, to a lesser extent, Brexit.
After a summer marked by capital outflows and country-level stress, financial conditions remained tight but relatively steady in emerging market economies (EMEs). Currencies depreciated further vis-à-vis the US dollar early in the quarter, reflecting expectations of tightening by the Federal Reserve. But the sharp drop in oil prices provided some relief for oil-importing countries, after an unusual period when both oil and the dollar had gained strength. Portfolio outflows generally waned in EME fixed income, and local currency bond spreads eased.
US real yields and term premia leapt
Prices fell across many asset classes during the review period.1 The adjustment reflected major central banks' gradual moves towards policy normalisation, coupled with mixed signals from the real economy and increased political risks.
Central banks in large advanced economies (AEs) maintained the course they had outlined earlier in the year. On the back of positive economic data, in September the Federal Reserve raised the fed funds rate policy range by 25 basis points, as widely expected, and continued the runoff of its balance sheet at the preannounced pace. While the "dot plot" suggested a further series of policy rate hikes through 2020, futures markets pointed to a lower path. As anticipated last June, the ECB reduced the monthly pace of its net asset purchases from €30 billion to €15 billion from October, and hinted that it was still on course to end the programmes in December. The ECB Governing Council also reaffirmed its forward guidance with respect to the near-term path of policy interest rates and reinvestment policy after the net asset purchases end. The Bank of Japan kept its policy stance largely unchanged.
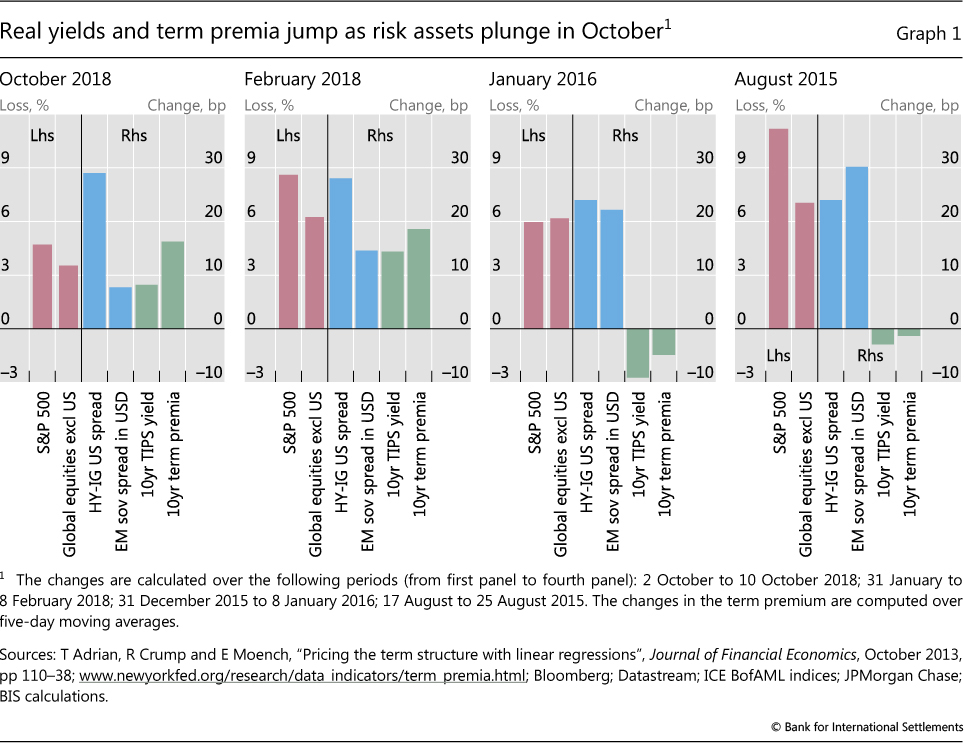
Yet, in early October, markets tumbled as investors became concerned about a seemingly hawkish turn in the Federal Reserve's stance. The plunge followed strong readings for key US economic indicators and a speech by Fed chairman Powell that investors saw as signalling a steeper path of policy rates. Contrary to other recent events of market stress, prices fell across all asset classes, including US government bonds, often seen as an investor safe haven. Long-term real interest rates, as proxied by the yield on 10-year US Treasury inflation-protected securities (TIPS), widened by almost 10 basis points during the initial trading days of October, while stock prices plummeted and corporate default premia surged (Graph 1, first panel). This pattern reproduced closely the moves seen in early February, when a stronger than expected labour market report had led to another sharp market drop as investors fretted over the Fed's policy (second panel).2 Notably, the term premium embedded in 10-year US Treasury yields spiked during that initial week of October, as it had in the first week of February (last bar in first and second panels).
This pattern of cross-market behaviour is not the usual one in risk-off events. It is instructive to compare asset price and risk premia patterns in the February and October episodes of market stress with those observed in January 2016 and August 2015 (Graph 1, third and fourth panels, respectively). Risk assets lost ground in all cases, both in the United States and globally, with stock prices dropping (the two red bars in each panel) and US high-yield and EME spreads widening (the two blue bars). However, the behaviour of real rates and term premia (the two green bars) differed markedly across the four episodes. In contrast with the patterns observed in October and February 2018, real interest rates dropped in August 2015 and January 2016 as investors shifted positions from risky assets to safer ones. Similarly, the estimated term premium on US Treasuries inched down in both the 2015 and 2016 events. Seen from this perspective, in the two 2018 episodes valuations came under pressure from a jump in real US Treasury yields and wider term premia, resulting in higher discount rates and an overall repricing of risk.3
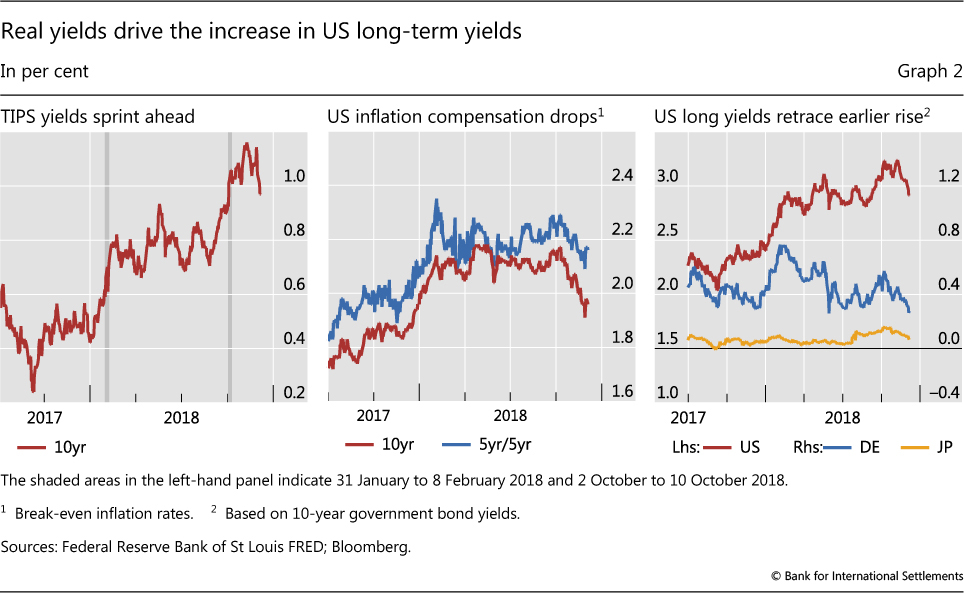
The rise in long-term real rates lifted US Treasury nominal yields early in the review period. The yield on 10-year TIPS - as noted, a market proxy for long real rates - rose by about 30 basis points from mid-September to early November (Graph 2, left-hand panel).4 At the same time, 10-year US Treasury nominal yields increased somewhat less in the same period, as measures of inflation compensation eased, possibly in response to investors' revised expectations about a tighter monetary policy path (centre panel). Nevertheless, 10-year US Treasury nominal yields traded consistently above 3% for the first time since mid-2011. The benchmark retreated below 3% only in early December, in light of remarks by senior Federal Reserve policymakers that investors perceived as moderating the hawkish tone from October, and growing uncertainty about the prospects of an easing of trade tensions (right-hand panel).
Shifts in both supply and demand factors contributed to higher US yields throughout the year. On the supply side, reflecting in part the tax cut enacted in December 2017, net issuance of US Treasuries between January and October stood at about 4% of lagged GDP, an increase from 2% in the same period of 2017 and the highest level since 2012. On the demand side, the decline in holdings of US Treasuries by the Federal Reserve and by key foreign investors continued. As the Fed's policy of reducing its balance sheet gathered pace, its holdings of US Treasuries decreased by more than 2 percentage points to 15% of total marketable securities, about 5 percentage points below the 2014 peak. Holdings of US Treasuries by the foreign official sector (mostly central bank reserve managers) also fell by almost 2 percentage points in 2018 to 26% of the outstanding amount, approximately 8 percentage points below the 2014 levels.
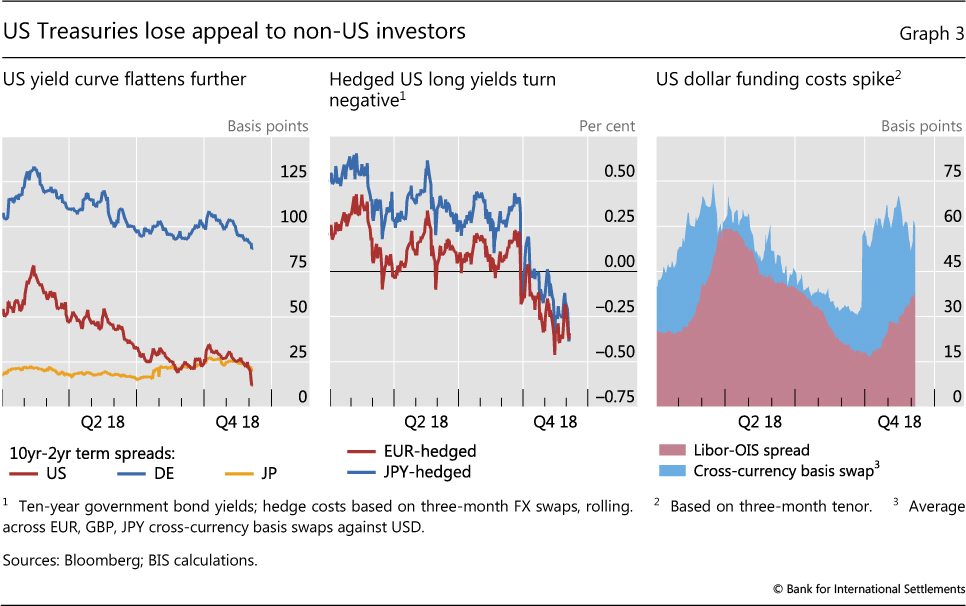
The US yield curve steepened briefly in early October, as US Treasury long yields jumped. Later on, the yield curve resumed the flattening trend that had started in February, closely mirrored by 10-year bund yields and to a lesser extent Japanese government bond yields (Graph 3, left-hand panel). In early December, while stock markets plunged again, the curve inverted at the mid-range when five-year yields fell below two- and three-year yields. The continued flattening of the US yield curve curtailed the appeal of US Treasuries for Japanese and especially euro area investors, as yield curves in their jurisdictions were equally or more steep. Higher FX hedging costs weakened risk appetite further for investors who hedge their positions. These costs reflected a combination of two factors. On the one hand, reliance on short-term instruments for hedging purposes; on the other hand, a widening of the cross-currency basis at the short end in the FX swap market (Graph 3, right-hand panel).5 A widening of the Libor-OIS spread, possibly related to euro area bank stress and the quick pace of contraction in banks' reserves in the United States,6 also contributed to high hedging costs (same panel).
Unsteady markets struggled to rebound
The rise in interest rates early in the review period seemed to dampen the search for yield that has gripped financial markets for quite some time. With diminishing support, stocks bore the brunt of heightened uncertainty about the sustainability of earnings growth, bringing high US valuations somewhat closer to the historical norm. But the impact of US equity market developments rippled through several asset classes and jurisdictions. As December started, stock markets remained unsettled in the midst of uncertainty around trade tensions between the United States and China.
Stock markets across the globe oscillated widely during this period. In October, the S&P 500 lost almost 10% of its capitalisation, erasing all gains since the beginning of the year. Afterwards it traded sideways, with ample swings as investors' sentiment appeared fickle and heavily dependent on incoming data (Graph 4, first panel). The selloff extended to other AE and EME stock markets, most of which had already been flat or declining for much of 2018. Non-US markets on average fell by about 8% in this month, while the Shanghai Composite plummeted by almost 15%. By early December, after a tentative rally sparked by prospects of a reduction in global trade tensions, a renewed bout of volatility left the S&P 500 still 8% below the all-time high reached on 20 September.
Equity implied volatilities surged in October to levels last seen during the spike in February, after remaining subdued for most of the year (Graph 4, second panel). The VIX index reached 25% - not an unusually high value from a historical perspective but still one of the highest since late 2011.7 By the end of the period under review, implied volatilities in the US and other AE stock markets remained above the lower plateaus reached earlier in the year. Implied volatilities were steadier in the bond and exchange rate markets (Graph 4, second panel).
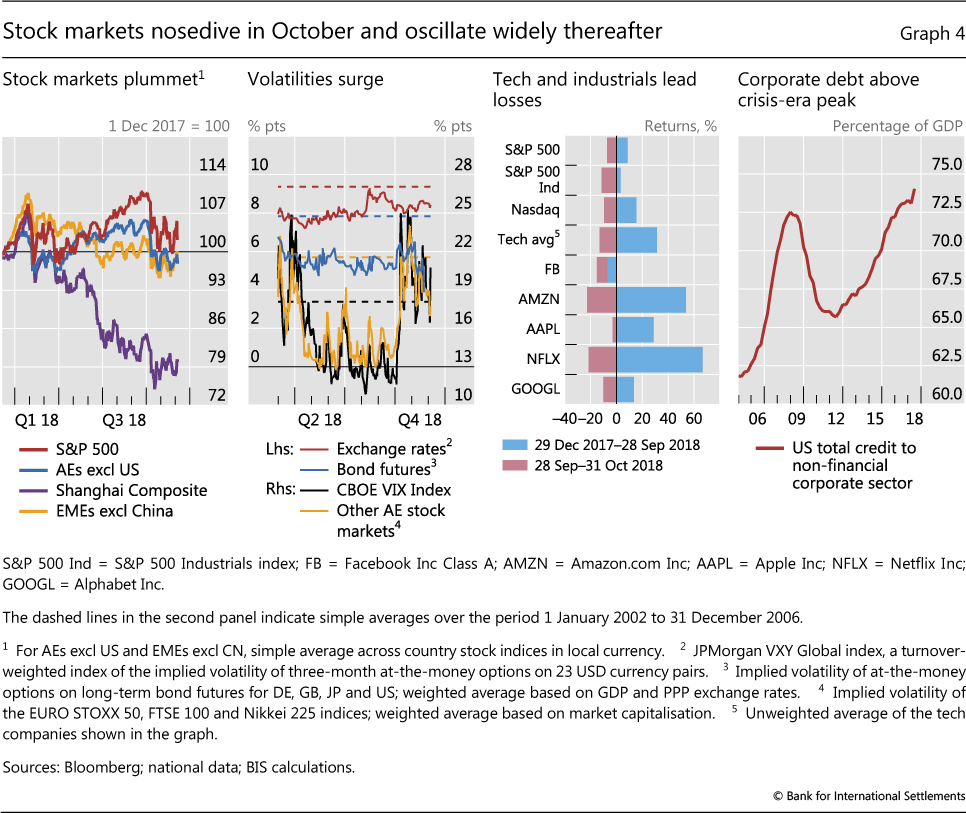
In the United States, stock market losses were particularly sizeable for industrial and technology companies, with some of the largest technology stocks shedding as much as a fifth of their market value (Graph 4, third panel). Earnings announcements in October signalled rising cost pressures for industrial companies and softer demand prospects for technology ones. Industrial and technology stocks had only partially recouped the losses experienced in October before falling again in early December. Even after the market selloff, equity valuations in the United States remained relatively rich, while they were in line with the historical norm in most AEs and EMEs.
A backdrop of stretched corporate balance sheets and weakening lender protection in key loan markets may have compounded investors' concerns. In the United States, corporate debt of non-financial companies stood higher, as a percentage of GDP, than at its Great Financial Crisis (GFC peak (Graph 4, fourth panel). Bonds with the lowest investment grade rating amounted to one third of bonds outstanding and, over the past year, debt loads had increased the most for companies with weak balance sheets.8 In addition, "covenant-lite" loans, which afford lenders fewer safeguards, represented about 80% of the volume of US leveraged loans issued in 2018.9
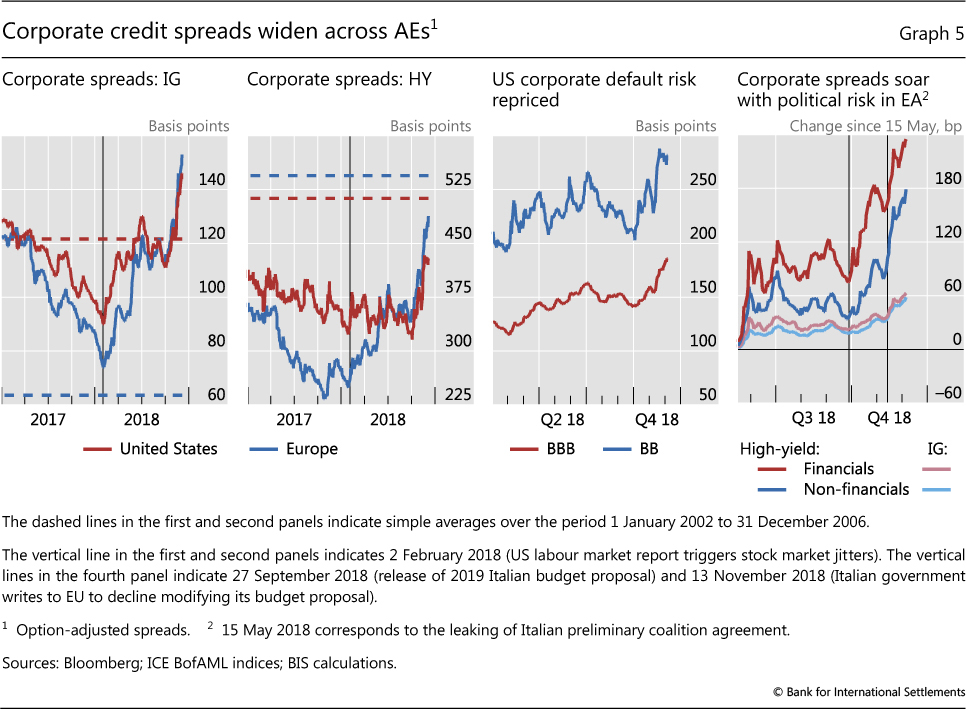
Accordingly, US corporate credit spreads increased further in both the investment grade (IG) and high-yield segments. Spreads broke through the pre-GFC average in the IG sector, rising by about 35 basis points since the beginning of the fourth quarter (Graph 5, first panel, red line). After trending down during the previous year and a half, high-yield spreads jumped by about 100 basis points starting in October, but remained only slightly above the early 2017 level and well below the pre-GFC average (second panel, red line). To some extent, high-yield spreads were swayed by the path of oil prices, given the sizeable participation of shale energy companies in this credit segment. Higher risk premia raised funding costs especially sharply for lower-rated companies. After narrowing in the third quarter, the spread between BB- and BBB-rated corporate credits in the United States began opening again in early October and continued widening in November (third panel). The widening coincided with the increase in Treasury yields and the equity market rout.
In Europe, borrowing costs rose in the wake of heightened political uncertainty. European IG spreads, which had risen rapidly in the first half of 2018, climbed further through the review period, surpassing their US counterparts and more than doubling their pre-GFC average (Graph 5, first panel, blue line). In the high-yield space, European spreads increased rapidly through December and remained higher than US comparables, getting closer to their own pre-GFC averages (second panel, blue line). The impact was particularly negative for high-yield financial corporates (fourth panel).
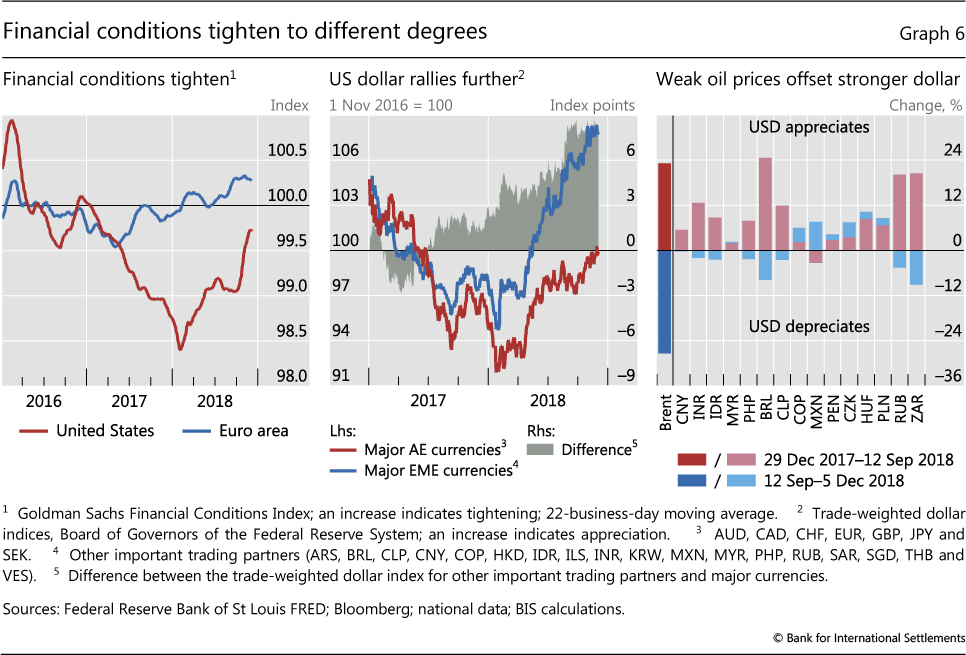
The upshot of these events was a material tightening of financial conditions in the United States and Europe. That said, by some measures US financial conditions remained quite loose, and milder than early last year (Graph 6, left-hand panel, red line). A significant part of the apparent tightening in US financial conditions in the fourth quarter reflected the impact of the stock market fall (Box A). By contrast, financial conditions in Europe tightened further relative to 2017 and most of 2018 (Graph 6, left-hand panel, blue line).
EMEs stabilised but confront challenges
Tighter financial conditions also affected EMEs, especially through further appreciation of the US dollar. The greenback gained ground vis-à-vis both AE and EME currencies (Graph 6, centre panel). However, compared with earlier in the year, the impact of the dollar appreciation was more muted. In part, this reflected the degree to which EMEs had already been shaken the previous quarter. In addition, some EMEs benefited from the sudden drop in oil prices. Lower oil prices may have provided some relief from the double whammy of a strengthening dollar and escalating oil prices, an unusual scenario that had prevailed during the first three quarters of the year (right-hand panel). As the quarter progressed, some EME currencies recouped part of their earlier losses.
Box A
Financial conditions indices: the role of equity markets
Anna Zabai*
Changes to financial conditions are often seen as an important channel for monetary policy transmission. Researchers and market analysts have accordingly constructed financial conditions indices (FCIs) for different economies, typically using the weighted average of several key variables, as a way to track and study these effects. This box examines recent FCI developments in selected economies and argues that FCIs are sensitive to volatile variables, even when these enter the index with a small weight. It illustrates this issue by considering how FCIs in the United States have responded to recent developments in US equity markets.
The left-hand panel of Graph A plots "synthetic" FCIs for the United States, the euro area, Brazil and Mexico. The FCIs were constructed using a similar approach to that employed by Goldman Sachs - including the choice of weights, which are selected using estimates of the relative impacts of changes in the components on GDP growth. The components comprise interest rates (short-term and long-term), corporate credit spreads, stock market valuations (ie price/earnings (P/E) ratios) and the exchange rate (trade- and debt-weighted). The weights of these variables reflect the structural characteristics of each economy. The variables enter the index in such a way that an increase in the component reflects a tightening of conditions (ie a contraction in funding availability).
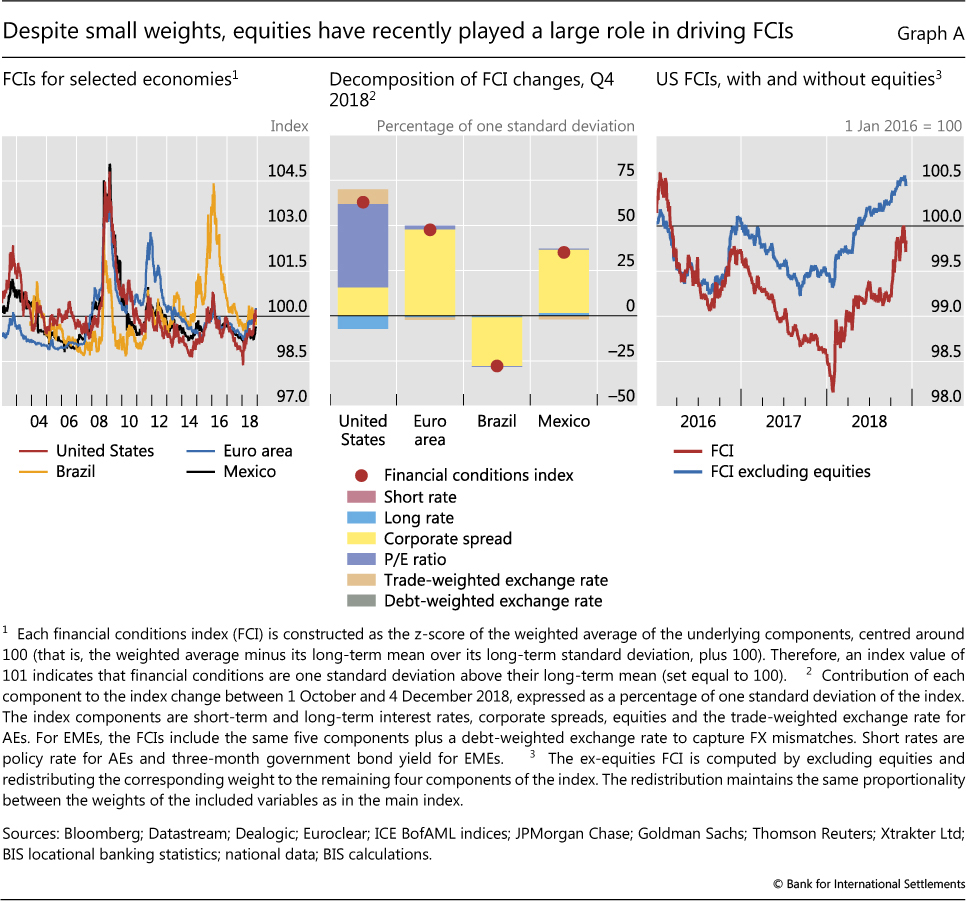
These FCIs suggest that financial conditions in the United States, the euro area and Mexico have been broadly accommodative for a number of years, with the respective FCIs remaining largely below long-term averages in the period since 2013. The FCI has been more volatile in Brazil, which experienced a major recession in 2016-17. That said, financial conditions in the United States and the euro area have turned less accommodative in the past year.
In Q4 2018 in particular, the US FCI rose by almost three quarters of a standard deviation, while the FCIs for the euro area and Mexico point to a tightening of one half and about one third of a standard deviation, respectively (Graph A, centre panel). By contrast, financial conditions loosened in Brazil. While recent changes in financial conditions were driven largely by corporate bond spreads in the euro area, Brazil and Mexico, the US FCI rose primarily on the back of a correction in equity valuations.
In fact, equity markets appear to have driven a large part of the loosening of US financial conditions as tracked by these indices in recent years, as well as the more recent tightening. An FCI computed excluding equities would have signalled significantly tighter financial conditions in the United States in the last two years (right-hand panel). The divergence occurs because, in spite of a relatively small weight (5% in the case of the US FCI), equities are relatively more volatile than the other index components.
The high sensitivity of FCIs to equity valuations under this methodology points to the importance of appropriately setting the corresponding weights. Some degree of reliance on market-based finance in funding economic activity, as well as the tendency of corporations to look to the equity market as a signal in their investment decisions, calls for equities to be included in FCIs. Against this, the short-term macroeconomic relevance of equity market developments could be overstated if distributional considerations do not inform the choice of weights. Equity holdings are concentrated among households at the top end of the income and wealth distributions, which tend to have a relatively low marginal propensity to consume. As a result, an index constructed without accounting for these differences may place too high a weight on equity valuations, thereby possibly overstating the boost in activity foreshadowed by a loosening of financial conditions.
* With many thanks to Nick Fawcett at Goldman Sachs and especially to Katie Craig, Marcus Petersen and Seth Searls at the Federal Reserve Bank of New York for several helpful exchanges. Alternatively, a principal component approach may be used. See J Hatzius, P Hooper, F Mishkin, K Schoenholtz and M Watson, "Financial conditions indexes: a fresh look after the financial crisis", NBER Working Papers, no 16150, July 2010. The choice of weights is discussed in J Hatzius, S Stehn and N Fawcett, "Financial conditions: a unified approach", Global Economics Analyst, Goldman Sachs, September 2016; and in the follow-up Goldman Sachs FCI analysis published in the same outlet. The FCIs in Graph A are computed using the same weights underpinning the Goldman Sachs FCIs, with the exception of the FCI for the euro area. While Goldman's euro area FCI includes a "sovereign spreads" variable, this was not included in the euro area FCI in Graph A in order to improve consistency with the US indicator. For example, because higher P/E ratios are associated with a loosening of financial conditions and a boost to economic activity, they enter with a negative sign. Similarly, the dual effect of exchange rates on economic activity - an appreciation tends to dampen activity by depressing net exports, but it also boosts activity by reducing the real value of foreign-denominated debt held by households and corporates - is accounted for by including both trade-weighted and debt-weighted exchange rates in the FCIs for Brazil and Mexico. Only the trade-weighted exchange rate is included for the United States and the euro area, as households and corporates in those two economies do not have significant amounts of foreign-denominated debt. Long-term averages were computed over periods starting 3 January 2000 for the United States, 31 January 2002 for the euro area, 28 November 2003 for Brazil and 2 January 2002 for Mexico; and ending 23 November 2018 in all four cases.
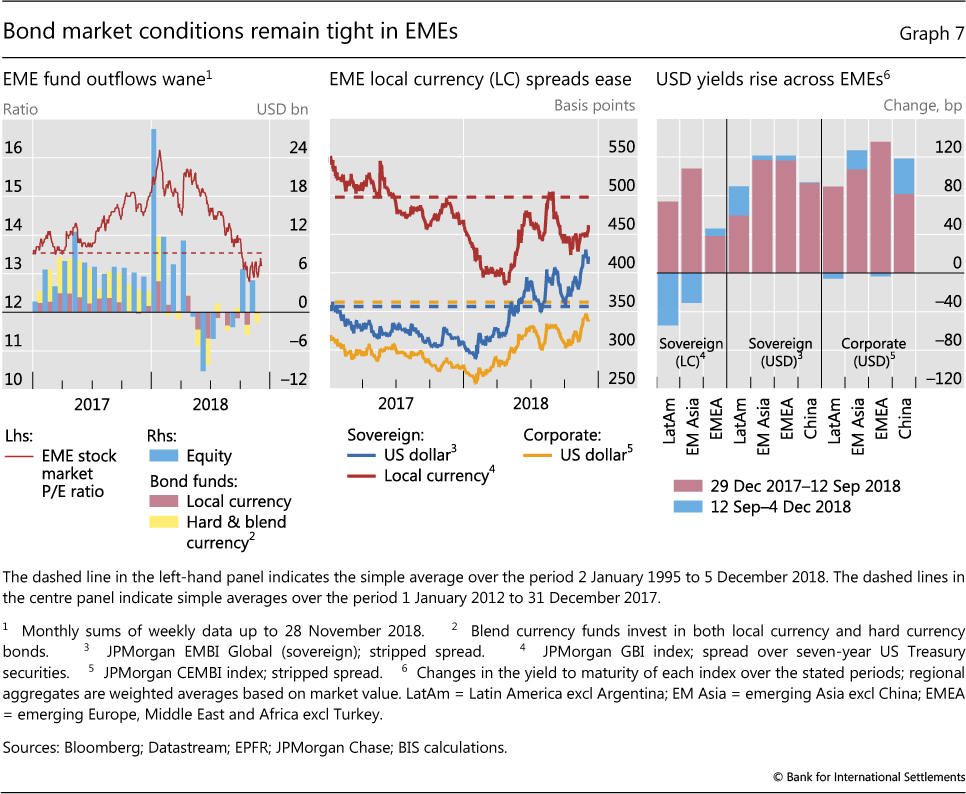
The picture concerning portfolio flows and asset prices was mixed. Outflows turned into inflows for EME equity funds as the large cumulative fall in stock prices recorded over the year brought valuation multiples down to attractive levels, somewhat below long-term averages (Graph 7, left-hand panel). Conditions remained broadly stable in secondary local currency sovereign bond markets. Spreads dropped early in the review period, and then traded sideways before an uptick in early December. Nevertheless, local currency sovereign spreads remained well below their post-GFC averages, but above the trough reached before trade tensions intensified last April (centre panel, red line).
Conditions were less forgiving in the dollar-denominated fixed income segment. Hard currency bond funds continued to experience some moderate outflows. Sovereign and corporate spreads saw some sharp increases in late November, which eased marginally as trade tensions appeared to moderate in the wake of the G20 Leaders' Summit in Buenos Aires (Graph 7, centre panel, blue and yellow lines). In particular, Latin American sovereigns and Chinese corporates saw a large increase in their dollar-denominated bond yields during the review period (right-hand panel, blue bars). Overall, the cost of dollar-denominated debt has risen by 100 basis points or more for most EMEs since the beginning of the year (right-hand panel, red plus blue bars). New issuance by governments and corporations slowed during 2018. However, EMEs face heavy refinancing needs over the next few years.
The economic outlook for China remained a concern, in particular for Asian EMEs. The Chinese economy gradually decelerated throughout the year as authorities pressed ahead with a deleveraging policy aimed at keeping financial stability concerns at bay. The pronounced downturn in stock prices, which deepened in October, tightened financial conditions further through its impact on equity-backed loans (Box B). In this context, renminbi depreciation, which is large even vis-à-vis other EMEs, has put some further pressure on other Asian currencies and those of commodity producers.
Political uncertainty continued to buffet euro area banks
Euro area banks suffered further valuation losses during the review period. Heightened political risk was a key factor behind the most recent tumble, as the standoff between the European Union and the Italian government over the latter's 2019 budget proposal became increasingly pressing, and prospects for a smooth UK exit from the EU remained uncertain.
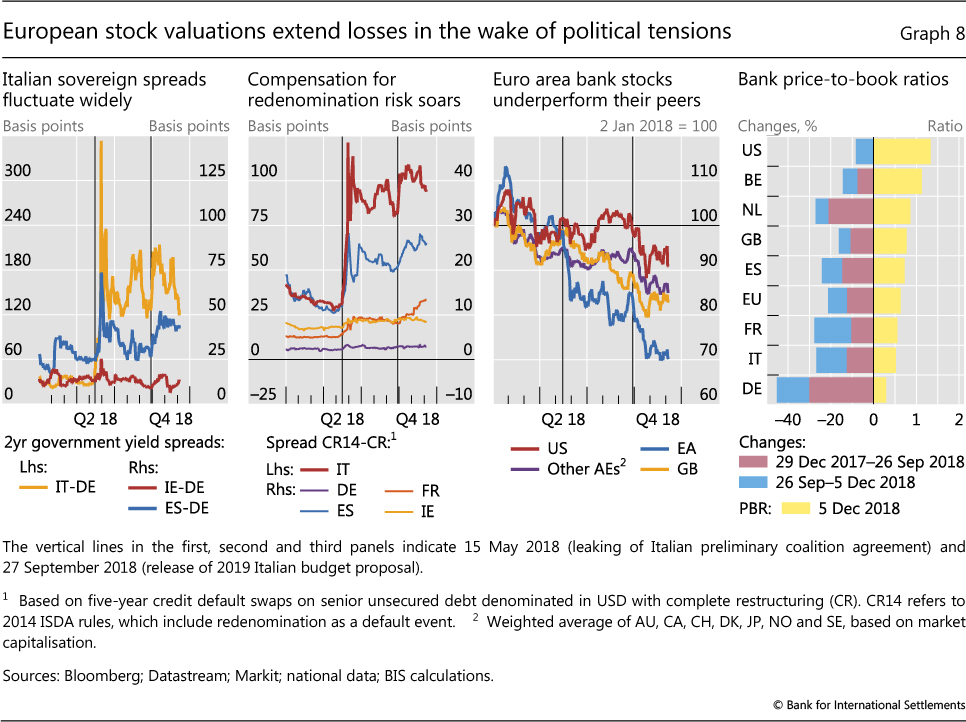
Political concerns again buffeted Italian bond markets. Sovereign spreads vis-à-vis German bunds, which had spiked in mid-May,10 rose again by end-September as the Italian budget draft was unveiled (Graph 8, first panel). The spreads gradually eased over the following weeks. They soared again in mid-November, as the Italian government initially declined to modify its budget proposal, which the EU had rejected in late October. There were signs that investors perceived an increase in the odds of an eventual redenomination of Italian sovereign debt: the cost of credit default swap contracts that included this contingency rose relative to that of contracts that excluded it (second panel). Even then, while rather high, these various spreads did not reach the May peak. And, while contagion to other sovereign yields in the euro area periphery was visible, it was more limited.
Euro area bank stock prices took another dip in the wake of these events. Between mid-May and early December, euro area banks lost almost 30% in market capitalisation (Graph 8, third panel), with half of that loss after the Italian government unveiled its draft budget in September. The losses exceeded by a substantial margin those experienced by banks in other AEs. Moreover, when political tensions eased in late November, European bank stocks failed to recover, even as Italian sovereign spreads edged down.
Box B
Equity pledge financing and the Chinese stock market
Feng Zhu
Since March 2017, Chinese regulators have pursued concerted measures aimed at reducing leverage in the financial system and managing financial sector risks. These measures have reduced shadow credit sharply since March 2018, exerting pressure on financing by privately owned enterprises (POEs) and small and medium-sized firms. With a slowing economy and falling equity prices, new measures have been taken to contain emerging risks, from equity pledge financing (EPF) - that is, lending extended to key shareholders or managers of listed companies who pledge their shareholdings as collateral. This box reviews the latest developments in EPF, their relationship with the recent market decline, the risks that EPF poses, and how regulators and firms have responded.
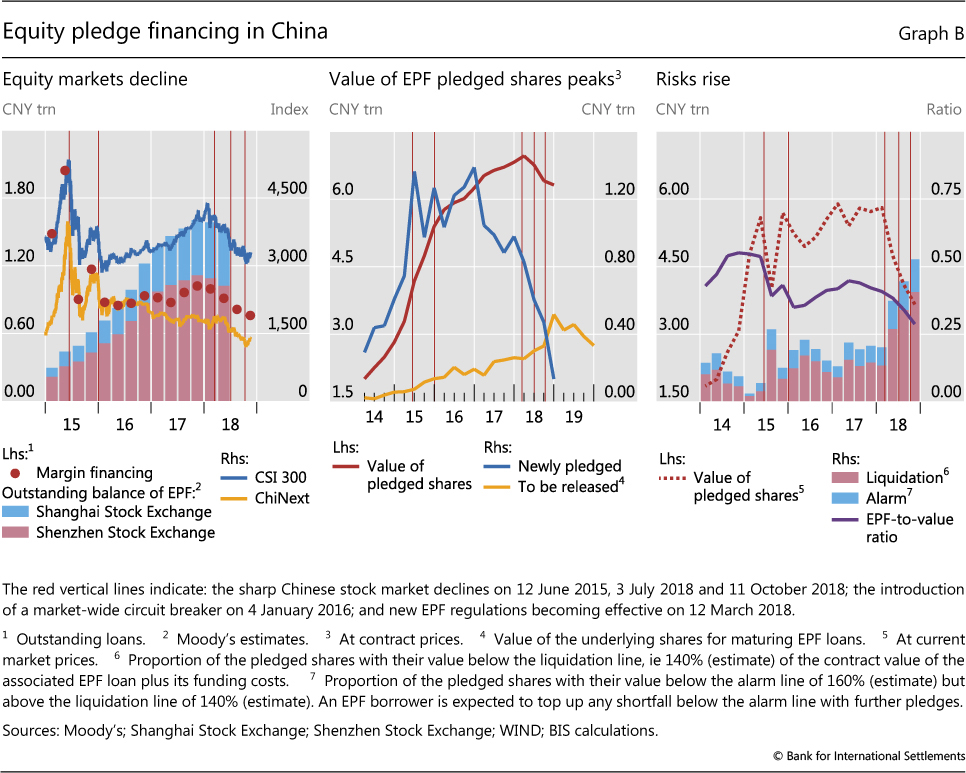
EPF grew very rapidly in China starting in 2014. Though hit hard by the market meltdown in the second half of 2015, EPF recovered strongly, with outstanding equity pledge loans peaking at CNY 1.6 trillion in Q4 2017 (Graph B, left-hand panel). Notably, the value of newly pledged shares had already started to fall sharply from Q1 2017, even as the outstanding amount continued to grow (centre panel).
Chinese stock markets reversed course in 2018. From its peak in January 2018, the CSI 300 Index fell 31% by 18 October, before a moderate recovery (Graph B, left-hand panel). Unlike the 2015 stock market turbulence, where margin financing (ie loans secured against the securities the borrowers purchase) played a key role, the current episode has highlighted the risks of EPF. The Shenzhen Stock Exchange, including the technology-oriented ChiNext Market, saw heavier share price declines; companies listed there tended to be more exposed to EPF risks.
Nevertheless, EPF remains a salient feature of the Chinese equity markets: at end-October 2018, the contract value of pledged shares was CNY 6.3 trillion (Graph B, centre panel). By some estimates, as many as 3,540 listed companies had shares pledged under EPF, with 22.5% of them having over 30% of their shares pledged.
EPF presents several risks. First, EPF exposes the company to the risk of an unintended change in shareholding structure (a new set of shareholders with a potentially different risk appetite and time horizon) if the pledged shares have to be liquidated. Second, the lenders bear liquidity risks. As of Q3 2018, over 50% of lenders were securities firms. In the event of a default, securities firms are prevented from liquidating the pledged shares immediately, as shareholders with a 5% or higher stake are not allowed to sell more than 1% of their shareholding within 90 consecutive days in the secondary market. This rule, and trading suspensions, reduce the liquidity of the pledged shares. Third, while only 20% of direct EPF lenders were banks in Q3 2018, most EPF lending ultimately relied on bank funding. An EPF failure could weaken banks' balance sheets. As equity prices fell in 2018, many of these risks rose significantly. In Q4 2018, as more EPF loans came due, the underlying pledged shares to be released were estimated at CNY 517 billion, a potentially significant overhang on market valuations.
The Chinese authorities have tightened EPF regulations since September 2017, amid the ongoing efforts to reduce financial leverage and risk. Significant new rules came into effect in March 2018. The rules restricted the EPF-to-value (ETV) ratio to no more than 60% and placed limits on the fraction of a company's shares that can be pledged (both overall, and to a single securities firm or asset management product).
Tighter regulation and falling equity prices have been the main drivers of a sharp decline in EPF in 2018. The market value of pledged shares fell from CNY 5.8 trillion at end-March 2018 to CNY 3.7 trillion at end-October (Graph B, right-hand panel). As share prices fell, the proportion of pledged shares with their current market value falling below the "liquidation" and "alarm" lines (set by lenders relative to the value of the associated EPF loans including funding costs) rose sharply (Graph B, right-hand panel, red and blue bars). Share values below the "alarm" line oblige borrowers to make up the shortfall in collateral, while lenders can force liquidation once prices fall below the "liquidation" line. Forced sales of shares correspondingly picked up as from June.
With their share prices under pressure, listed companies scrambled for solutions. Some requested trading suspensions by exchanges; such suspensions rose significantly in 2018. Nearly 60% of suspensions were applied to companies which had pledged 30% of their shares or more. However, this became more difficult as new guidelines released on 6 November discouraged listed companies from arbitrarily applying for a trading suspension or delaying the resumption of trading without proper justification. Second, firms with strong cash flows turned to stock buybacks, which would raise share prices and lower EPF risks. A third approach involves direct intervention by state funds. State entities have invested heavily in listed private firms this year, taking control of over 20 listed POEs.
The Chinese authorities have recently taken new initiatives to stabilise the equity market, support financing for POEs and contain risks associated with EPF. These include recent targeted measures by the central bank and banking regulators to promote funding for POEs. The People's bank of China has responded by promoting the issuance of private enterprise support funds and by using monetary policy instruments to support banks' credit extension to private enterprises. Moreover, in October the regulators announced new rules allowing insurers to provide special asset management products to institutional investors for investment in equities and in bonds issued by listed companies and their shareholders, in order to help EPF participants and support POEs. Organised by the Securities Association of China, 11 securities firms agreed to contribute CNY 25.5 billion to a parent asset management plan aimed at helping listed companies with growth prospects but EPF difficulties. Already, two "special bailout bonds" have been issued under the plan. Regulators have also established a pilot "credit protection tool" to support bond financing by POEs. Several local governments have set up funds to support POEs with EPF difficulties. These measures appear to have helped contain EPF risks; the ETV ratio dipped further, to below 30% at end-October.
As a result, price-to-book ratios, a common gauge of valuation for banks, dropped considerably and remained remarkably depressed. By early December, the ratios for French, German and Italian banks had plunged by more than 10% since September, and over 25% since the beginning of the year (Graph 8, left side of the fourth panel). Banks in most European jurisdictions have price-to-book ratios below one (right side of the fourth panel), and sometimes well below that mark, pointing to investors' continuing concerns about profit prospects and, in some cases, asset quality.11
1 12 September to 5 December 2018.
2 In February, stock market movements were sharpened by technical factors related to the unwinding of outsize one-directional investor bets on low volatility. See "Volatility is back", BIS Quarterly Report, March 2018.
3 For an introduction to term premium concepts and measurement, see B Cohen, P Hördahl and D Xia, "Term premia: models and some stylised facts", BIS Quarterly Review, September 2018.
4 See "Volatility is back", BIS Quarterly Review, March 2018.
5 The cross-currency basis rose quickly as soon as the maturity of three-month swap contracts started straddling the end of the year. The spike could have reflected demand for hedged dollar funding ahead of year-end, in light of a variety of regulatory requirements, including but not limited to balance sheet disclosures.
6 Reserve balances held at the Federal Reserve Banks have dropped by about 20% during 2018.
7 An end-of-day value of 25% is the 83rd percentile of the VIX distribution between January 1990 and September 2018, and the 98th percentile between January 2012 and September 2018.
8 Board of Governors of the Federal Reserve System, Financial Stability Report, November 2018.
9 See T Goel, "The rise of leveraged loans: a risky resurgence?", BIS Quarterly Review, September 2018.
10 See "Divergences widen in markets", BIS Quarterly Review, September 2018.
11 See B Bogdanova, I Fender and E Takáts, "The ABC of bank PBRs: what drives bank price-to-book ratios?", BIS Quarterly Review, March 2018.