Divergences widen in markets
Sentiment turned sharply in financial markets as 2018 moved into its second half. A renewed US dollar rally and escalating trade tensions resulted in an uneven tightening of global financial conditions. The Federal Reserve continued the gradual and predictable removal of monetary accommodation as the US economy gathered speed again, in part boosted by last year's fiscal stimulus. Yet financial conditions in the United States, if anything, eased further. Conditions tightened somewhat in the credit markets of some advanced economies (AEs). In contrast, financing tightened sharply in emerging market economies (EMEs), which saw their currencies depreciate and their access to borrowing wane, amid signs of market disarray in the most vulnerable economies.
US financial markets diverged from their peers. The US stock market sprinted ahead of those in both advanced and emerging economies, and its volatility edged lower. The steady accommodation provided by the ECB and the Bank of Japan (BoJ), together with a flight to safety from stressed EMEs, helped to keep a lid on long-term US government yields despite looming Treasury debt issuance. As a result, the US yield curve flattened further, nearing inversion. Overall, US financial conditions stayed looser than in the other main AEs. For instance, while credit spreads of US corporate borrowers stayed relatively flat between June and mid-September, European corporates saw moderately wider spreads that built upon a previous round of widening in May. These wider spreads were in part attributable to the higher borrowing costs faced by some European financial institutions, which reflected intra-euro area sovereign stress and the exposures of some banks to vulnerable EMEs.
The tighter financial conditions in EMEs built upon the pressure seen earlier in the year. Against the backdrop of a stronger US dollar, escalating trade tensions, and further signs of a slowdown in China, portfolio inflows remained limited. Compounded by domestic vulnerabilities, some countries experienced portfolio outflows, with policy or political uncertainty contributing to market stress in a few jurisdictions. Currency depreciation coincided with higher sovereign spreads, both for instruments denominated in US dollars and for those in local currency. The cumulative damage to EME assets since global trade tensions escalated in late March was in some respects greater than that resulting from the fallout of the 2013 taper tantrum, or the devaluation of the renminbi in August 2015. But sovereign spread levels at the current juncture stayed, by and large, below those of previous episodes and contagion from the most affected countries was limited. Nevertheless, as of mid-September, investors remained uneasy about whether the financial stress in EMEs would increase and spread further.
US markets follow their own path
Global financial markets increasingly diverged during the period under review, which extended from early June to mid-September. In the wake of mounting trade tensions, risk assets in the United States outperformed those of other jurisdictions, sometimes by a large margin. Although the Fed tightened monetary policy while the ECB and the BoJ maintained accommodation, credit spreads widened more in the euro area than in the United States. This was in part the result of political tensions in the euro area and the sharp appreciation of the US dollar, which weighed heavily on EME assets and, relatedly, on European banks.
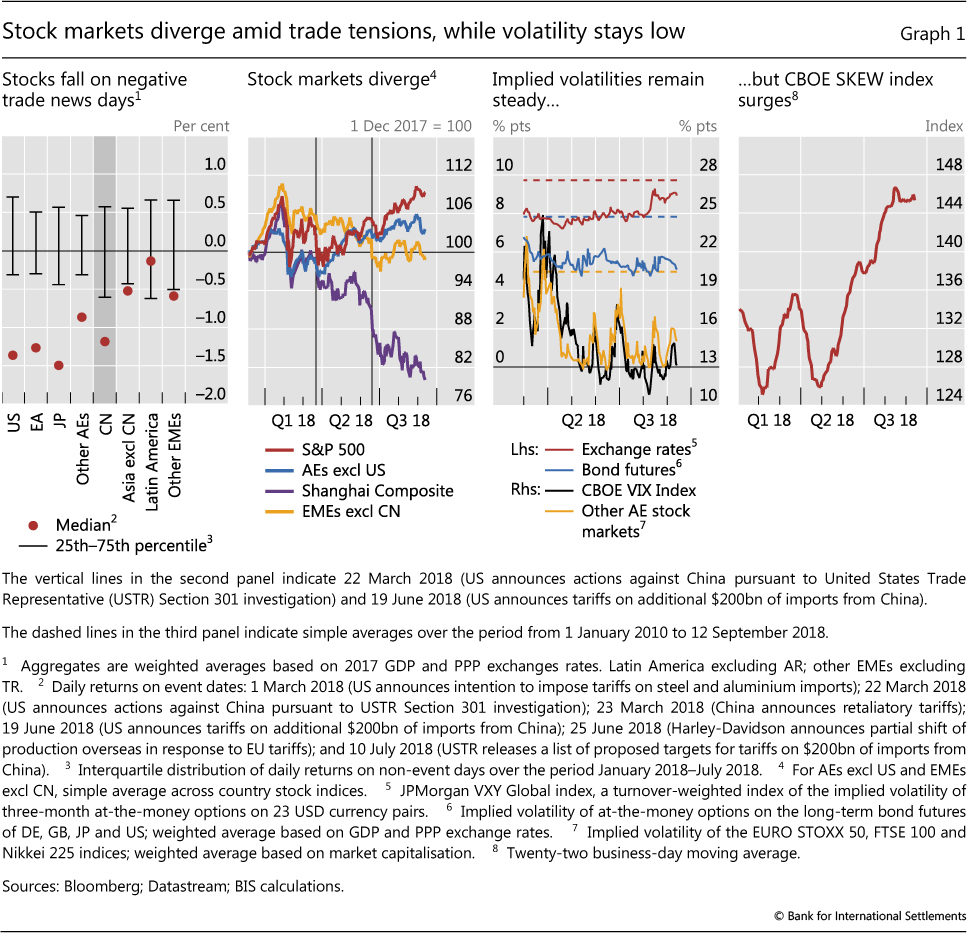
The divergence between US and other markets was most visible in equity prices. The outperformance of US stock markets was explained by solid corporate earnings and buybacks, boosted by the recent tax reform, and the exceptionnal returns of its technology sector. Despite escalating trade tensions, which typically induced drops in most stock markets on negative news days (Graph 1, first panel), the S&P 500 recouped all its previous losses, eventually surpassing the all-time high it had reached in late January. In contrast, other AE stock markets recorded relatively moderate gains, while the Chinese stock market extended the losses suffered earlier in the year. By mid-September, the Shanghai stock market index stood almost 15% below its early June levels (Graph 1, second panel), nearing the depths probed in early 2016. Other EME stock markets traded sideways in local currency, although they lost considerable ground in US dollar terms as currencies depreciated.
The implied volatilities of the major AE asset classes remained contained (Graph 1, third panel). Volatility in equity markets recorded brief spikes, but stayed below the post-Great Financial Crisis (GFC) averages, with the implied volatility of the US stock market edging below the levels prevailing in other AE stock markets. While exchange rate volatilities stabilised at their levels from earlier in the year, those of AE bond futures continued trending down through mid-September.
The solid returns and low volatility of the S&P 500 hid a sense of fragility. The cost of insuring against large drops of the S&P 500 in the options market became unusually large, as indicated by the peak reached by the SKEW index (Graph 1, fourth panel). This index had turned in late April as the escalation in US-China trade tensions continued.
Buoyed by a solid macroeconomic backdrop, markets took the Federal Reserve's gradual removal of accommodation in their stride. US growth hit a multi-year high in the second quarter, no doubt reinforced in the near term by the major fiscal stimulus, amid a strong labour market with the lowest unemployment since 2000, while core inflation reached the central bank's objective. Accordingly, the US central bank raised the fed funds target range by another 25 basis points in June, and continued the runoff of its balance sheet at the preannounced pace.
Monetary accommodation continued in the two other major currency areas. While the ECB announced that it expected to terminate its asset purchase programmes by end-2018, it indicated that interest rates would stay low for a prolonged period. Keeping to its policy of yield curve control, the BoJ reaffirmed its target for the benchmark 10-year government bond yield at 0%, although it broadened the trading range from 10 to 20 basis points. The BoJ also provided forward guidance, by stating its intention to maintain the current low levels of short- and long-term interest rates for an extended period of time.
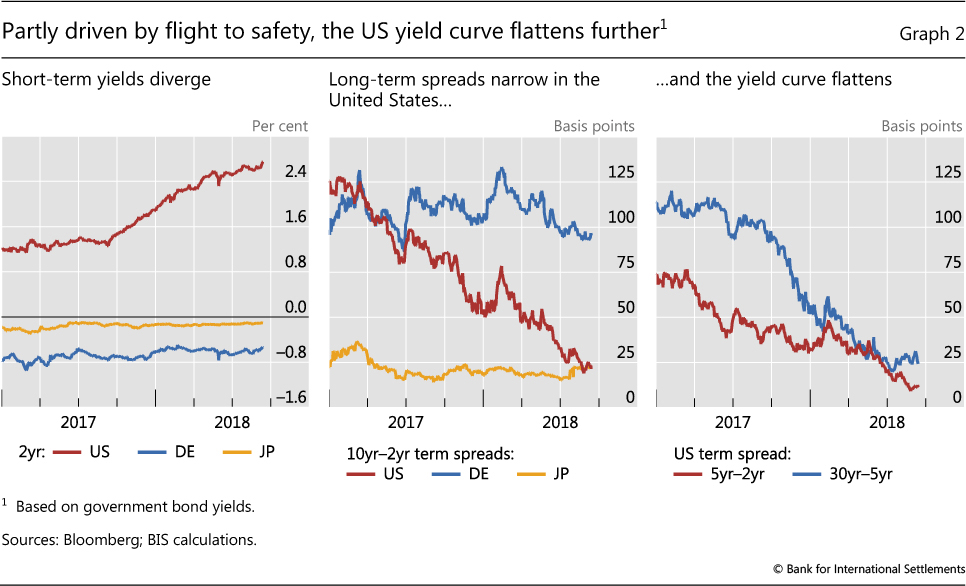
The term spread continued narrowing in the United States. Short-term yields rose further, but at a slower pace than earlier in the year (Graph 2, left-hand panel). And at the longer end, the 10-year yield fluctuated just below 3% for much of the period under review, in part weighed down by the flight to safety in the wake of stress in EMEs. By mid-September, the spread between 10- and two-year instruments was down to 25 basis points, almost the same as in Japan, and about 70 basis points below that of German bunds (Graph 2, centre panel). The compression extended to most of the term structure: yields at all maturities from two to 30 years were within 50 basis points of one another (Graph 2, right-hand panel). The low term premium helped to keep long-term yields low.1
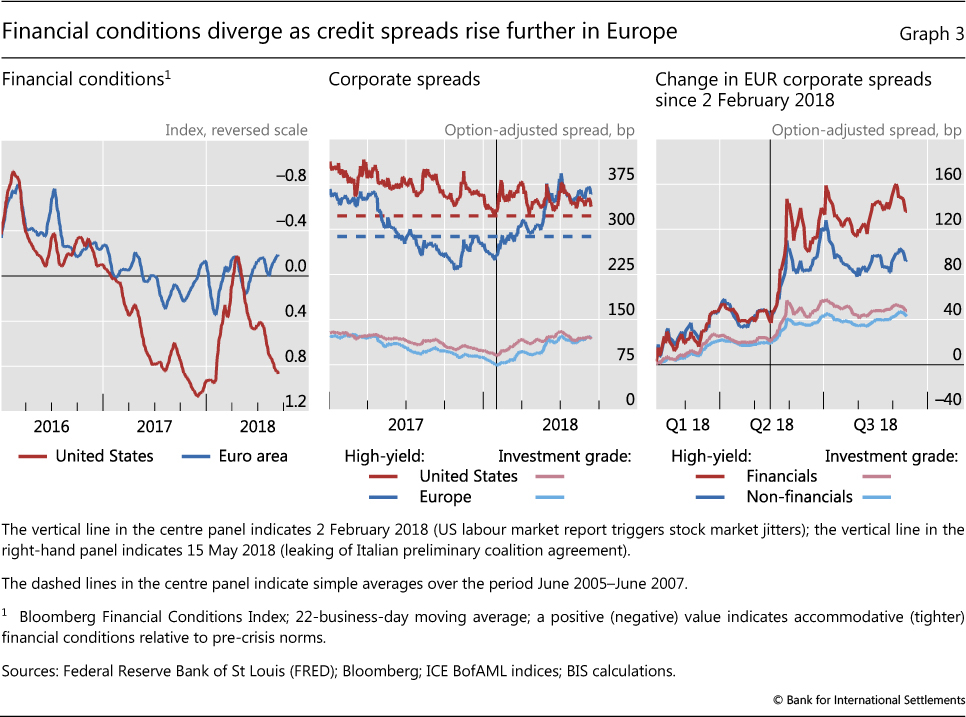
Overall, US financial conditions eased further or stayed flat. Broad gauges of financial conditions had pointed to an easing since April, after a brief tightening period on the heels of February's spike in stock market volatility. The easing slowed in June but resumed in July as trade tensions escalated once again. The Bloomberg financial conditions index ended the review period within reach of the post-GFC trough recorded in late 2017 (Graph 3, left-hand panel). That said, US investment grade corporate credit spreads remained broadly unchanged, arresting the moderate widening trend that had followed the February market jitters. Corporate high-yield spreads in the United States, while volatile, stayed close to post-GFC averages (Graph 3, centre panel). Moreover, these spreads remained far below their long-term average of 1997, and not far from the very narrow levels they had reached before the GFC. In other words, the high level of risk-taking continued unabated, to a large extent.2 Along the same lines, leveraged finance remained buoyant, bolstered by the ongoing search for yield, as investors flocked to floating rate instruments, probably fearing further increases in bond yields and hence capital losses - a prospect that the major fiscal stimulus so late in the expansion made all the more probable (Box A).
Comparable indicators of financial conditions for Europe stayed basically unchanged, and close to neutral (Graph 3, left-hand panel). Yet European corporate credit spreads rose further above the high plateau reached after a mid-May jump. On the whole, European investment grade corporate spreads fully caught up with the level of their US peers (Graph 3, centre panel). And European high-yield corporate spreads continued rising above their post-GFC average, even surpassing their US counterparts. A key factor was financial institutions' higher borrowing costs (Graph 3, right-hand panel), especially after the political tensions of mid-May in Italy and the currency crisis in Turkey during early August (Box B). Between June and mid-September, the high-yield spreads of European financial corporates rose about 30 basis points. In contrast, non-financial spreads increased only about 10 basis points. The magnitudes were much smaller in the investment grade space, but financial corporate credit spreads in Europe remained higher than non-financial ones.
Sentiment towards EME assets turns sharply
Even as AE markets were buoyant or stable, sentiment turned sharply against EME assets. Several factors were at play. The common thread was the tightening of liquidity conditions linked to the Federal Reserve's removal of accommodation. The US dollar served as the main transmission channel. After a prolonged period of weakness that spanned all of 2017, the dollar had turned in early February following an unexpectedly strong US labour market report, which also rocked global stock markets.3 Its appreciation accelerated in late April, while global trade tensions escalated. The appreciation put pressure on EME dollar borrowers and also eroded returns on EME local currency assets (including equity). As a result, portfolio inflows slowed down sharply, and turned into outright outflows in some jurisdictions. China's perceived slowdown, which trade disruptions could only worsen, contributed to souring the mood towards emerging markets as an asset class. The concurrent currency crises in Argentina and Turkey, though mostly driven by domestic factors, both reflected and cemented investors' broader change in attitude. The turbulence led investors to take a closer look at banks' exposures to EMEs (Box C).
EME currency depreciation continued unabated in the period under review. Between June and mid-September, the trade-weighted US dollar gained more than 5% against major EME currencies while staying range-bound vis-à-vis major AE currencies (Graph 4, left-hand panel). This fall prolonged a trend that had started in February. Since then, EME currencies have weakened by about 12%, almost twice as much as AE currencies.
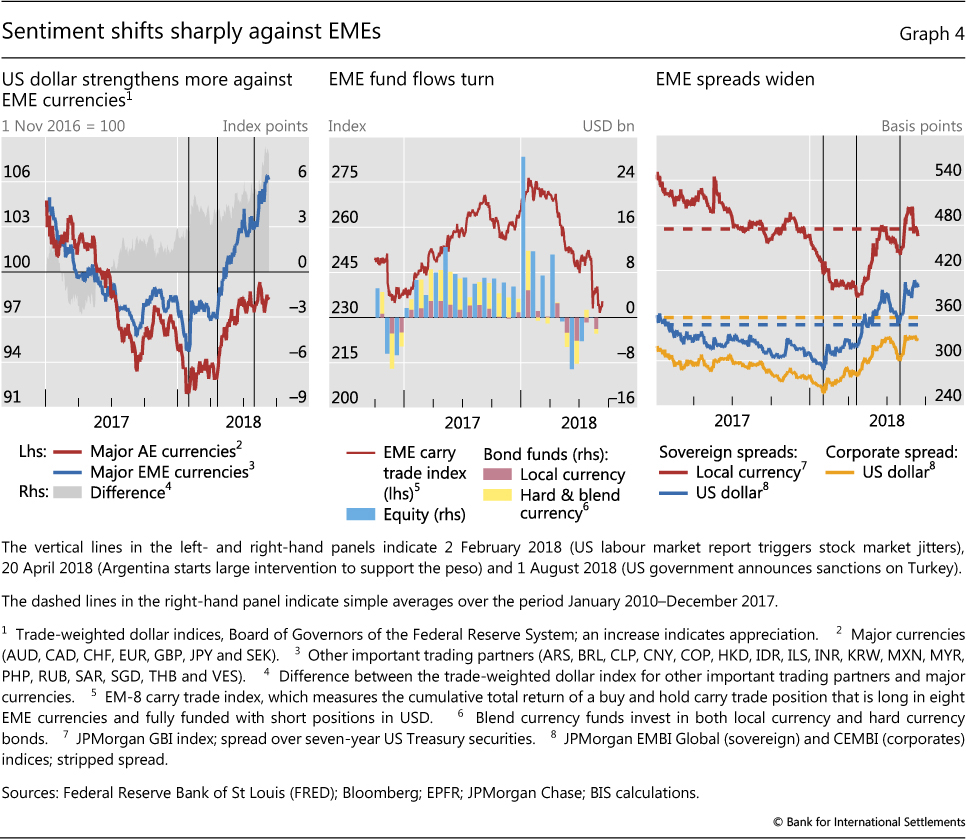
The long and unprecedented run of 16 consecutive months of net inflows to EME investment funds was cut short in May (Graph 4, centre panel). The slowdown had actually started in February for hard currency bond funds, and then extended to equity and local currency bonds as the US dollar appreciation accelerated in late April. This in turn reduced the returns on those assets for dollar-based investors. Unusually large EME carry trade returns4 fell precipitously as from April, dropping in August below the low levels of November 2016 (Graph 4, centre panel).
Consistent with exchange rate dynamics, EME sovereign spreads widened further during the review period. But spreads had been under pressure for most of the year. The spreads on US dollar-denominated debt for EME sovereigns had risen about 110 basis points since February (Graph 4, right-hand panel), decisively bolting above the post-GFC sovereign average in August. Spreads of local currency-denominated government bonds continued to fall for a few more weeks, reaching a turning point in late April. After a brief lull in June and July, these spreads spiked once again as Turkey came under stress in August.
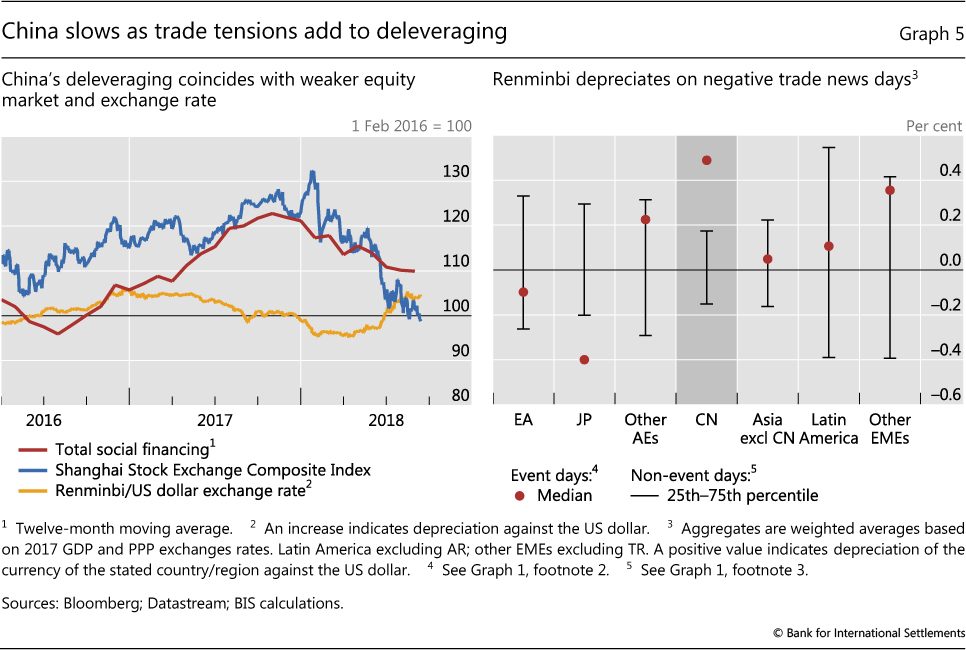
Against this backdrop, concerns over decelerating economic activity in China added to investors' pessimism. On the back of the Chinese government's previous efforts to curb shadow banking activities, credit to the real economy had begun to decline and equity markets to slip starting late last year (Graph 5, left-hand panel). July's indicators of economic activity disappointed. The escalating US-China trade tensions further undermined stock prices and weighed on the Chinese currency: among a group of AE and EME currencies, the renminbi recorded unusually large daily depreciations in response to trade-related news (Graph 5, right-hand panel). To avoid excessive financial tightening, the People's Bank of China (PBC) chose to ease monetary conditions once again in late June, and the government unveiled fiscal stimulus packages in July, with both moves helping to stabilise markets.
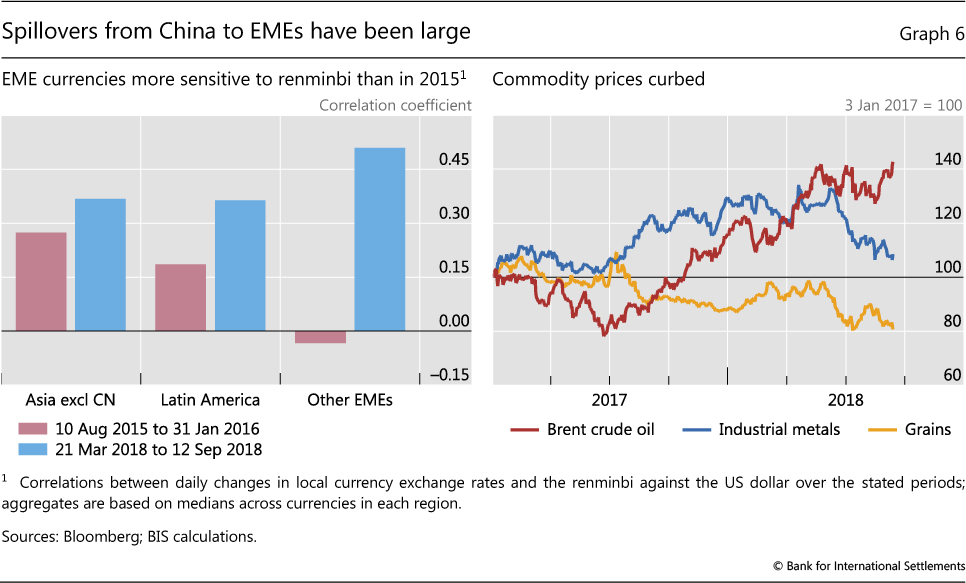
These warning signs had a particularly strong impact on EMEs, especially in Asia, and on commodity markets. The sensitivity of EME currencies to the renminbi's movements during this period was higher than during the stress that followed the renminbi depreciation of August 2015 (Graph 6, left-hand panel). The perceived economic slowdown seemed to contribute to a halt in the rally of oil prices in April, and heralded the substantial drop in some commodity prices that began in June - in particular, industrial metals and grains (Graph 6, right-hand panel).
This increasingly unforgiving environment heightened domestic vulnerabilities. The parallel currency crises in Argentina and Turkey illustrated the point. Both countries had already been in a vulnerable position for quite some time. Both had run persistently large current account deficits, and to a large extent used FX debt to finance a sizeable fiscal deficit (Argentina) and a private sector credit boom (Turkey). In the case of Turkey, as political tensions with the United States came to the fore and doubts about central bank independence grew, the currency suddenly collapsed in early August. Argentina had been under pressure since late April, and the crisis finally flared up in late August after easing somewhat in between in the wake of an IMF standby agreement.
While contagion of severe stress was generally contained, these concurrent crises triggered spillovers to other EMEs. Those spillovers differed markedly across countries. As in previous episodes, the exchange rate was a good barometer of stress. The factors explaining differences in currency performance appeared to be related to countries' perceived vulnerability. In particular, countries with higher inflation and current account deficits tended to experience stronger currency depreciations (Graph 7, left-hand panel). Political uncertainty also sometimes played a role, as in the cases of Brazil and Russia, whose currency depreciations appeared to be out of line with their current account deficits and inflation rates. Higher inflation went hand in hand with higher sovereign spreads (Graph 7, centre panel). Thus, high-yield emerging markets, ie those presumably perceived as riskier at the outset, suffered heightened stress as sentiment turned.
The recent episodes of financial stress followed a series of shocks to EME assets, dating back to the beginning of the trade tensions in March. For most asset classes, the cumulative toll surpassed the total impact of the shocks corresponding to the taper tantrum of 2013, while coming close to that experienced in the aftermath of China's devaluation in August 2015 (Graph 7, right-hand panel).5 Yet so far, the levels of sovereign spreads during the current stress have stayed generally below those observed in previous events. For instance, as of mid-September the index of EME sovereign spreads in the US dollar was still below 415 basis points. That was the index's starting point before the August 2015 renminbi devaluation episode.
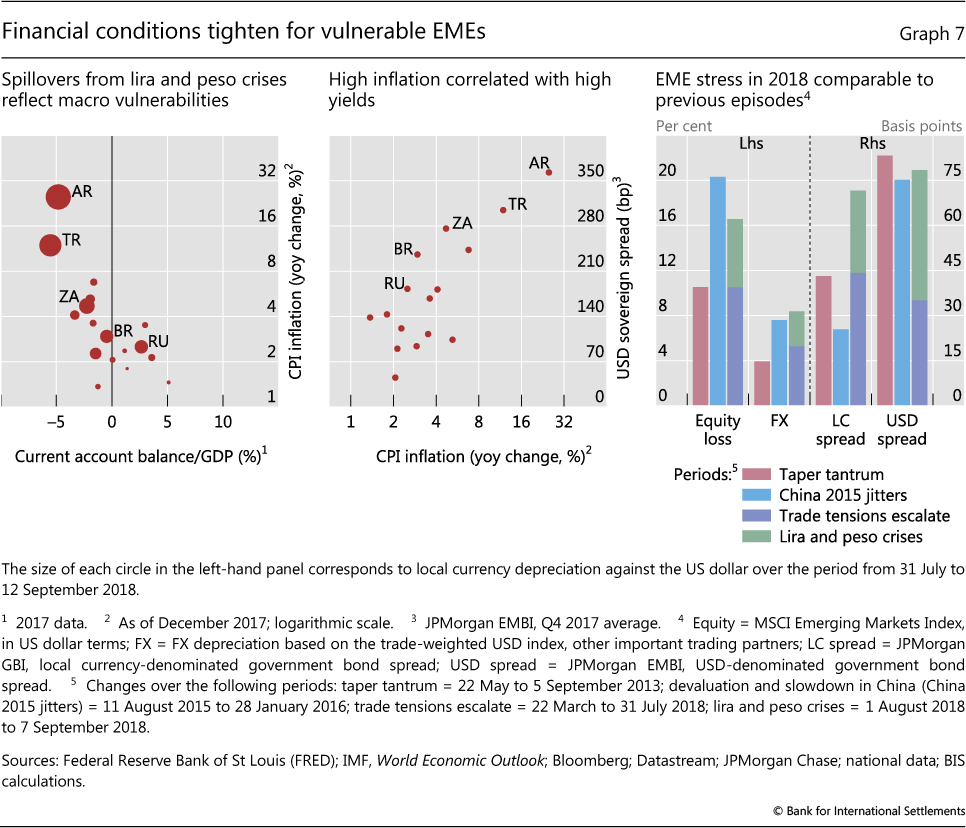
The shifts in FX and bond markets during the year also underscored EMEs' persistent sensitivity to the strength of the US dollar. Large depreciations contributed to credit risk concerns, and hence to wider spreads on US dollar-denominated bonds. At the same time, they exacerbated dollar-based investors' losses on local currency instruments. Thus, rises in local currency yields also ensued, and were significantly larger than in previous episodes of market distress (Graph 7, right-hand panel). EMEs' ability to issue bonds in their own currencies has improved markedly in recent years. But the vulnerability of local currency government debt to abrupt swings in the dollar suggests that local currency issuance has not yet succeeded in significantly insulating their financial conditions from exchange rate shifts.
Box A
The rise of leveraged loans: a risky resurgence?
Leveraged finance, comprising high-yield bond and leveraged loan-based finance, has doubled in size since the Great Financial Crisis (GFC) (Graph A, first panel, shaded areas). A vehicle for investors' risk-taking, leveraged finance has behaved procyclically. The market for financing highly leveraged transactions flourished in the United States in the 1980s before collapsing during the recession of the early 1990s. It again grew rapidly in the mid-2000s before stalling during the GFC. Leveraged loan volumes have been particularly procyclical - rising faster than high-yield bonds in the run-up to the GFC and during the subsequent period of extraordinary monetary accommodation (Graph A, first panel, red line). Focusing on the recent growth of leveraged loans, this box examines the underlying drivers and the vulnerabilities that monetary policy normalisation may expose.
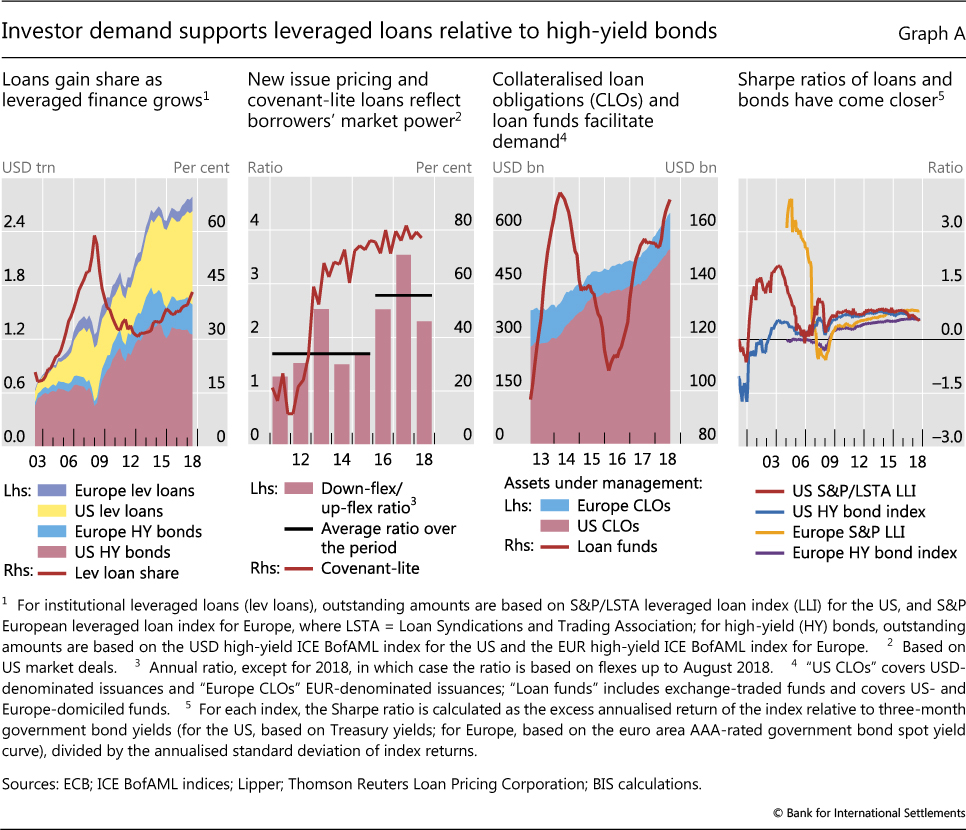
Investor demand is an important driver of the recent growth in leveraged loans. For one, this is evident from investors' continuing willingness to accept weaker protection against deterioration in borrowers' repayment capacity. Specifically, the fraction of covenant-lite loans reached its post-GFC peak in late 2017 (Graph A, second panel), while the average number of covenants per loan with covenants has decreased by 25%. That investors are not necessarily being compensated for this risk can be seen in the behaviour of price flexes: adjustments to new-issue spreads that a loan arranger makes in order to clear the primary market. The ratio of down- to up-flexes has risen markedly in recent years, with borrowers benefiting from lower loan spreads (Graph A, second panel). In addition, strong investor demand for leveraged loans has supported refinancing. In the United States, for instance, debt refinancing has accounted for 60% of institutional leveraged loan issuance since 2015. This share increased during the first half of 2018. All this is consistent with investors reaching for yield in a low interest rate environment. The recent prospect of (continued) interest rate rises has increased the relative appeal of leveraged loans, which - unlike most high-yield bonds - offer a return that is indexed to the interbank rate.
Developments in the securitisations market have also contributed to the growth in leveraged loans. Originator banks are finding it easier to securitise and sell these loans. This can be seen in the growing investment in loans by securitised structures such as collateralised loan obligations (CLOs), especially in the last couple of years (Graph A, third panel). Unlike during the run-up to the GFC, banks no longer effectively retain a large portion of these securitisations through off-balance sheet vehicles. Instead, the post-GFC risk retention rule requires banks to retain a relatively small portion of issued securitisations on their balance sheet. In the case of US open market CLO fund managers for whom this rule applied initially, a February 2018 court ruling reversed this requirement, further supporting the demand for loans. Also supporting demand is the strong growth in loan mutual funds since 2016 (Graph A, third panel). As a by-product of these developments, the substitutability between leveraged loans and high-yield bonds has increased from an investor's point of view, hence the convergence in their risk-return characteristics (Graph A, fourth panel).
Factors increasing the willingness of and incentives for banks to provide credit may also have been at work. Recent shifts in the approach to enforcing leveraged lending guidelines in the United States seem to have made it easier for banks to arrange such loans. More broadly, the leveraged credit market has been buoyed by a favourable macroeconomic background and strong equity markets. Corporate restructurings such as mergers, acquisitions and leveraged buyouts have accounted for close to 40% of US institutional leveraged loan issuance since 2015.
As business cycles mature, however, investors may start to incur losses. The default rate of US institutional leveraged loans increased from around 2% in mid-2017 to 2.5% in June 2018. Going forward, as monetary policy normalises, the floating rate feature of leveraged loans could trigger defaults by worsening borrowers' debt coverage ratios (DCRs): the ratio of net operating income to debt service costs. Despite healthy corporate profits in the last few years, market participants have begun to report lower DCRs. Even the loan recovery rates during the next downturn could be smaller given that the debt cushion - ie the level of unsecured junior debt that absorbs losses before senior loans in a default - of leveraged loans has decreased.
Concerns also centre on funding and market liquidity risks. For one, the concentration of BBB borrowers has risen, which means that, in a downturn, downgrades among BBB borrowers to a BB or lower rating - ie speculative grade - would lead some investors to dump this debt. The relative illiquidity of leveraged loan markets could exacerbate the resulting price impact. Moreover, given that mutual funds are a major buyer, mark-to-market losses could spur fund redemptions, induce fire sales and further depress prices. These dynamics may affect not only investors holding these loans, but also the broader economy by blocking the flow of funds to the leveraged credit market.
The interest rate on most loans is reset periodically to a spread over a reference rate, typically Libor or its equivalent. See http://www.leveragedloan.com/primer/, S&P Global Market Intelligence. In March 2013, US federal banking agencies issued Leveraged Lending Guidance (LLG) setting limits on parameters such as debt-to-income ratios and maturity. In October 2017, the US Government Accountability Office determined that the LLG is subject to the requirements of the Congressional Review Act, meaning that, in principle, the Congress can overturn it. See https://www.gao.gov/products/B-329272#mt=e-report. In early 2018, senior officials from some US banking agencies signalled greater accommodation with respect to leveraged lending. Relatedly, in September 2018, a joint statement by US banking agencies clarified the non-binding role of supervisory guidance, one that is distinct from laws or regulations. See www.federalreserve.gov/supervisionreg/srletters/sr1805a1.pdf. See B Hofmann and G Peersman, "Is there a debt service channel of monetary transmission?", BIS Quarterly Review, December 2017. For evidence on the increase in concentration of BBB borrowers, see "Strong outlook with low inflation spurs risk-taking", BIS Quarterly Review, September 2017.
Box B
Sovereign and bank tensions in the euro area
During the second and third quarters of 2018, tensions originating in international trade, the political landscape, and spillovers from the current stress in EMEs weighed on asset valuations in the euro area. Among others, markets focused particularly on the political situation in Italy and the crisis in Turkey, as well as trade tensions with the United States.
The Italian sovereign has recently gone through a series of idiosyncratic episodes of bond market stress. For instance, the spread of Italy's two-year yields vis-à-vis Germany's widened in the wake of the recent events in Turkey by much more than those of other euro area countries (Graph B, first panel). However, political events had already led to a significant widening in the Italian-German spread. The spread had begun to drift higher in mid-May with the leaking of a preliminary draft of the coalition's governing programme. And on 29 May, after the interim prime minister was appointed, it surged almost 200 basis points and reached levels not seen since August 2012. Although this spread increase surpassed any daily changes observed during the European sovereign debt crisis, the level of the Italian sovereign spread remained below those from the crisis period. Wider spreads seemed to reflect investors' concerns about future political uncertainty, especially over the potential fiscal policies of the new government.
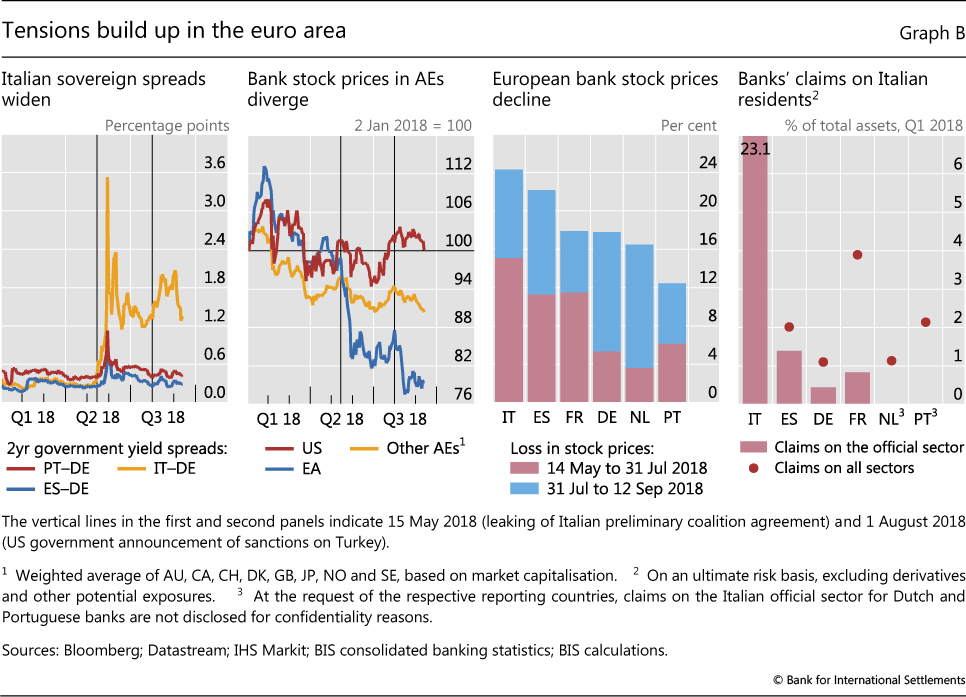
The combination of stress in Italian sovereign bond markets and the currency crisis in Turkey put great pressure on euro area banks. Their stock prices vastly underperformed those of their peers from other advanced economies. An aggregate index tracking euro area banks' stock price performance dropped almost 20% from mid-May through mid-September (Graph B, second panel). In contrast, US banks traded sideways and other advanced economies' banks experienced much more moderate losses. The divergence between bank equity price performance in the euro area and the United States started in May, when political uncertainty in Italy increased. Euro area bank stocks traded sideways for several weeks afterwards, before the currency crisis in Turkey triggered another large step down.
Losses in bank stock prices varied significantly across countries. The losses from mid-May up to end-July were sharper for banks in France, Italy and Spain (Graph B, third panel, red bars). In part, this reflected banks' direct and indirect exposures to the Italian government and other Italian borrowers (fourth panel). The direct channel of transmission might work through large mark-to-market losses on government bond holdings and other assets, which would weaken banks' capital base. Potential indirect channels include tougher funding conditions as credit spreads rise for Italian banks and other large euro area banks.
Spillovers from the financial stress in Turkey deepened these concerns, as euro area banks were generally perceived as having large exposures to Turkish borrowers. To some extent, the correction triggered by the Turkish market turmoil had a greater impact on the banks that were most exposed to Turkish borrowers (Graph B, third panel, blue bars). But the losses were not necessarily proportionate to the size of the exposures. In fact, the underlying risk resulting from banks' country exposures is difficult to assess, as there are many factors that influence how banks might respond to adverse developments (Box C). Stock price losses may also have revealed investors' assessment about the prospective resilience of banks to future large shocks, as well as other country- and sector-specific developments. For example, German banks were hindered by their broader earning underperformance, and Italian banks were already perceived as relatively weaker.
Box C
Using the BIS consolidated banking statistics to analyse country risk exposures
A primer illustrated with banks' exposures to Turkey
The BIS consolidated banking statistics (CBS) are a useful starting point for analysing banks' exposure to country risk - the risk that borrowers may be unable or unwilling to fulfil their foreign obligations for country-specific economic or political reasons beyond the usual counterparty-specific factors. However, the CBS provide only part of the information needed for a comprehensive analysis of these exposures. In this box, we summarise what the CBS show and do not show about them, using as an example the data published about Turkey in Table B4 on the BIS website.
The CBS provide information about the country and sectoral composition of banks' assets on a worldwide consolidated basis. In particular, they capture the outstanding claims and other exposures of banking groups headquartered in 31 reporting countries on counterparties in over 200 borrower countries, excluding intragroup positions but including the business of foreign banking subsidiaries that are majority-owned or otherwise controlled by the group.
At end-March 2018, foreign banks had $223 billion in outstanding loans, securities holdings and other claims on residents of Turkey (Graph C, left-hand panel). More than half of these claims ($135 billion) were on borrowers in the non-bank private sector - mainly non-financial corporations and households, with smaller amounts on non-bank financial institutions. Claims on banks accounted for a further $50 billion, with the remainder, $38 billion, on the official sector - government and central bank. On top of these claims, foreign banks had exposures to Turkey through three additional items: derivatives contracts with counterparties in the country, the positive market value of which stood at $4 billion at end-March 2018; credit protection sold against entities in Turkey and other guarantees extended ($53 billion); and outstanding credit commitments to resident borrowers ($22 billion).
For assessing banks' vulnerability to country risk, the absolute size of exposures is a less relevant metric than the relative size - for instance, scaled by banks' total equity or Tier 1 capital. Indeed, the banks with the largest absolute exposures to a country are often not those most exposed relative to capital. For example, at end-March 2018 Belgian banks' claims on Turkey (less than $1 billion) were much smaller than the claims of German banks (nearly $13 billion), but relative to total capital the two banking systems had similar exposures (2.3% and 2.4%, respectively).
Even when scaled, the CBS provide only a rough indication of which banks are the most vulnerable to country risk because of the high degree of aggregation and incomplete information. The CBS sum together the exposures of all banking groups headquartered in the reporting country and consequently may mask large differences among individual banks. They also sum together various types of exposures (eg loans, guarantees), which may have very different risk characteristics. Furthermore, some banks' outstanding exposures may be closer to their market value than those of others, depending on accounting practices and the share of the portfolio invested in assets with reliable fair market values. Finally, the CBS exclude provisions that banks might have set aside against potential losses.
Information about banks' business models is also relevant to understanding how banks might respond to adverse developments in a country. An especially important factor is the structure of banks' foreign business. Some banks conduct their international business mainly on a cross-border basis out of their home country or in financial centres. Other banks follow a multinational model and set up foreign subsidiaries, in which they invest specific amounts of capital and that borrow locally to finance assets. The CBS do not distinguish between these business models. Yet a multinational bank could choose to sell its subsidiary or even let it fail, writing down the capital that the bank invested in its subsidiary. If it were to do so, the bank's exposure would be limited to its equity participation in the subsidiary plus any intragroup funding and guarantees extended to the subsidiary. This sum is likely to be substantially smaller than the assets of the subsidiary that are included in the exposure measures of the CBS.
Whether a bank decides to take advantage of the option to reduce its exposure to its subsidiary depends on its assessment of the associated benefits and costs. A myriad of factors influence this decision, including: the amount of intragroup funding and guarantees extended to the subsidiary; the ownership structure (eg whether the subsidiary is wholly owned or a joint venture); the overall financial health of the group; risks to the reputation of other parts of the group; the regulatory framework (eg multiple- versus single-point-of-entry resolution regimes); the broader context in which the losses arise; and the prospects for a recovery from the economic or political uncertainty affecting the country
The CBS provide some information, albeit imperfect, about the importance of subsidiaries by dint of the distinction between local and cross-border claims. Local claims are those booked by branches and subsidiaries located in the same country as the counterparty. Local claims can in turn be decomposed into those denominated in local currencies (LCLC) and those in foreign currencies (LCFC). In the CBS on an immediate counterparty basis, LCLC are published separately but LCFC are published jointly with cross-border claims as "international" claims. In Turkey, local claims denominated in the Turkish lira (TRY) amounted to $82 billion at end-March 2018. In addition, LCFC accounted for a substantial portion of the $164 billion in international claims. As a result, local claims denominated in all currencies accounted for over 50% of foreign banks' total claims on the country.
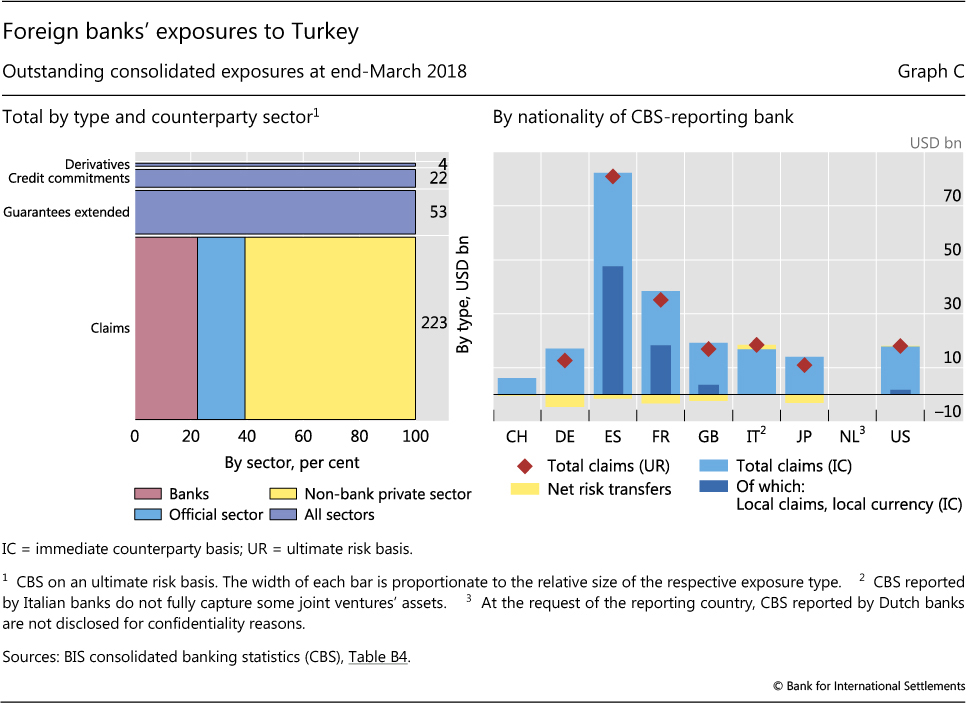
The published CBS show that Spanish and French banks had the largest TRY-denominated local claims on Turkey, at $48 billion and $18 billion, respectively, at end-March 2018 (Graph C, right-hand panel). A substantial portion of these banks' international claims are also local claims, denominated in foreign currencies. Italian and Dutch banks also have exposures via local subsidiaries, but these are not adequately captured in the published CBS. Data from the European Banking Authority show that Italian banks had total exposures on Turkey, including guarantees and credit commitments, in excess of $67 billion and Dutch banks $34 billion, albeit at end-June 2017. Notably, in US dollar terms, the exposures of those banks with Turkish subsidiaries fell significantly in mid-2018 owing to the sharp depreciation of the TRY and the consequent decline in the US dollar value of their TRY-denominated claims.
Another way that banks can reduce their exposure to a given country or sector is by using credit risk transfer instruments to shift risks from one counterparty to another. One common example is buying credit protection through credit default swaps. The CBS on an ultimate risk (UR) basis take account of banks' use of such risk transfers and so provide a measure of banks' exposure that complements the on-balance sheet claims captured by the CBS on an immediate counterparty (IC) basis.
Banks tend to use risk transfers to hedge a larger share of their cross-border exposures than their local exposures. Consequently, country risk transfers tend to be proportionately larger for banks that conduct mostly cross-border business, as opposed to multinational banks with subsidiaries. For example, at end-March 2018 the IC claims of Spanish banks on Turkey, which are mostly booked through local subsidiaries, were only 2% ($1 billion) higher than their UR claims. By contrast, UK banks' IC claims, which are mostly in the form of cross-border claims, were 14% ($2 billion) higher than their UR claims.
In summary, the CBS provide a useful starting point for analysing banks' country risk exposures, based on a set of simple metrics. However, a fuller analysis requires them to be combined with information about banks' business models, financial health, consolidation and accounting practices, and risk transfers. Such information is regularly provided by supervisors and banks themselves, in their communications about the possible impact of and responses to adverse developments in borrower countries.
For further discussion of what the CBS show, see BIS, "What the BIS banking statistics say (and what they do not) about banking systems' exposures to particular countries and sectors", BIS Quarterly Review, March 2011. The perimeter of consolidation is not harmonised across reporting countries. For a summary of differences, see BIS, "Potential enhancements to the BIS international banking statistics", Annex B, March 2017. The CBS reported by Italian banks do not fully capture some joint ventures' assets, while the exposures of Dutch banks are not disclosed for confidentiality reasons.
1 See B Cohen, P Hördahl and D Xia, "Term premia: models and some stylised facts", BIS Quarterly Review, September 2018.
2 See C Borio, "Macroprudential frameworks: experience, prospects and a way forward", speech on the occasion of the BIS Annual General Meeting, Basel, 24 June 2018.
3 See "Volatility is back", BIS Quarterly Review, March 2018.
4 In this context, an EME carry trade denotes a buy and hold position that acquires an interest-bearing instrument denominated in an EME currency and is fully funded with US dollar borrowing.
5 The event window to measure the impact of the taper tantrum runs from 22 May 2013 (Fed Chairman's testimony before the US Congress) to 5 September 2013 (10-year US Treasury yield reaches a local peak). The event window to measure the impact of the renminbi devaluation and slowdown in China runs from 11 August 2015 (PBC announces its reform of the daily fixing of the renminbi) to 28 January 2016 (Shanghai Composite reaches a local trough after China's manufacturing purchasing managers' index disappoints on 31 December 2015). The qualitative results do not change significantly for alternative windows within 20 trading days either side of these end dates.