The ABCs of bank PBRs: What drives bank price-to-book ratios?
Price-to-book ratios have been unusually low for many banks since the Great Financial Crisis. Ratios below one, in particular, have been seen as reflecting market concerns about banks' health and profitability as well as the need for shifts in business models. But what drives these valuations globally? What explains consistently low levels for some banks and jurisdictions? This special feature proposes an empirical valuation methodology based on the intangible value attached to bank assets and liabilities. Our model fits the data well across time and banks, suggesting that measures targeting traditional drivers of profitability, such as the proactive management of non-performing loans, remain essential in enhancing bank valuations.1
JEL classification: G21, G28, G3.
Banks have gone through difficult times. Following the Great Financial Crisis (GFC), profitability has been hamstrung by a protracted period of tepid economic growth, muted demand for banking services, unusually low interest rates and flat yield curves. Now that near-term economic prospects have brightened substantially, the outlook for banks' bottom line is finally improving. Client demand is rising and intermediation margins are starting to widen, supporting revenue growth. As a result, following the recent finalisation of the Basel III package of regulatory reforms (BCBS (2017a)) and given the progress that has already been made in complying with the new capital and liquidity requirements (BCBS (2017b)), a window of opportunity is opening up for banks to finalise their adjustment to the new post-crisis environment (BIS (2017)).
Despite this improved outlook, however, price-to-book ratios (PBRs) remain low for many banks, especially in Europe. The PBR is the ratio of the market value of a bank's equity to its accounting, or book, value. On this basis, PBRs are often thought of as a yardstick of franchise value - that is, investors' expectations of how much shareholder value the company's management will be able to create from a given stock of assets and liabilities. As such, PBRs are also an indicator of banks' health and their ability to support economic activity. What explains these stubbornly low valuations, and what - if anything - can be done about them? Are the sources of post-crisis bank valuation much different from the pre-crisis ones? And, if so, could tighter bank regulation be responsible for the lower post-crisis valuations?
This special feature seeks to answer these questions by analysing the drivers of bank PBRs. We find that, while current bank PBRs are indeed rather low, they are not generally out of line with what would be predicted from our valuation model, which is estimated on a sample based on both pre-and post-GFC data. With some of the key drivers under direct management control, this suggests that banks are well placed to improve their valuations through time-tested measures, such as the proactive management of non-performing loans (NPLs) and tight control of non-interest expenses. As such, with key drivers that are unrelated to regulatory reform explaining much of the observed change in PBRs, our findings cast some doubt on explanations that assign a large role to regulation as a source of low current bank PBRs (eg Chousakos and Gorton (2017)).
In terms of methodology, we apply a bank valuation model based on earnings and intangibles, as described in Calomiris and Nissim (2014), to an international sample of banks. On the one hand, our valuation equation (VE) proxies expected cash flow via banks' return-on-equity (ROE) and other bank income measures. On the other hand, our VE assumes that bank value derives in part from the intangible value created by banks' core loan and deposit relationships. We capture this through various accounting metrics derived from bank balance sheets and income statements.
The remainder of the paper is organised as follows. The second section introduces the PBR concept and reviews recent trends in bank valuations. The third section undertakes the econometric analysis and estimates the valuation equation. The fourth discusses the implications of the results, followed by various robustness checks. The final section concludes, with policy-relevant implications.
Recent trends
Our variable of interest is bank value, as measured by PBRs. A bank's PBR is defined as the ratio of the market value of equity to its book value.2 Use of PBRs in the assessment of bank valuations emphasises the intangible value created by banks' core loan and deposit relationships as a driver of investor behaviour - enabling banks to earn profits above and beyond what would have been possible strictly based on banks' book value alone (see box). This suggests that, in order to understand the drivers of PBRs, one should start from observed book values and then examine the degree to which various measures of bank activity contribute to a market premium above (or discount from) these book values. In PBR terms, values above one would suggest positive market premia from intangibles (eg from the funding advantage afforded by stable and relatively cheap deposit funding and related cross-selling of services), while values below one would suggest discounts (eg due to delayed loss recognition in the recorded book value of bank assets).
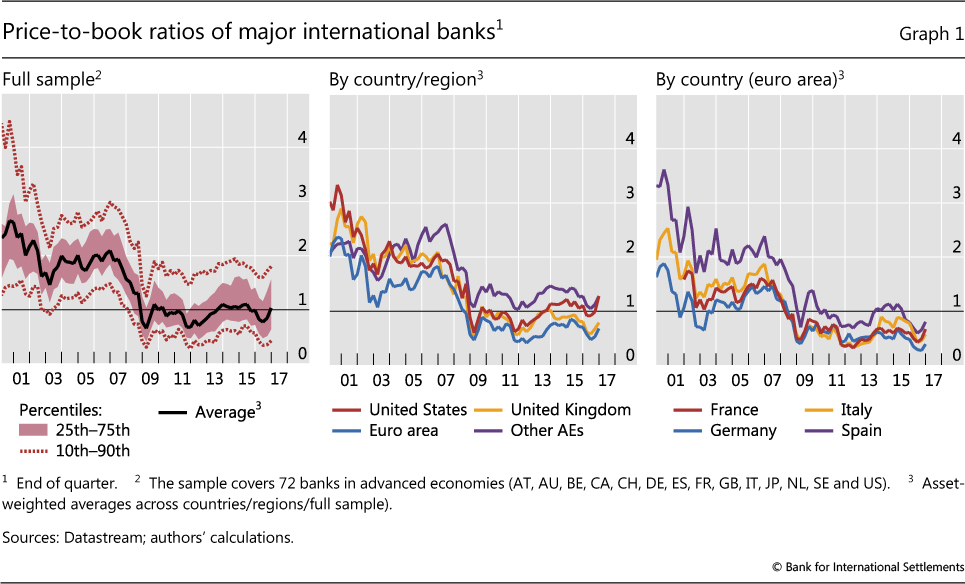
As measured by PBRs, bank values have been subject to a number of broad global trends that a satisfactory bank valuation approach would have to capture. First, there was a widespread decline in bank valuations during the GFC (Graph 1, left-hand panel). Average bank PBRs hovered around a level of two times book value right before the GFC, indicating large valuation premia. They then plummeted to values below one in 2008-09, and recovered only recently - while remaining below their pre-crisis levels.3 Importantly, valuations in the higher and lower percentiles exhibit very similar trends, highlighting that average PBR performance has not been skewed by outliers.
Bank valuation and price-to-book ratios (PBRs)
What's special about valuing banks? One key factor is regulation, which is much more stringent for banks than for corporates. Specifically, banks are typically required to maintain predefined regulatory capital adequacy ratios based on their book value of equity. More importantly, however, the accounting treatment of banks and their activities can differ substantially from that of non-financial corporates. As a result, book values are often more meaningful measures of value for financial firms than for non-financial ones.
Accounting for bank assets. Accounting practices are important for bank valuations for two reasons. First, the assets held by banks are typically in the form of financial instruments (loans, bonds and other securities as well as derivatives) that have well defined cash flows. The majority of bank assets (loans, investments and other assets) are reported at amortised cost. However, for larger banks many financial instruments are traded in relatively liquid markets, at least under normal conditions, or are substantially similar to traded assets. This is why marking traded and, in some cases, non-traded assets to market has long been established practice among banks. With a significant portion of assets on banks' balance sheets treated in this way, book values are much closer to market values than is the case for non-financial corporates, where most of the assets are carried at amortised cost. Similarly, depreciation, which can be a key driver of book values for corporates, tends to be much less important for banks, which hold relatively few real assets.
Second, it is natural for bank assets to be subject to credit and other risks that can imply the potential for large, possibly abrupt losses, with loss provisions being made to report estimated credit losses as an allowance reducing the value of the loan portfolio and reported earnings. In practice, banks have discretion in setting their provisioning policies. For a given loan portfolio, conservative banks will set aside more for loan losses, implying lower profits during good times than those generated by their more aggressive peers. Indeed, the literature suggests that delayed loss recognition (or "purposeful understatement of losses"; Huizinga and Laeven (2012)) has been a significant factor for US banks during the recent financial crisis, especially in the context of their mortgage market exposures. Expected credit loss accounting, due to be implemented globally during 2018-21, is intended to improve the incorporation of forward-looking credit risks into book asset valuations and earnings. Against this background, depressed PBRs would tend to reflect the effect of accounting rules on recognised book values as well as attempts by bank managers to preserve their institutions' (book) capital positions.
Implications for bank valuation metrics. For banks and other financial firms, therefore, combining book- and market-based valuation metrics can provide useful information. In particular, price-to-book ratios (PBRs) above one - which have tended to prevail under normal market conditions - will tend to be driven by the market value of intangible assets and liabilities, which in turn may be affected by market developments and the competitive environment in ways that are not reflected in their book values.
Changing economic conditions would thus be expected to affect PBRs largely via their effect on intangibles, on both the asset (eg Diamond (1984)) and liability sides (Gorton and Pennacchi (1990)) of the balance sheet. For example, if interest rates are low for an extended period, having a stable base of core deposits may be less valuable to banks, to the extent that they are unable to reprice deposit rates in line with rates earned on the asset side of their balance sheets (BIS (2016)). Similarly, loan relationships may lose value if the economic environment implies a lower ability for banks to benefit from the cross-selling of services.
For a more detailed discussion, see Damodaran (2009) and Calomiris and Nissim (2014). See Cohen and Edwards (2017).
Second, while advanced economy banks shared the crisis-induced decline and subsequent partial recovery, cross-country differences have been substantial. Euro area banks, in particular, stand out, with valuations underperforming those of many of their international peers (Graph 1, centre panel). A closer look at the euro area data, in turn, suggests that the evolution of bank valuations there reflected more than just the effects of the 2010-12 euro area sovereign debt crisis (Graph 1, right-hand panel). Most euro area banks' valuations have yet to recover from their collapse during the GFC, but cross-country differences remain, for instance between German and Spanish banks. This suggests that important banking system-level drivers, including - but not limited to - home market macroeconomic performance, have been at play.
Modelling bank valuations
Analytical setup
We investigate observed bank PBRs by way of a panel regression framework. Our approach is based on a bank valuation model emphasising the value created by banks' core loan and deposit relationships (Calomiris and Nissim (2014)); in addition to investors' earnings expectations, as proxied by the return-on-equity (ROE). In this setting, PBRs would be driven by the market value of intangibles and other drivers of future earnings (Gordon (1962), Damodaran (2009)), to the extent that these are not already reflected in observed book values (see box). Our approach thus investigates the cross-sectional and time series relationship between bank PBRs and a variety of indicators measuring the intensity of different banking activities, based on accounting metrics derived from bank balance sheet and income statement information.
This approach yields our baseline regression, which is estimated for a sample of 72 banks from 14 jurisdictions using annual data over the 2000-16 period (the stock exchange-listed banks from the Brei and Gambacorta (2014) database). Formally, it is set up as follows:

There are four sets of explanatory variables, which can affect PBRs through both economic and signalling effects:4 (i) loans (LOANS) and related indicators of asset quality, such as non-performing loans (denoted NPL) and provisions (PLL); (ii) core (COREDEPO) and non-interest-bearing deposits (NONINTDEPO); (iii) profit-and-loss variables, namely non-interest expenses (NONINTEXP), recurring non-interest income (RNONINTINC), transitory non-interest rate income (TNONINTINC) and return-on-equity (ROE); (iv) other metrics capturing bank characteristics, such as balance sheet leverage (tangible book equity over tangible total assets; TEQT), asset size (ASSETS), dividends paid (DIVIDEND) and the difference between interest-earning assets and interest-bearing liabilities (INTGAP; a measure of interest rate risk). All variables are expressed as ratios to book equity, except for ASSETS (which are in logarithms of US dollar amounts) and leverage (as defined above). We cluster the standard errors across both banks and time. (See the discussion below for more detail on the various variables.) When extending the analysis, we add macroeconomic and macro-financial data to capture drivers such as the business cycle (via the output gap) and the financial cycle (via the credit-to-GDP gap).
A key extension of our approach relative to earlier work, such as Calomiris and Nissim (2014), is the multi-country setup; most previous research has focused on US banks. This requires that we restrict ourselves to explanatory variables that are consistently available for a broad international sample of banks. In addition, given our focus on the time series variation in bank valuations, we deviate from Calomiris and Nissim (2014) by not including time fixed effects in our baseline specification, and by adding (current) ROE as a proxy for investors' return expectations.
Given our multi-country approach, legal and accounting differences can affect some of the standard accounting metrics used in our empirical approach. The definition of NPLs, in particular, is known to differ substantially across jurisdictions, including among euro area economies (where more standardised definitions were phased in only during the later stages of our sample period; see EBA (2016)). In addition, differences in workout procedures imply that even identically defined NPLs can have a different meaning economically (eg Fitch Ratings (2016)). We account for these effects by allowing for country-level variation in NPL coefficients.
Main results
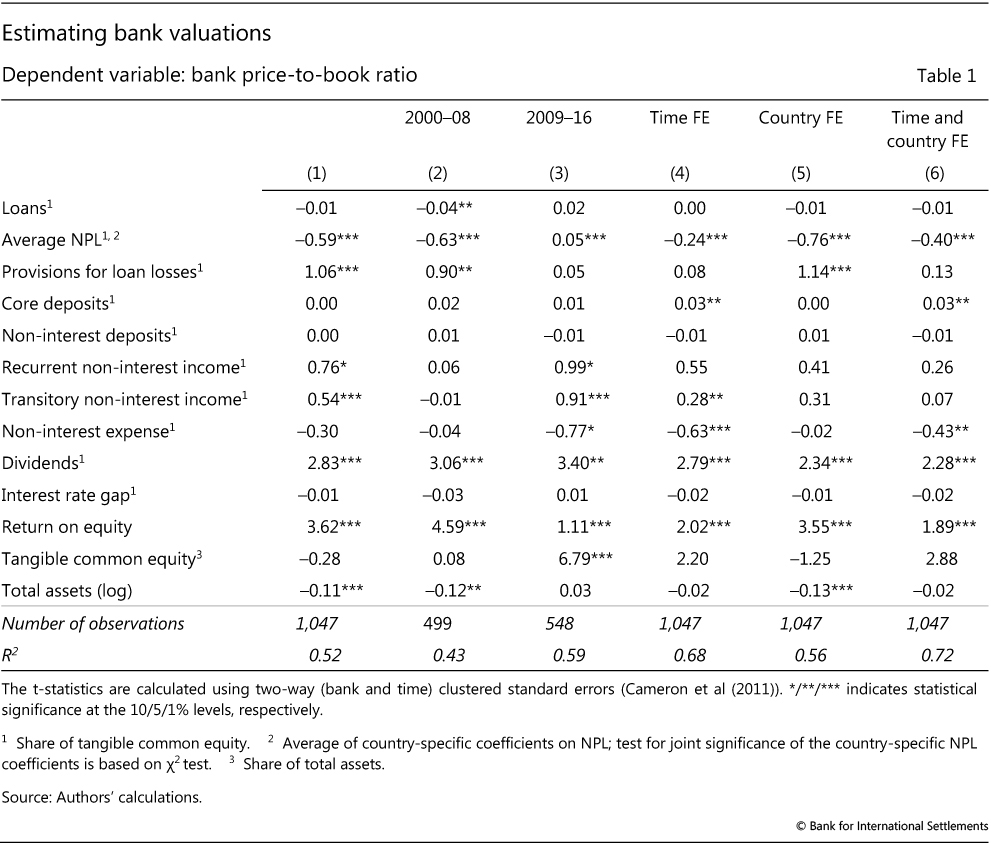
The estimated coefficients from our baseline VE are mostly statistically significant and have the economically expected sign (Table 1, Model 1). Specifically, NPLs generally depress bank PBRs, indicating that investors penalise banks for asset quality problems, more than the book value of NPLs - which is covered also by our LOANS metric - would suggest. Provisioning levels (relative to book equity) show up positively once NPLs are controlled for, highlighting that investors seem to value attempts by banks to address asset quality issues in a proactive fashion. While income measures generally enhance value, higher non-interest rate expenses depress it, underlining the value of cost reductions, or their signals, for market valuations. In line with basic discounted cash flow logic, ROE and dividend ratios both increase PBRs, even after controlling for net non-interest income. Lower leverage (ie higher tangible common equity) and larger balance sheets, in turn, appear to reduce valuations, though the leverage effect is not statistically significant. The effects of size and leverage are discussed in more detail in the robustness section below.
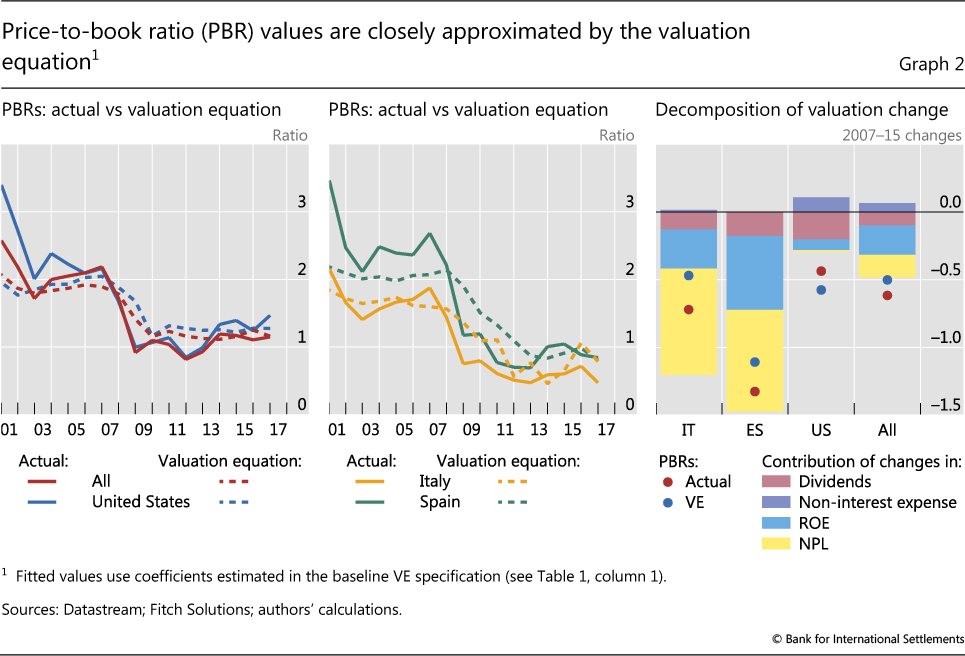
Overall, fitted values for bank PBRs from our baseline specification appear to match the actual values reasonably well across the entire sample. The R2 is 0.52, a rather high value for an international panel setting. Both the crisis decline and muted post-crisis recovery in PBRs are present in the fitted estimates (Graph 2, left-hand and centre panels). This is true not only for the whole sample or the relatively large US subsample (red and blues lines, respectively, in left-hand panel), but also - though to a smaller extent - for headquarter jurisdictions hit by the euro area sovereign debt crisis, such as Italy or Spain (centre panel, yellow and green lines).
Despite the relatively large number of explanatory variables in our baseline specification, around three quarters of the VE-implied change in bank PBRs between 2007 and 2015 is explained by only four drivers. NPLs and ROE are the most important ones, while dividends and non-interest expenses also play a role (Graph 2, right-hand panel). This comes on top of the ROE effect, likely reflecting the signalling value of dividend payments and cost reductions for bank investors. VE-implied valuations (blue dots), in turn, align reasonably well with the observed change in PBRs across the various subsamples over the observation period (red dots).
Extensions and robustness across time
One key question is the stability of our results across time, particularly around the GFC: did the GFC change how the market values banks? To answer this question and assess the robustness of our findings, we proceed in three steps.5
First, we run our VE on pre- and post-crisis subsamples to test for meaningful changes in the effect of the various explanatory variables (Table 1, Models 2 and 3). While most coefficient estimates remain broadly unchanged in terms of significance and directionality, there are two important exceptions.6 One concerns the effect of tangible common equity, ie balance sheet leverage, which shifts from insignificant in the pre-crisis period to significantly positive afterwards. That is, post-GFC, higher capitalisation levels relative to total assets (lower leverage) are associated with higher PBR values, with ROE-related leverage effects already controlled for. This suggests changing investor attitudes about leverage-implied risks. Investors appear to have shifted from viewing leverage as a mechanism primarily for increasing ROE, thereby boosting valuations, to a greater focus on ways in which excessive leverage can threaten solvency and thereby longer-term profitability. This conforms to other research findings that point to changes in investor attitudes towards leverage in the aftermath of the crisis (eg Aiyar et al (2014), Calomiris and Nissim (2014)).
The other major change across the two subsamples concerns the impact of bank size, ie the sign of the coefficient on total assets. While larger banks were generally valued less, on average, than smaller banks before the crisis, this size effect became statistically insignificant afterwards. Furthermore, even the pre-crisis size estimates, while being statistically significant, suggest only limited economic significance.7
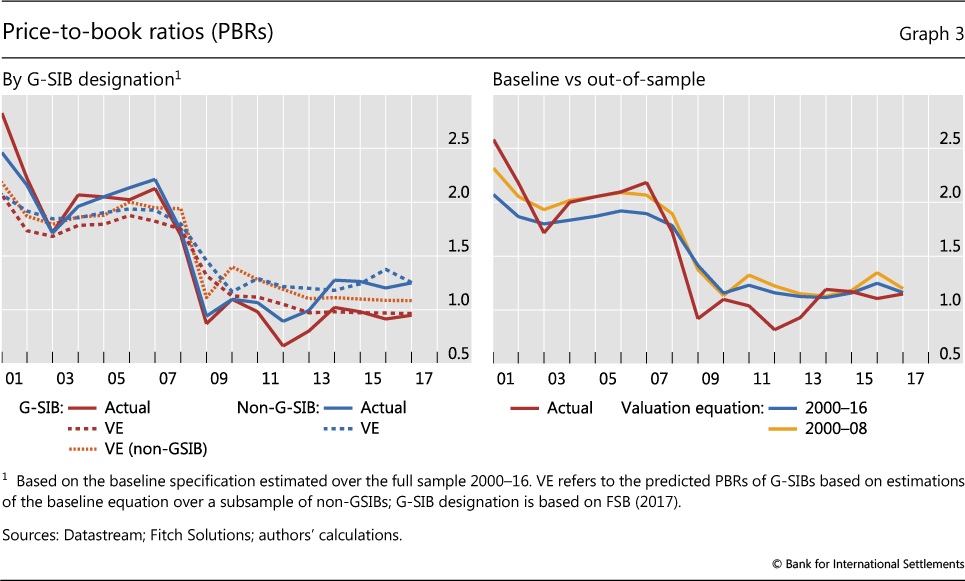
Importantly, the bank size results do not seem to be associated with the designation of global systemically important banks (G-SIBs). G-SIBs were valued at broadly similar levels, on average, to non-GSIBs pre-crisis; and several points lower post-crisis (Graph 3, left-hand panel, red and blue lines, respectively). Yet, both pre- and post-crisis, observed valuations (solid lines) are fairly closely matched by our full-sample VE estimates (dotted lines). In addition, the basic valuation drivers of G-SIBs and non-G-SIBs do not seem to materially differ. To see this, we approximate the valuation of G-SIBs based on the coefficients from the non-G-SIB subsample (orange dotted line): the resulting values are rather close to those based on the G-SIB sample (red dotted line) and also close to actual G-SIB PBRs (red solid line). This suggests that, in our sample of large banks,8 investors' approach to G-SIB valuation does not seem to systematically differ from that for other banks, even after controlling for various other bank characteristics.
Second, in order to understand the economic significance of these pre-/post-GFC changes, we use the pre-crisis coefficient estimates (Model 2) to conduct an out-of-sample estimation (Graph 3, right-hand panel). The results point to a remarkable similarity between the out-of-sample (yellow line) and full-sample (red line) valuation estimates. Both, in turn, are very close also to observed bank PBRs in most years (red line). Hence, while the difference between pre- and post-crisis coefficient estimates might be statistically significant in some instances, as highlighted above, we conclude that these differences do not materially affect the VE's overall fit.
Third, we apply time fixed effects to confirm the significance and directionality of our estimated baseline coefficients (Table 1, Model 4). We find that most coefficient estimates remain stable and that valuations are not unduly driven by the effects of outlier years, such as during the GFC. Time fixed effects should also capture any developments that would tend to affect banks similarly at the same time, such as the impact of global macro-financial conditions. Similarly, our main results also remain robust to allowing for country-specific variation in bank valuation. Specifically, they are broadly unchanged when adding country fixed effects (Model 5), even in combination with time fixed effects (Model 6).9
Conclusion
PBRs are well explained by traditional valuation factors, especially the return on equity, NPLs, and factors linked to the intangible components of a bank's activities. Our baseline estimates, which use these factors to estimate PBRs for 72 banks from 14 jurisdictions, capture both the crisis-induced decline and muted post-crisis recovery in PBRs as well as jurisdictional differences, such as those between US and euro area banks in the context of the sovereign debt crisis. As such, they provide a useful benchmark for bank PBRs across countries and time.
Our findings offer at least three closely related policy implications. First, there does not seem to be a major break in the factors driving bank valuations after the GFC. Indeed, even though current PBRs are compressed relative to their pre-crisis levels, they are not generally out of line with our model estimates based on the full pre- and post-crisis sample: neither for the aggregate, nor at the country level. By way of analogy: effectively, bank analysts seem to be using their pre-crisis "valuation spreadsheets" also after the GFC. Hence, one should be careful not to overemphasise the effect of the crisis and of crisis-related policies for how banks are valued in the post-crisis environment.
Second, these findings also suggest that traditional tools, such as the proactive management of NPLs and tight control of non-interest expenses, remain useful in enhancing bank valuations also in the post-crisis period. The crucial role of NPLs, in particular, underscores the value of various policy measures recently taken in Europe, where observed levels of NPLs have remained stubbornly high in some jurisdictions (EBA (2016), Carpinelli et al (2016)). This includes efforts to tighten banks' provisioning policies (such as via asset quality reviews and stress tests) as well as measures tackling legal impediments to the timely workout of NPLs, which are now being actively pursued in countries such as Italy. Our results also align with earlier evidence showing that the proactive tackling of NPLs (including via the use of public sector funds) can be an effective catalyst of banking sector recovery in post-crisis environments (Borio et al (2010)).
Third, given the presence of key valuation drivers - such as NPLs - that are unrelated to regulatory reform, our findings cast some doubt on explanations that assign a large role to regulation as a source of low current bank valuations. While there are tentative signs of changing post-crisis valuations for G-SIBs relative to their non-G-SIB peers, our baseline VE serves as a valid bank valuation benchmark during both the pre- and post-crisis periods, and for G-SIBs as well as non-G-SIBs. Out-of-sample forecasts based on pre-crisis estimates produce valuations that are very close to observed values. Thus, while regulation is among the various possible drivers of bank value, it is not needed to explain post-crisis PBRs.
These results would support the view that bank managements should take advantage of the current favourable macroeconomic environment to use the traditional tools at their disposal to complete balance sheet repair and return their institutions to sustained profitability.
References
Aiyar, S, C Calomiris and T Wieladek (2014): "Does macro-prudential regulation leak? Evidence from a UK experiment", Journal of Money, Credit and Banking, vol 46, pp 181-214.
Bank for International Settlements (2016): 86th Annual Report, Chapter VI, June.
--- (2017): 87th Annual Report, Chapter V, June.
Basel Committee on Banking Supervision (2017a): High-level summary of Basel III reforms, December.
--- (2017b): Basel III monitoring report, September.
Borio, C, B Vale and G von Peter (2010): "Resolving the financial crisis: are we heeding the lessons from the Nordics?", BIS Working Papers, no 311, June.
Brei, M and L Gambacorta (2014): "The leverage ratio over the cycle", BIS Working Papers 471, November; subsequently published as "Are bank capital ratios procyclical? New evidence and perspectives", Economic Policy, vol 31, no 86, pp 357-453, 2016.
Calomiris, C and D Nissim (2014): "Crisis-related shifts in the market valuation of banking activities", Journal of Financial Intermediation, vol 23, pp 400-35.
Cameron, A, J Gelbach and D Miller (2011): "Robust inference with multiway clustering", Journal of Business and Economic Statistics, vol 29, no 2, pp 238-49.
Carpinelli, L, G Cascarino, S Giacomelli and V Vacca (2016): "The management of non-performing loans: a survey among the main Italian banks", Bank of Italy, Occasional Papers, no 311, February.
Chousakos, K and G Gorton (2017): "Bank health post-crisis", Bank of France, Financial Stability Review, no 21, April.
Chung, K and S Pruitt (1994): "A simple approximation of Tobin's q", Financial Management, vol 23, no 3, pp 70-4.
Cohen, B and G Edwards (2017): "The new era of expected credit loss provisioning", BIS Quarterly Review, March, pp 39-56.
Committee on the Global Financial System (2018): "Structural changes in banking after the crisis", CGFS Papers, no 60, January.
Damodaran, A (2009): "Valuing financial service firms", April, mimeo.
Demsetz, R, M Saidenberg and P Strahan (1996): "Banks with something to lose: the disciplinary role of franchise value", Federal Reserve Bank of New York, Economic Policy Review, October, pp 1-14.
Diamond, D (1984): "Financial intermediation and delegated monitoring", Review of Economic Studies, vol 51, no 3, pp 393-414.
European Banking Authority (2016): "EBA report on the dynamics and drivers of non-performing exposures in the EU banking sector", July.
Financial Stability Board (2017): "List of global systemically important banks (G-SIBs)", 21 November.
Fitch Ratings (2016): "Italian NPL scheme: investor interest could be suppressed by long recovery times and the scheme's complexity", 10 March.
Gordon, M (1962): The investment, financing, and valuation of the corporation, Homewood, IL: R D Irwin.
Gorton, G and G Pennacchi (1990): "Financial intermediaries and liquidity creation", Journal of Finance, vol 45, no 1, pp 49-71.
Hoenig, T (2017): "Statement of FDIC Vice Chairman Hoenig on the semi-annual update of the Global Capital Index", September.
Huizinga, H and L Laeven (2012): "Bank valuation and accounting discretion during a financial crisis", Journal of Financial Economics, vol 106, pp 614-34.
Keeley, M (1990): "Deposit insurance, risk and market power in banking", American Economic Review, vol 80, no 5, pp 1183-1200.
Öztürk, E and X Sheng (2017): "Measuring global and country-specific uncertainty", IMF Working Papers, no 17/219, October.
Tobin, J and W Brainard (1976): "Asset markets and the cost of capital", Cowles Foundation Discussion Papers, no 427, New Haven.
Appendix
Data sources
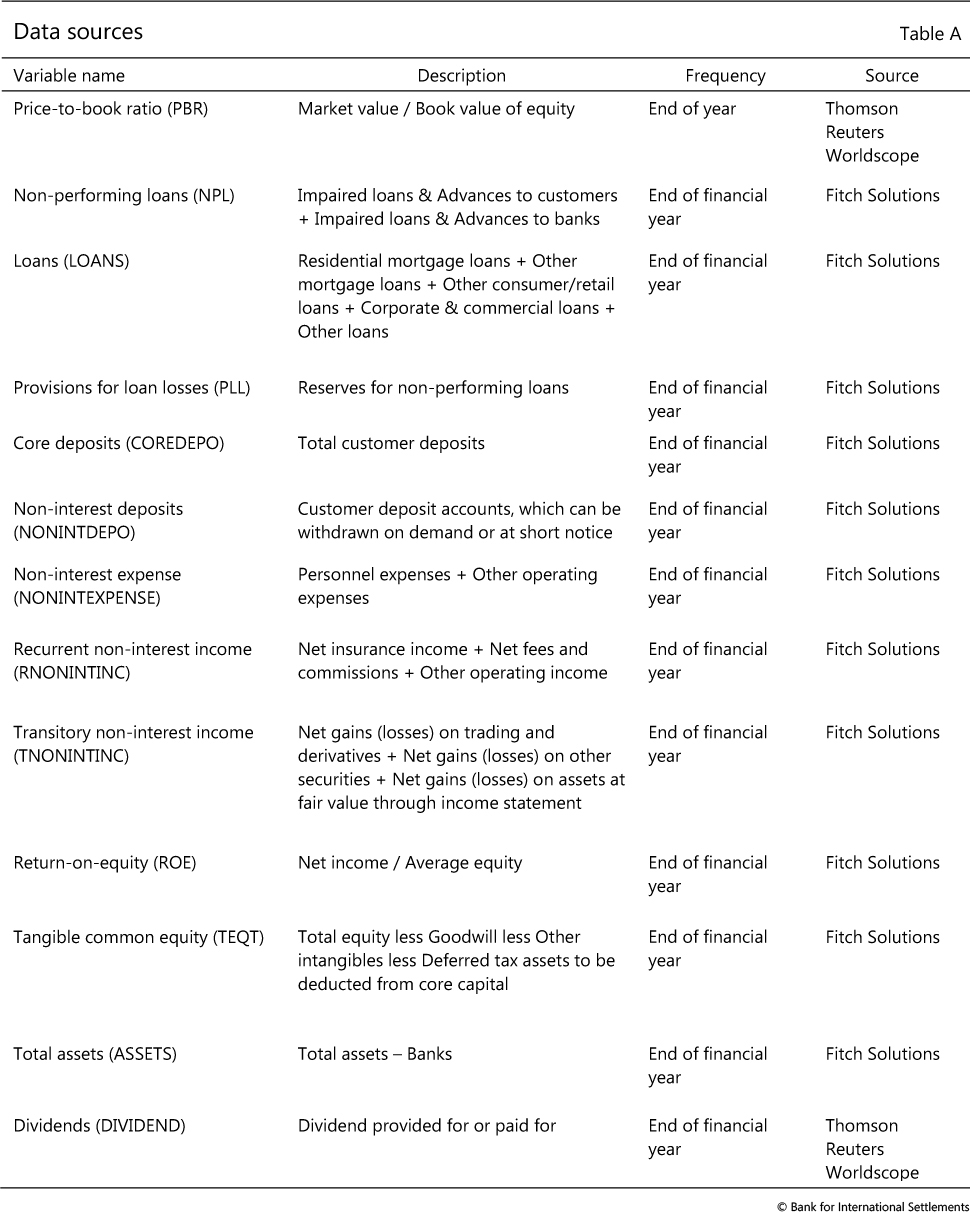
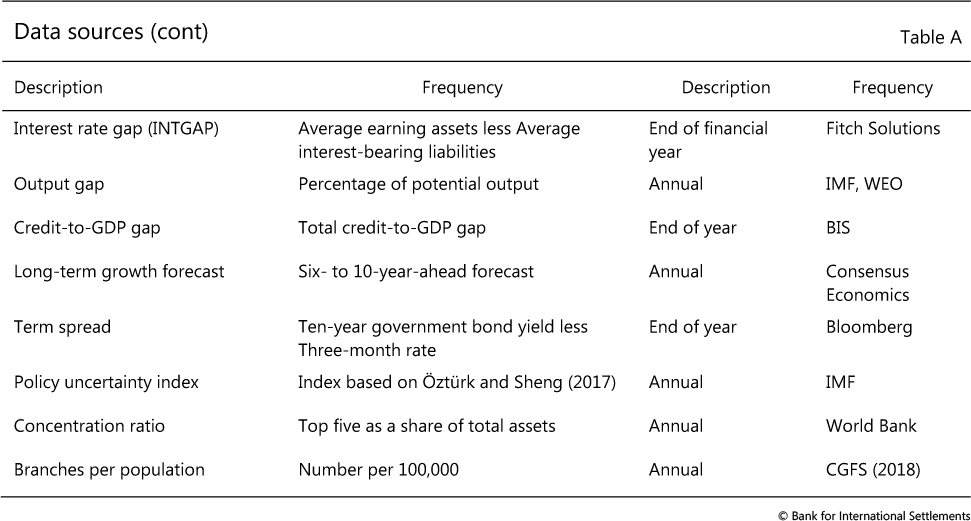
Our empirical analysis relies on annual financial data (bank equity prices) as well as bank balance sheet and income statement items. As part of our robustness checks, we then extend the analysis by adding macroeconomic and macro-financial data, such as measures of output and credit-to-GDP gaps (Table A).
Additional controls
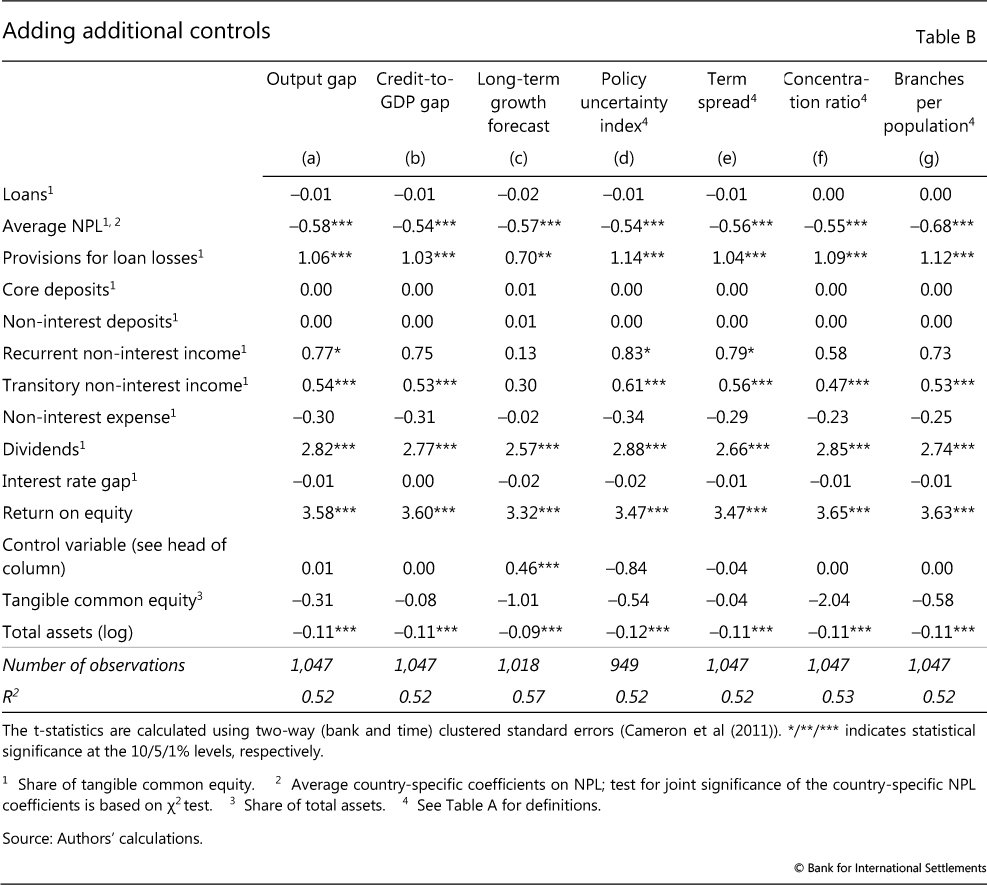
To ensure that our results are not materially affected by omitted variable bias, we consider a variety of potential additional explanatory variables.
We start by extending our baseline equation with a set of macroeconomic controls. Based on our basic model setup, one would expect macroeconomic developments - both in banks' home market and internationally - to influence PBRs mainly indirectly (eg via explanatory variables such as NPLs or ROE), but not directly (ie not once these other factors are controlled for). And, indeed, neither the business cycle (Table B, Model a) nor the financial cycle (Model b) seems to directly affect bank valuations significantly.
We also estimate alternative specifications of our VE to investigate the impact of longer-term growth potential (Table B, Model c). The results suggest that banks headquartered in countries with the strongest economic growth prospects, as measured by longer-term consensus growth forecasts, are valued somewhat more highly, to a statistically significant degree, than banks from home jurisdictions judged as slower-growing. This likely reflects the impact of higher growth potential in the home market, combined with the presence of significant home bias in banks' activities.
Conversely, we do not find any significant impact of macroeconomic policy uncertainty on bank valuations that would not already be accounted for in the baseline VE (Table B, Model d). Similarly, measures of banks' intermediation margin (as proxied by the term spread, ie the difference between long- and short-term interest rates) and of banks' competitive environment (as proxied by the concentration ratio and by the number of branches per home country population) turn out to be insignificant, both statistically and economically, as drivers of bank valuation (Table B, Models e, f and g, respectively).
1 The views expressed in this article are those of the authors and do not necessarily reflect those of the BIS. We are grateful to Claudio Borio, Stijn Claessens, Benjamin Cohen, Gerald Edwards, Leonardo Gambacorta and Hyun Song Shin for comments and suggestions.
2 This is similar in spirit to Tobin's q, which is defined as market value over replacement cost (Tobin and Brainard (1976), Chung and Pruitt (1994)). For stable prices, both measures are essentially identical. Values above one thus incentivise firms to raise more capital in order to invest the proceeds.
3 This adds to a longer-term downward trend in bank PBRs that is well documented in the literature. See, for example, Keeley (1990) and Demsetz et al (1996), who highlight deregulation and competition as key drivers of bank franchise values.
4 Our main analysis relies on annual financial data (eg bank equity prices) and corresponding bank balance sheet and income statement items. Details can be found in Appendix Table A.
5 In addition, by adding a number of additional control variables, we examine the extent to which our results may be affected by omitted variable bias. See the Appendix for the results.
6 A third exception concerns the estimate of the average NPL coefficient, which switches to a positive sign in the post-crisis subsample. We find, however, that the average is driven by a single country-level outlier and that it turns negative once country fixed effects are added. In addition, most countries have negative NPL coefficients and all significant individual coefficients are negative.
7 For the pre-crisis estimate (Table 1, Model 2), the coefficient estimate of -0.12 on bank asset size implies that the valuation difference between a median-sized bank (assets of $276 billion) and a bank in the 75th percentile (assets of $580 billion, ie more than twice as large) is around 0.089 in PBR terms.
8 As almost all the banks in our sample are systemically important in their home jurisdictions, we should not interpret these results as describing effects related to systemic importance per se.
9 This should capture the effect of any country-specific differences in accounting standards that might otherwise affect the valuation impact of individual balance sheet items, ie when comparing US and non-US institutions (Hoenig (2017)).