Strong outlook with low inflation spurs risk-taking
Monetary policy came sharply back into focus in global financial markets. In late June, market participants interpreted speeches by the ECB President and the Bank of England Governor as possible signs of the beginning of a broader-based tightening in major advanced economies other than the United States. Long-run government bond yields jumped. However, they soon softened in response to weak inflation data and central bank statements that investors perceived as having a more dovish tone. Moreover, low realised inflation led markets to also anticipate an even more gradual path for US monetary policy tightening than at the beginning of June.
Propelled by reduced expectations of monetary tightening in the United States and positive macroeconomic news, global markets surged. US equity markets reached new historical highs in August, and emerging market economy (EME) equities steamed ahead. Corporate credit spreads were at, or close to, their narrowest levels since the beginning of 2008. Both realised and implied volatility in all major asset classes, and for bonds in particular, were subdued. The MOVE - a measure of implied volatility in the US Treasury market - reached new historical lows. In mid-August, volatilities spiked somewhat due to rising political risks in the United States and increased geopolitical tensions relating to North Korea. But even as political tensions remained high, they returned to low levels by the beginning of September.
The shifting outlook for the future paths of monetary policy and increased US policy uncertainty put strong downward pressure on the US dollar. As macro news was also better than expected globally while disappointing in the United States, the dollar depreciated vis-à-vis all major advanced economy and EME currencies. The dollar lost most ground against the euro, given the strengthening economic outlook in the euro area and monetary policy signals.
Low measures of volatility and a depreciating dollar supported a "risk-on" phase. It whetted investors' appetite for EME assets as carry trades delivered large returns. Equity market investors used record amounts of margin debt to lever up their investments, even though price/earnings ratios indicated that equity valuations might be stretched by historical standards. And there were some signs of search for yield in debt markets: issuance volumes in leveraged loan and high-yield bond markets rose while covenant standards eased.
A brighter outlook and subdued inflation drive markets up
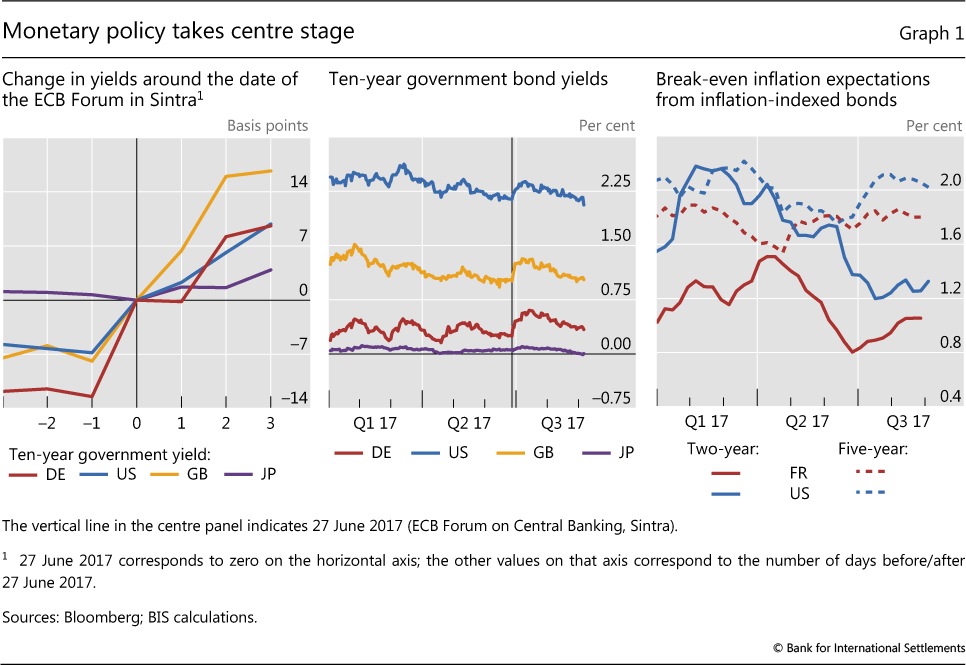
Monetary policy took centre stage at the end of June. Market participants interpreted a speech by the President of the ECB on 27 June as providing a signal of a forthcoming tapering of quantitative easing in the euro area. Within three days, German 10-year government bond yields increased by more than 20 basis points (Graph 1, left-hand and centre panels). On 28 June, the Governor of the Bank of England hinted at possible rate increases, driving UK 10-year yields 25 basis points higher.
Long-term yields rose globally in anticipation of an end to the exceptionally easy monetary policy in major advanced economies other than the United States. The prospects of a simultaneous tightening jolted markets.
The rise of global yields came to a halt as investors took cues from further central bank announcements and higher inflation did not materialise. Subdued wage pressures, despite tightening labour markets, contributed to low headline inflation in the United States and the euro area of 1.7% and 1.3%, respectively, in July. Low inflation fed into low inflation expectations (Graph 1, right-hand panel), which were further depressed in the United States by fading prospects for a large fiscal stimulus. In Japan, inflation remained close to zero, and inflation expectations changed little after 20 July when the Bank of Japan delayed the timeline for reaching its inflation target.
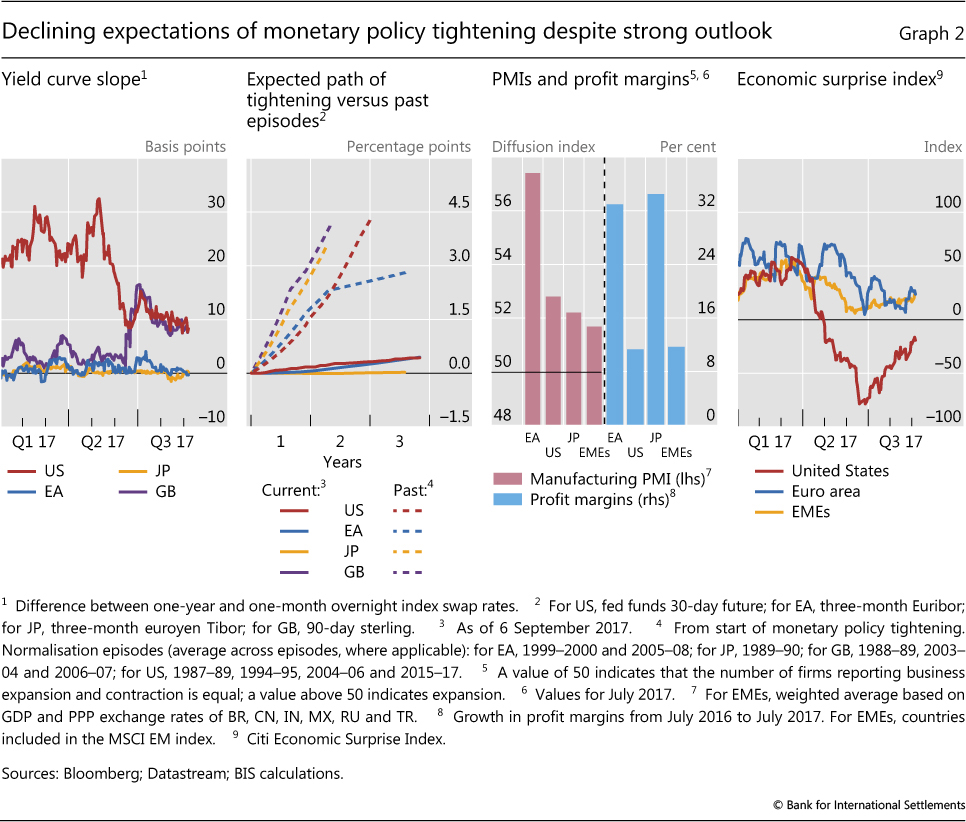
Against this backdrop, market participants expected a more gradual tightening, in particular in the United States. Despite a small uptick after the ECB President's speech, rate hike expectations in the euro area and Japan remained minimal (Graph 2, first panel). In June, market prices had already been implying a much more gradual pace of tightening than in previous episodes in the United States and the United Kingdom (Graph 2, second panel). While events in late June pushed up rate hike expectations somewhat, the "missing inflation" flattened yield curves again. Accordingly, the market-implied probability of at least one rate rise within one year fell from 60% in early July to around 30% in early September in the United States. Long-term bond yields fell steadily, with the US yield reaching levels last seen in November 2016.
Despite subdued inflation in advanced economies, the global macro outlook was upbeat. Market commentators label such an environment the Goldilocks scenario - where the economy is "not too hot, not too cold, but just right".
The purchasing managers' index (PMI), a leading indicator of economic activity, signalled continued economic expansion in advanced economies (Graph 2, third panel). In Japan, profit margins rose rapidly. The economy grew in the second quarter at an annualised rate of 4% - the fastest pace in more than two years, beating expectations by a wide margin.
The economic outlook for the euro area was particularly positive. As the area recorded its lowest unemployment rate in nine years, the manufacturing PMI rose to its highest level since 2011. Euro zone economic confidence breached even pre-crisis levels. The profit margins of European companies also grew strongly (Graph 2, third panel), even though their overall profitability remained below that of their US or EME counterparts. The positive outlook was further underpinned by progress in cleaning up bank balance sheets (Box A) and by reduced policy uncertainty following the presidential and parliamentary elections in France.
Box A
How did markets react to bank distress in Europe?
Four banks in Italy and Spain failed or were recapitalised in June and July. This box takes a closer look at those events and the spillovers to market conditions for banks in Europe.
Investors did not fully anticipate the failure of the Spanish bank, Banco Popular Español. On 7 June, it was the first bank to be put into resolution under the Bank Recovery and Resolution Directive of the European Union. It was acquired by Spain's Banco Santander (for a symbolic sum) the following day. Equity and subordinated debt prices had weakened in the run-up to the event. Yet subordinated Additional Tier 1 (AT1) debt was still trading at 70 cents to par at the end of May, a few days before the start of the resolution process that was to wipe the bank out (Graph A, first panel). Prices for unsecured debt, on the other hand, decreased relatively little and actually increased after 7 June (Graph A, second panel).
For the Italian banks, by contrast, problems had been unfolding for several months and markets had already priced in a significant debt writedown ahead of the announcements of official intervention. On 23 June, European authorities decided that Banca Popolare di Vicenza (BPVI) and Veneto Banca would be wound up under normal Italian insolvency proceedings, coupled with state aid to facilitate market exit. Equity and subordinated debt, which had already been trading at depressed levels since late 2016, were written down to zero, while senior bondholders and depositors were spared (Graph A, first two panels). Discussions on how to deal with Banca Monte dei Paschi di Siena (BMPS) had been under way since the end of December 2016, when the bank had failed to raise private capital and equity trading had been suspended. By June, subordinated debt holders had already anticipated much of the losses they would face and the prices of the securities they held rose after the European Commission approved the precautionary recapitalisation on 4 July (Graph A, first panel). Prices of senior debt instruments also rose from the beginning of June, when it became clear that they would not be written down (Graph A, second panel).
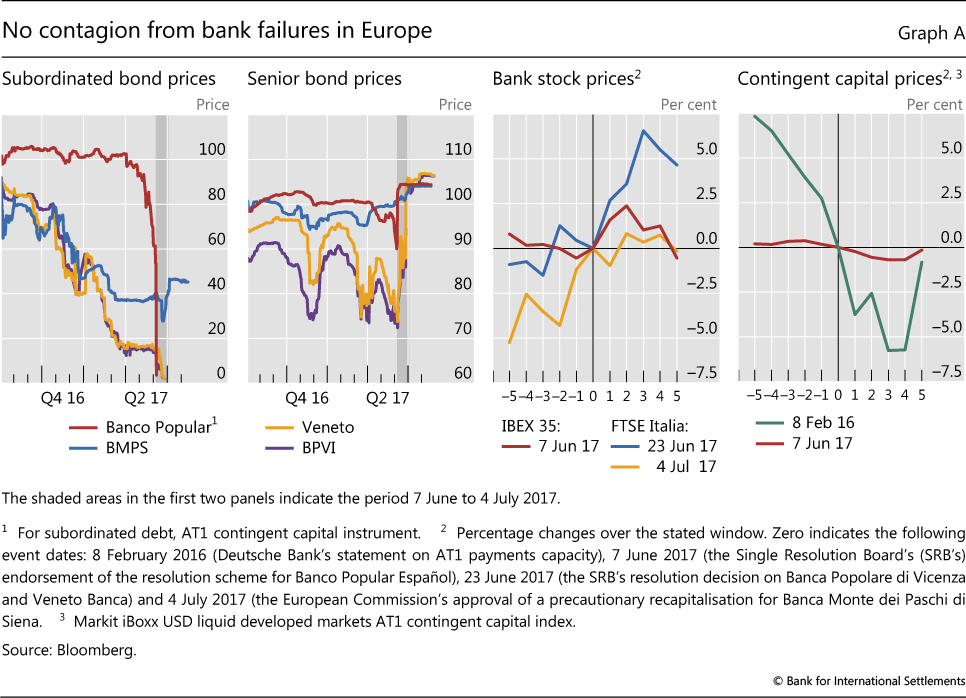
Following these events, the reduced uncertainty seemed to support the outlook for other banks in Europe (Graph A, third panel). Spanish banks' equity prices rose somewhat in the few days after the announcement of Banco Popular's takeover by Banco Santander. While the authorisation of the precautionary recapitalisation of BMPS on 4 July had a muted impact as it was aligned with market expectations, Italian bank shares rose substantially after the liquidation of Veneto Banca and BPVI. Overall, the FTSE Italia All Share Banks index climbed by 10% from the beginning of June to the end of July, outperforming the STOXX Europe 600 Banks index, which returned nearly 5%.
Despite the first ever conversion of AT1 instruments, there was also no evidence of contagion in the market for contingent convertible instruments after the failure of Banco Popular (Graph A, fourth panel). The developed markets AT1 CoCo index reacted little compared with early 2016, when Deutsche Bank had sparked market anxiety because of the potential for a suspension of coupon payments. After edging down in the week of Banco Popular's failure, the index went up by 2% from the beginning of June to the end of July. Moreover, European banks continued to issue contingent capital instruments, with around €15 billion successfully sold from April to August 2017.
While losses were covered by bonds being written down in all three cases, retail junior debtholders can apply for compensation under certain eligibility criteria.
US macroeconomic data were strong, but the US economy underperformed relative to market expectations. In July, the US unemployment rate fell to levels last seen in 2001. At the same time, the Citi Economic Surprise Index reached its lowest point since 2011, indicating that economic data poorly matched market expectations (Graph 2, fourth panel). That said, rising and better than expected profit margins supported equity markets.
Investors were also positively surprised by the macro news coming from EMEs. Corporate profit margins rose. And while the outlook was not as optimistic as for advanced economies, PMIs indicated a macroeconomic expansion for major EMEs. Growth in China held up unexpectedly well, at around 7% in the second quarter, giving a major boost to market confidence.
Market participants' concerns about financial stability risks in China also retreated. At the beginning of the year, strong capital outflows and rapidly shrinking FX reserves had prompted market jitters against the backdrop of persistent aggregate credit growth and high credit-to-GDP ratios.1 Since then, credit growth has slowed even though house prices continue to rise, partly driven by property developers (Box B). China's net capital inflows have turned positive, and its foreign exchange reserves have stabilised.2
Box B
Property markets and real estate companies
The beginning of normalisation of monetary policy in the United States and the tightening of macroprudential measures in a number of emerging Asian countries seem to have helped slow credit growth in these economies over the past year. However, property prices have remained firm. In some jurisdictions, such as China and Hong Kong SAR, house prices have risen further, and this has coincided with a pickup in property developers' borrowing through bank loans and debt securities. This box discusses how property developers have contributed to rising property prices and to what extent their fast-growing activities could become a cause for concern for the authorities.
One channel through which property developers have propped up housing demand is the offering of financing schemes to potential buyers. For example, although between 2009 and 2015 the Hong Kong Monetary Authority (HKMA) introduced seven rounds of macroprudential measures to tighten mortgages, over the past two years property developers have increasingly offered attractive financing schemes to prospective buyers in an effort to boost sales. Often, the offers have not involved an assessment of borrowers' repayment ability. There is little information on how exactly these financing schemes are funded. But lending to finance property development has become the dominant contributor to the pickup in total property lending growth during this period (Graph B, left-hand panel). To protect banking sector stability, in June 2017 the HKMA tightened the limits on the maximum amounts that banks can lend with respect to the cost and site value of construction projects; from August, it also phased in higher risk weights for credit exposures to property developers.
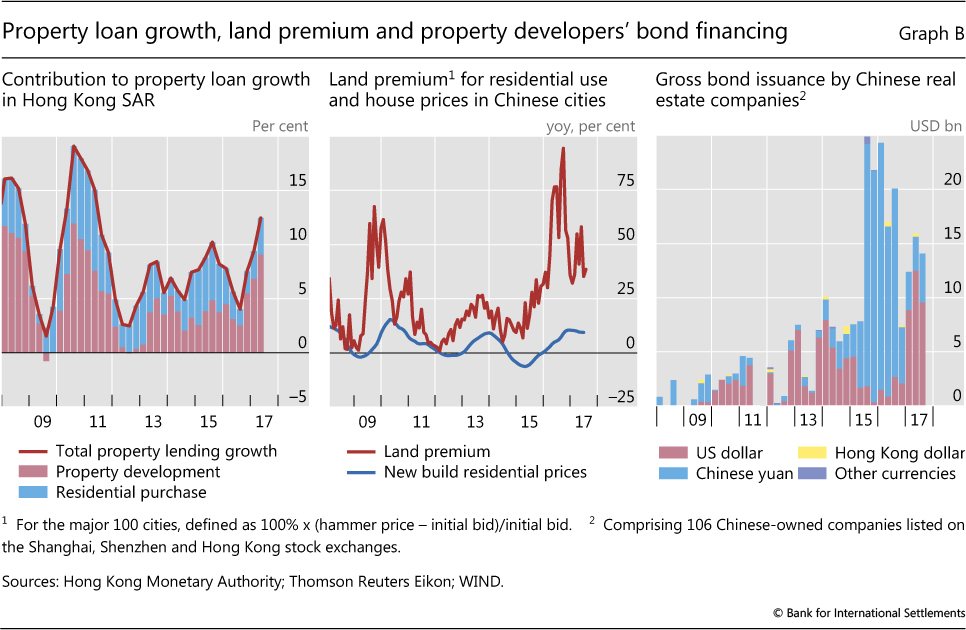
Lending to prospective buyers and fierce competition among developers have pushed up land prices. With demand for housing remaining strong, companies can afford to bid aggressively for land, as the higher cost can be passed on to home buyers. The land premium (the difference between the hammer price and initial bid) paid by property developers for plots in major Chinese cities has been quite high since mid-2015. In the past, this premium has tended to be a leading indicator of residential price inflation (Graph B, centre panel).
Overseas expansion of property developers could add an international dimension to the phenomenon. For example, Singapore reported that property developers (mostly foreign-owned) bid aggressively at land auctions in the first half of 2017. Companies paid on average 29% more for residential plots than for comparable sites sold in the past five years. Partly in response to these aggressive bids, the Monetary Authority of Singapore issued a warning that "the risk of a renewed unsustainable surge in property prices is not trivial".
Aggressive bids by developers that do not ultimately meet strong demand could pave the way for a sharp market adjustment. The profit margins of developers could then be squeezed, and homeowners could suffer significant valuation losses. In this context, a Singapore minister warned local residents in 2015 about the risk of oversupply when investing in the large residential projects then under construction in neighbouring Malaysia. The developers (dominated by a few Chinese companies) planned to establish a total of 336,000 new residential units, slightly more than the entire stock of private homes in Singapore in 2015.
Naturally, foreign currency borrowing could leave those property developers lacking corresponding revenues vulnerable to currency mismatches, unless these risks were hedged. Market data reveal that, among the 106 Chinese-owned listed real estate firms, many of which have been active outside China, gross bond issuance has increased sharply since 2012, reaching a peak of around $25 billion per quarter in late 2015 and early 2016. Since then, their bond issuance has moderated somewhat (Graph B, right-hand panel). The share of US dollar-denominated debt, which was initially very high, dried up between 2015 and 2016 but increased again sharply in 2017. The State Council's guidelines, approved on 18 August of this year, which aim to curb Chinese companies' seemingly overambitious investments abroad in a range of sectors, including property, should be seen against this backdrop.
To some extent, this is reminiscent of the run-up to the Spanish and Irish banking crises, where lending to property developers played an important part. See Bank of Spain, "Exposición de las entidades de depósito españolas al sector inmobiliario", Informe de Estabilidad Financiera, March 2010; and K Whelan, "Ireland's economic crisis: the good, the bad and the ugly", Journal of Macroeconomics, vol 39, June 2013, pp 424-40. According to the HKMA definition, property lending consists of two main categories: (i) loans to finance property development and investment in properties (including uncompleted properties); and (ii) loans to individuals for the purchase of residential properties for own occupation or investment purposes. Remarks by R Menon, Managing Director, Monetary Authority of Singapore, at the MAS Annual Report 2016/17 Media Conference, Singapore, 29 June 2017. For example, in terms of market capitalisation, Chinese real estate firms account for around 50% of the sectoral total in the JPMorgan Chase Corporate Emerging Market Bond Index.
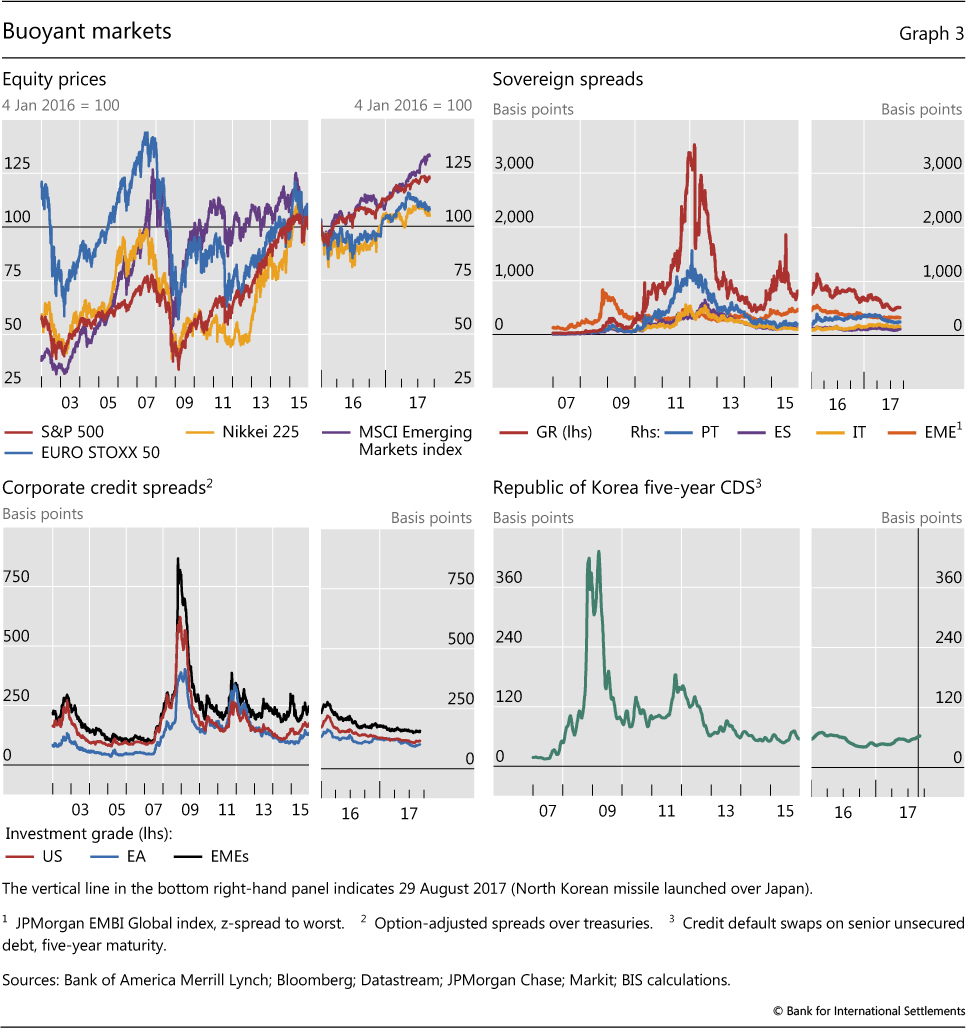
The strong global macro backdrop and reduced expectations of interest rate increases in the US boosted stock markets (Graph 3, top left-hand panel). US equity indices reached new peaks in early August, and EME equities steamed ahead. While European and Japanese stocks softened somewhat in recent months, they have still returned around 11% and 14%, respectively, since early September 2016.
Credit markets remained buoyant. Sovereign bond spreads continued to tighten slowly in the euro area. They remained broadly flat for EMEs, but below the previous five-year average (Graph 3, top right-hand panel). In June, Argentina took advantage of the favourable market conditions to issue a 100-year US dollar-denominated bond with a yield around 8%. And Greece returned to capital markets in July, selling a five-year bond denominated in euros with a 4.6% yield. Other infrequent or new issuers, such as Iraq and Belarus, also tapped bond markets, while Tajikistan prepared its benchmark offering of a 10-year dollar-denominated bond.
Corporate credit spreads were tight and falling. In mid-August, they stood at, or just a few basis points off, their lowest levels since the beginning of 2008. But they remained well above the levels prevailing before the Great Financial Crisis (Graph 3, bottom left-hand panel).
The overall positive market mood was disrupted by political events from mid-August onwards. However, while dominating headlines, politics did not weigh strongly on markets. Stock markets fell initially from their historical highs amid rising political risks in the United States and increased geopolitical tensions relating to North Korea. Yet the effects were short-lived. Even South Korean credit default swaps hardly budged and the Korean won scarcely moved against the dollar after North Korea fired a long-range missile over Japan and conducted its biggest ever nuclear test a few days later (Graph 3, bottom right-hand panel).
Shifting global outlook reverberates in FX markets
Shifting expectations about the future paths of monetary policy and the change in the relative macro outlook across major economic regions, along with political risks, put strong downward pressure on the US dollar. As the expected path of future Federal Reserve rate hikes shifted downwards and the US economy underperformed relative to market expectations, the dollar depreciated against all major advanced economy currencies (Graph 4, left-hand panel). Movements against the yen were muted given the minimal change in the Bank of Japan's policy outlook. Moreover, speculative positions, as reported by the Commodity Futures Trading Commission (CFTC), in US dollars vis-à-vis other currencies swung to net short at the beginning of Q3 (Graph 4, right-hand panel). This indicated expectations of a continued depreciation of the dollar.
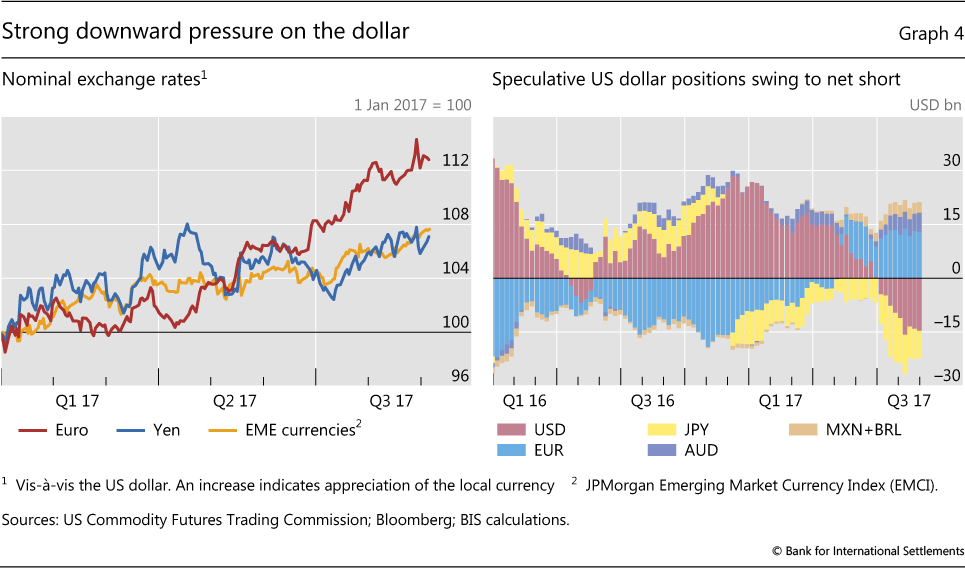
Dollar depreciation was most pronounced against the euro - around 7% since mid-June. The dollar lost most ground after the ECB President's remarks in June about reflationary forces being back in the euro area. The depreciation came to a halt in early August, partly due to concerns over the potential of a strong currency adversely affecting the euro area economy. But the dollar resumed its decline against the euro at the end of August.
The dollar also fell against most EME currencies. With the exception of central and eastern European currencies, which tend to follow the euro, exchange rate adjustments of the dollar vis-à-vis EME currencies were not particularly strong and volatility was low.
Is volatility exceptionally low?
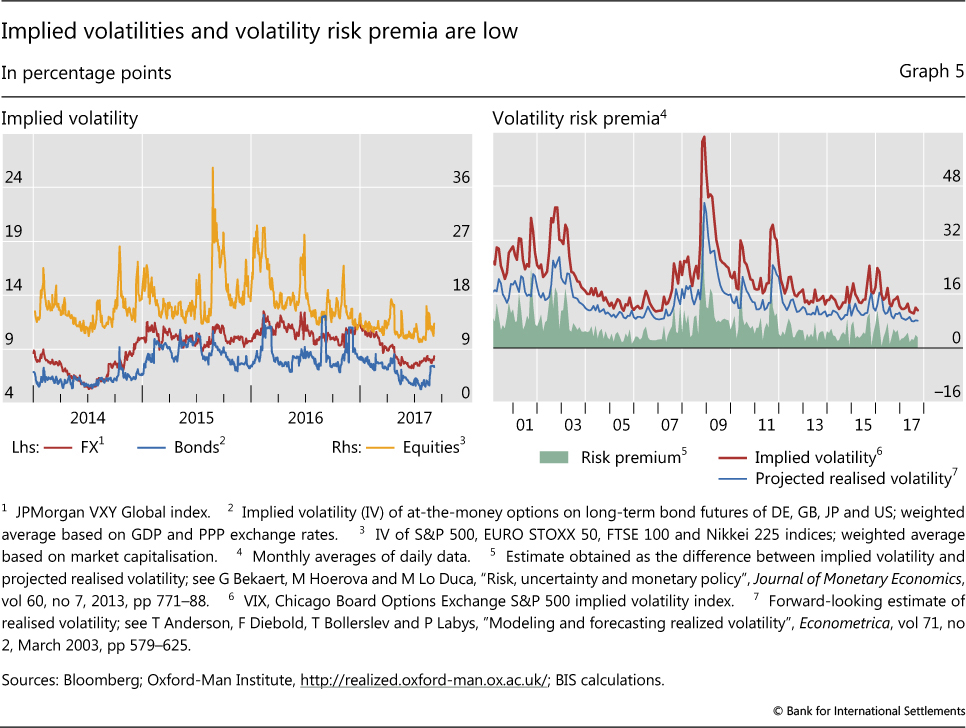
Buoyant markets and a falling dollar went hand in hand with subdued volatility in all major asset classes (Graph 5, left-hand panel). Bond market volatility across the globe was extremely low. The MOVE, a measure of implied US bond market volatility, fell to new historical troughs in August. At the same time, the VIX, which measures the implied volatility of US equity markets, reached levels close to the very low ones last seen in 2005. While volatilities remained low compared with historical benchmarks, they edged up somewhat and experienced a few spikes following political events in August.
Low expected volatility and a low volatility premium both seem to have contributed to the overall decline in the VIX. This is suggested by a decomposition of the VIX into the conditional variance of stock returns (the volatility that would be expected from actual stock return volatility in the recent past) and the equity variance premium (the extra amount investors are willing to pay to protect themselves from volatility) (Graph 5, right-hand panel).3 Both of these factors, along with the VIX itself, fell to their lowest points in several years, although they remained above their historically compressed pre-crisis levels.
Low stock market volatility has been typical of monetary tightening cycles since the early 1990s. During such episodes, both the VIX and 30-day realised stock market volatility have tended to stand between half and one standard deviation below their long-run averages (Graph 6, left-hand panel). This may have been due in part to the fact that volatility tends to be lower when equity markets rise, and tightening episodes tend to happen when such markets are rising. When set against this benchmark, the average VIX in the last 90 days prior to 5 September was not so unusual.
Recent bond market volatility, however, has been extremely low by historical standards, in line with extraordinarily low bond yields and gradual rate hike expectations. The MOVE index, for instance, has been unusually depressed in recent months, despite the increase in the federal funds target rate in June. This contrasts with previous tightening episodes, during which bond market-implied volatility was close to its long-term average (Graph 6, left-hand panel).
Large net short speculative positions on VIX futures signalled expectations that volatility would remain low. US CFTC net short positions on VIX futures - ie bets against rising volatility - reached record levels at the end of July (Graph 6, centre panel). In line with the somewhat higher VIX, they decreased in August but remained three times higher than the average for the last 10 years.
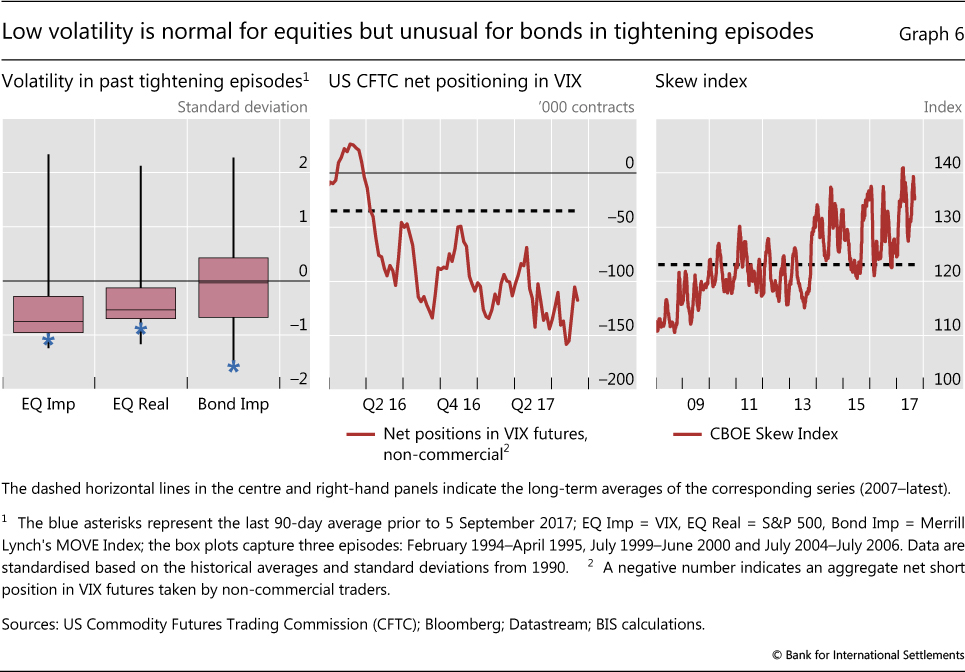
At the same time, markets priced in the risk of large asset price declines. The CBOE Skew Index - a measure of tail risk in the S&P 500 index - was high compared with its historical values (Graph 6, right-hand panel). This suggests that investors were pricing in a significant likelihood of large asset price drops.
A "risk-on" phase
As is typical for periods of low volatility and a falling dollar, a "risk-on" phase prevailed.
Against the backdrop of persistent interest rate differentials and a depreciating dollar, returns from carry trades rose sharply and EME equity and bond funds saw large inflows during the period under review (Graph 7, first panel). Speculative positions also pointed to patterns of broader carry trade activity: large net short positions in funding currencies, such as the yen and Swiss franc, and large net long positions in EME currencies and the Australian dollar (Graph 4, right-hand panel).
Equity market investors also employed record amounts of margin debt to lever up their investments. In fact, margin debt outstanding was substantially higher than during the dotcom boom and around 10% higher than its previous peak in 2015 (Graph 7, second panel).
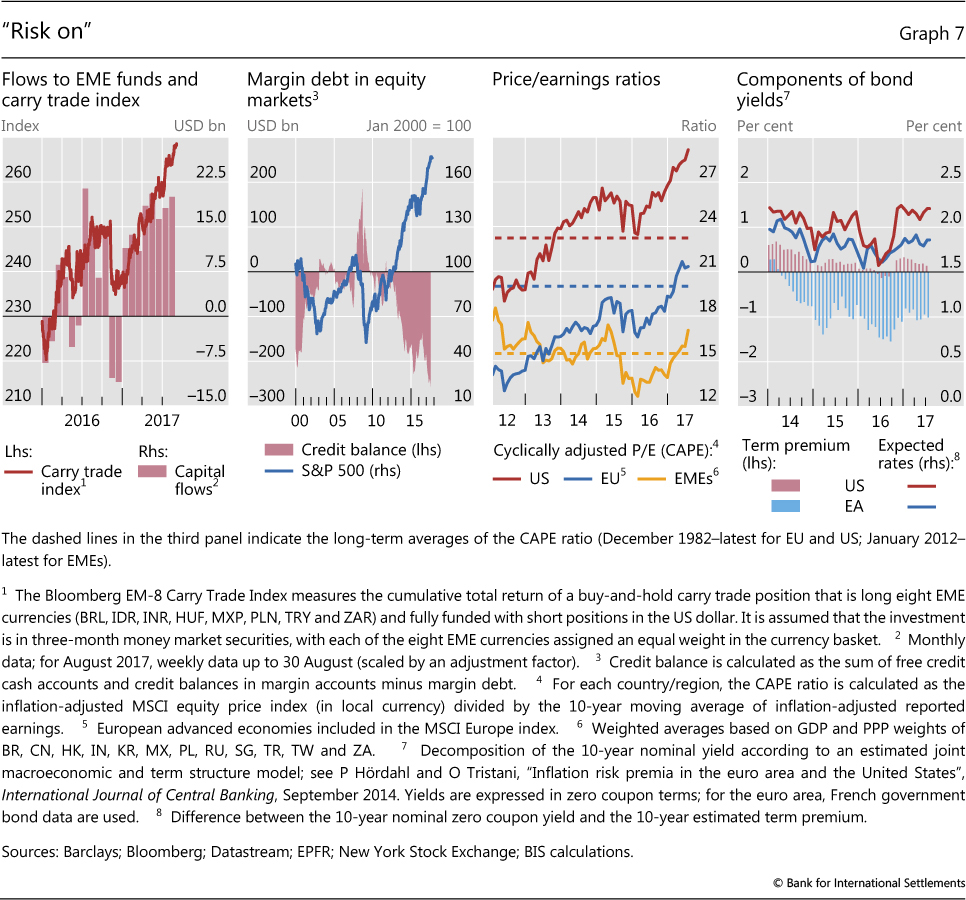
While margin debt levels breached new records, traditional valuation benchmarks, such as long-run average price/earnings (P/E) ratios, indicated that equity valuations might be stretched. Recent market moves pushed cyclically adjusted P/E ratios for the US market further above long-run averages. Cyclically adjusted P/E ratios also exceeded this benchmark for Europe and for EMEs, though by a smaller amount (Graph 7, third panel). That said, given the unusually low bond yields, valuations may not be out of line when viewed through the lens of dividend discount models. Indeed, estimates of bond yield term premia remained unusually compressed, well below historical averages in the United States and drifting further into negative territory in the euro area (Graph 7, fourth panel). This suggests that equity markets continue to be vulnerable to the risk of a snapback in bond markets, should term premia return to more normal levels.
There were also some signs of search for yield in debt markets, as issuance volumes of leveraged loans and high-yield bonds rose while covenant standards eased. The global volume of outstanding leveraged loans, as recorded by S&P Global Market Intelligence, reached new highs (above $1 trillion). At the same time, the share of issues with covenant-lite features increased to nearly 75% from 65% a year earlier (Graph 8, left-hand panel). Covenant-lite loans place few to no restrictions on the borrowers' actions and as such might signal a less discriminating attitude on the part of lenders while potentially fostering excessive risk-taking on the part of borrowers. According to Moody's, the covenant-lite share in the high-yield bond market also increased while covenant quality declined to the lowest levels since Moody's started to record these numbers in 2011.
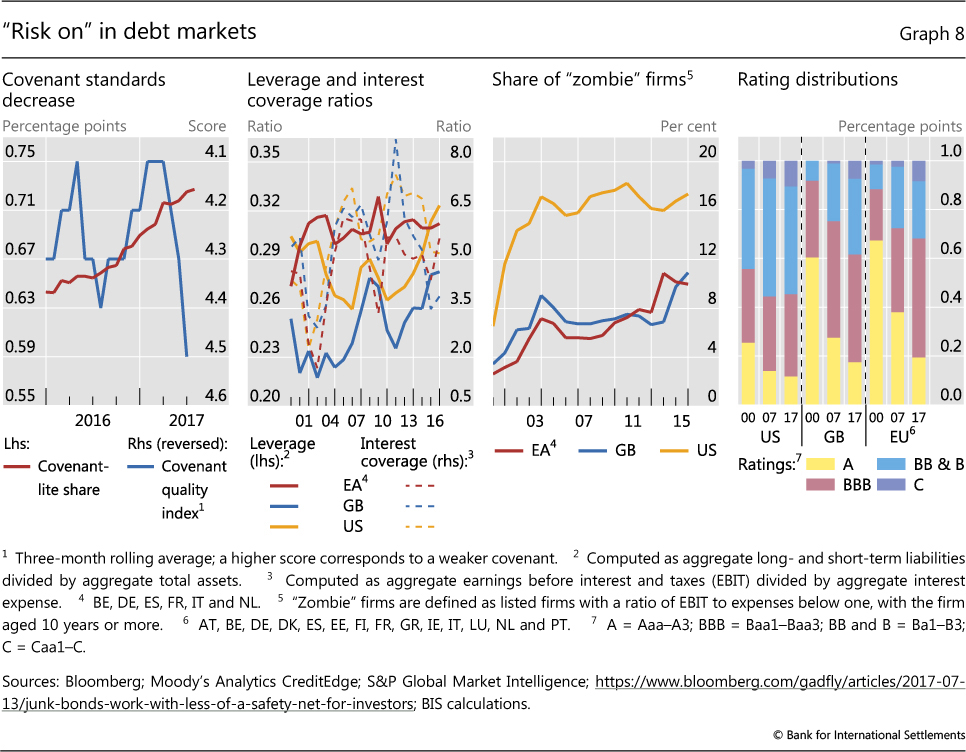
While corporate credit spreads were tightening, the health of corporate balance sheets deteriorated. Leverage of non-financial corporates in the United States, the United Kingdom and, to a lesser extent, Europe has increased continuously in the last few years (Graph 8, first panel). Even accounting for the large cash balances outstanding, leverage conditions in the United States are the highest since the beginning of the millennium and similar to those of the early 1990s, when corporate debt ratios reflected the legacy of the leveraged buyout boom of the late 1980s. And despite ultra-low interest rates, the interest coverage ratio has declined significantly. While the aggregate interest coverage ratio remained well above three, a growing share of firms face interest expenses exceeding earnings before interest and taxes - so-called "zombie" firms (Graph 8, third panel).4 The share of such firms has risen especially sharply in the euro area and the United Kingdom. At the same time, the distribution of ratings has worsened (Graph 8, fourth panel). The share of investment grade companies has decreased by 10 percentage points in the United States, 20 in the euro area and 30 in the United Kingdom from 2000 to 2017.5 The relative number of companies rated A or better has fallen especially sharply, while the share of worst-rated (C or lower) companies has increased. Taken together, this suggests that, in the event of a slowdown or an upward adjustment in interest rates, high debt service payments and default risk could pose challenges to corporates, and thereby create headwinds for GDP growth.
1 For a further discussion of credit developments and early warning indicators of financial crisis for China, see "Highlights of global financial flows" in this issue.
2 See the Statistical Release "BIS international banking statistics at end-March 2017", issued in July 2017.
3 See M Lombardi and A Schrimpf, "Volatility concepts and the risk premium", BIS Quarterly Review, September 2014, pp 10-11. For the methodology, see G Bekaert, M Hoerova and M Lo Duca, "Risk, uncertainty and monetary policy", Journal of Monetary Economics, vol 60, no 7, 2013, pp 771-88.
4 Given a lack of reporting, in particular by small firms, the share of "zombie" firms cannot be computed for 2016.
5 Investment grade companies are rated BBB or better.