Is there a debt service channel of monetary transmission?
Previous research has explored the impact of private sector debt service ratios (DSRs), ie debt payments relative to income, on medium-term macroeconomic outcomes. This special feature, based on a study of 18 economies, finds that monetary policy shocks, in turn, have a significant impact on DSRs. We show that a monetary tightening leads to a significant and persistent increase in DSRs, with higher effective lending rates on the stock of debt outweighing a decline in the debt-to-income ratio. Moreover, the impact of monetary policy shocks on DSRs, as well as on economic activity, the price level, house prices and credit, turns out to be significantly larger in high-debt economies. These findings point to the existence of a debt service channel of monetary transmission.1
JEL classification: E52.
There is growing evidence that high and rising debt is associated with sub-par medium-term growth (Jordà et al (2013), Mian et al (2017), Lombardi et al (2017)). Drehmann et al (2017) find that this effect is mainly attributable to changes in the debt service ratio (DSR), defined as the ratio of total debt payments (principal and interest) to the income of the private non-financial sector.2
Changes in the DSR can have aggregate macroeconomic effects, not only redistributive effects, if debtors and creditors differ in terms of their marginal propensities to consume and invest. Since debtors are typically credit- or liquidity-constrained, they are likely to have greater propensities to consume or invest out of changes in disposable income than creditors (Tobin (1982), Eggertsson and Krugman (2012), Kaplan and Violante (2014), Auclert (2017)). This notion is supported by empirical evidence (eg Mian and Sufi (2014), La Cava et al (2016) and Cloyne et al (2016)). Accordingly, an increase in the aggregate DSR, by transferring income from debtors to creditors, could reduce aggregate output because the decline in spending by debtors is only partially compensated by a rise in spending by creditors. Conversely, a lower DSR could boost economic activity because of the income transfer from creditors to debtors.
These observations suggest that the DSR might also be an important channel in the transmission of monetary policy. Indeed, the extraordinary monetary accommodation provided by the leading central banks in the wake of the Great Financial Crisis (GFC) was in part motivated by a desire to reduce the debt service burdens of households and firms through lower interest rates. And an oft-heard argument in the current debate about the appropriate pace of monetary policy normalisation is that high debt makes the economy more interest rate-sensitive, so that normalisation in highly indebted countries should proceed very cautiously.
Conceptually, however, the impact of monetary policy on the DSR is not clear a priori. In particular, the DSR depends on the debt-to-income ratio of the private sector, as well as on the effective lending rate that has to be paid on the debt. While there is a positive link between changes in the stance of monetary policy and the effective lending rate that is likely to dominate in the short term, the impact on the debt-to-income ratio that kicks in over medium-term horizons typically goes in the opposite direction. Put differently, a policy easing lowers the interest rate that debtors have to pay, but also raises the stock of debt relative to income, and vice versa for a policy tightening. Moreover, the evolution of the policy rate itself, ie the persistence of the policy tightening or easing, also matters for the dynamic response of the DSR to the monetary policy impulse. How monetary policy affects debt service burdens over different horizons is hence ultimately an empirical question.
In this special feature, we explore the transmission of monetary policy through the DSR in the context of an otherwise standard vector autoregression (VAR) for monetary policy analysis. Specifically, extending the approach in Hofmann and Peersman (2017), we analyse the impact of a monetary policy shock (ie a conventional interest rate shock) on the private non-financial sector DSR and its components in a panel of 18 economies over a sample period from the mid-1980s to the onset of the GFC.
There are two main findings. First, a monetary policy tightening triggers a significant and persistent increase in the DSR. Higher policy rates increase effective lending rates, and this effect dominates a fall in debt-to-income ratios, a finding that is consistent with the results of Juselius et al (2017). Second, monetary policy has a stronger impact on DSRs, as well as on economic activity, the price level, house prices and credit, in economies where private sector debt is higher. Although there might be alternative explanations, the stronger effects of monetary policy in high- debt countries may reflect the presence of a debt service channel of monetary transmission. Specifically, a higher debt-to-income ratio mechanically boosts the impact of a change in interest rates on DSRs, and through this channel possibly also on the wider economy.3
The remainder of the article is organised as follows. Section 1 discusses the impact of monetary policy on DSRs in general terms. Section 2 presents the empirical analysis, while Section 3 analyses the role of the level of debt in the transmission of monetary policy.
Monetary policy and the debt service ratio
The DSR is defined as the ratio of interest and principal payments to income. Unfortunately, few countries collect consistent data on total debt service. Figures are often available on interest payments, but data on amortisation are less common. However, by using the standard formula for the per-period cost of an instalment loan and dividing it by income, the aggregate DSR at time t can be approximated as follows:
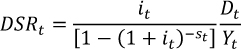
where D is total stock of debt, Y quarterly income, i the average interest rate on the existing stock of debt per quarter and s the average remaining maturity in quarters (see Drehmann et al (2015) for a derivation).4
Monetary policy could affect the DSR in several ways. The most direct effect works through the interest payable on the stock of debt (hereafter referred to as the effective lending rate). This effect is unambiguously positive: higher policy rates raise lending rates. Its magnitude depends on the strength and speed of interest rate pass-through, which in turn depends on interest rate adjustability and the average debt maturity. In addition, a change in monetary policy rates could affect the debt-to-income ratio, but the direction of this impact is unclear. Specifically, a policy tightening typically reduces both credit volumes and income. The ratio of debt to income may therefore fall or rise, with the empirical evidence pointing to a fall over medium-term horizons (Bauer and Granziera (2016), Hofmann and Peersman (2017)).
Overall, the impact of monetary policy on the DSR is thus not clear a priori. The effect will depend on the structural features of credit markets, such as the adjustability of lending rates, on other aspects of monetary policy transmission, which are likely to vary across economies, and on the time horizon. Furthermore, the impact at longer horizons will depend on the persistence of the monetary policy impulse. In particular, the policy rate itself will typically respond to the macro-financial dynamics triggered by the initial shock, which will in turn affect the evolution of the DSR. How monetary policy affects DSRs over different horizons is therefore ultimately an empirical question.
Empirical analysis
In order to assess monetary transmission through the DSR, we estimate a panel VAR for 18 economies over the period Q1 1985-Q4 2008.5 The sample starts in the mid-1980s because the monetary policy regimes and financial systems of most economies underwent substantial changes in the late 1970s and early 1980s. It ends in 2008 in order to exclude the post-2008 period, when interest rates hit the zero lower bound in a number of economies.6 That said, running our panel VAR including data for the period 2009-16 yields very similar results.
The specification of the VAR follows that of Hofmann and Peersman (2017), but it includes the DSR as an endogenous variable, and excludes commodity prices, as that variable is not needed to avoid a significant "price puzzle" over our sample period.7 The benchmark VAR therefore includes the following variables: (log) real GDP, (log) GDP deflator, (log) real house prices, the monetary policy rate, (log) real private non-financial credit, and the DSR of the private non-financial sector.8
We identify monetary policy shocks using a standard Cholesky decomposition with the ordering of variables as listed in the previous paragraph. In particular, monetary policy shocks are assumed to have no contemporaneous impact on output, the price level and real house prices, but are allowed to affect real credit flows and the DSR in the same quarter. The policy interest rate, in turn, is assumed to respond to contemporaneous changes in all variables except for credit and the DSR. This ordering is consistent with previous benchmark studies (eg Christiano et al (1996, 1999)). It reflects the notion that real output, goods prices and house prices are rather sluggish and do not respond within a quarter to monetary impulses, while financial flows as well as lending rates, and hence the DSR, are more flexible, so that an immediate response cannot be ruled out. That said, changing the ordering of credit and house prices has little or no effect on the results.9 We normalise monetary policy shocks so that the results reflect an increase in the policy rate of 1 percentage point.
Panel impulse responses are derived using a mean group procedure, by calculating the averages of the impulse responses of the individual economies. This approach allows for country-specific patterns in monetary transmission. The following graphs show the mean group impulse responses, together with one- and two-standard error confidence intervals.10
Graph 1 reports the impulse response functions (IRFs) from the baseline panel VAR. A 1 percentage point shock to the policy rate causes real GDP and the GDP deflator to fall by a maximum of 0.6% and 0.4% after 12 and 22 quarters, respectively (first two panels). House prices and credit respond more strongly, dropping by up to 1.7% and 1.2% after 13 and 17 quarters (third and fifth panels). The policy rate gradually returns to baseline and turns significantly negative eight quarters after the shock (fourth panel), reflecting the monetary policy response to the negative macro-financial effects triggered by the initial shock. These results are reasonable and are consistent with recent evidence for the United States documenting relatively strong effects of monetary policy on housing and credit markets since the mid-1980s (Hofmann and Peersman (2017)).
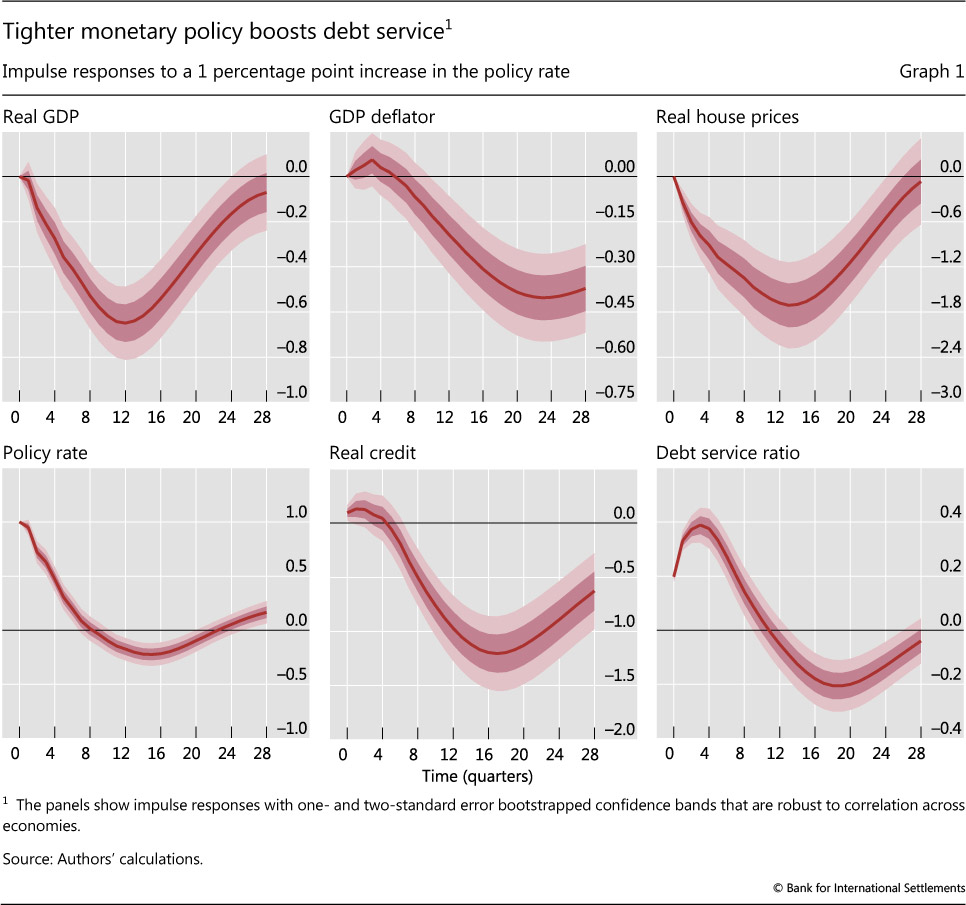
The impact of a monetary policy shock on the DSR is sizeable and significantly positive. A 1 percentage point shock to the policy rate raises the DSR on impact by 0.2 percentage points and by a maximum of 0.4 percentage points after three quarters (Graph 1, sixth panel). Subsequently, the impact starts to decline and becomes significantly negative after about 12 quarters. Qualitatively, the DSR response tracks that of the policy rate, with a lag of about three quarters. Quantitatively, the pass-through of the policy rate shock to the DSR is incomplete, ie the DSR rises at the peak by less than half of the initial shift in the policy rate.
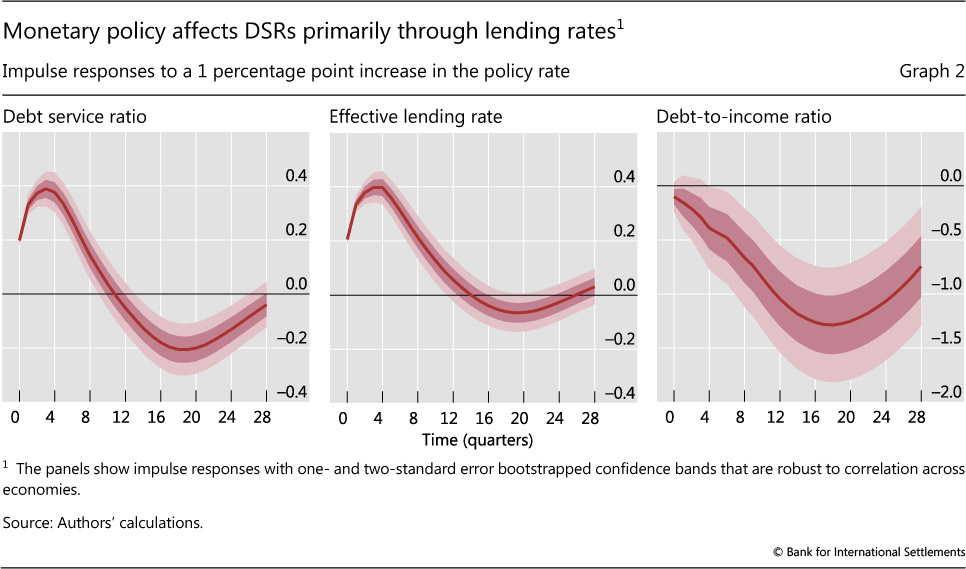
In order to shed more light on how monetary policy affects the DSR, we re-estimate the benchmark model replacing the DSR with its components, namely the effective lending rate on the stock of debt and the debt-to-income ratio. The IRFs of these two variables are shown in Graph 2.
These results suggest that the DSR response is mainly shaped by that of the effective lending rate. In particular, the positive impact of the monetary policy shock on the effective lending rate dominates its negative impact on the debt-to-income ratio in the short term. In the wake of a 1 percentage point tightening shock to the policy rate, the effective lending rate increases by a maximum of 0.4 percentage points after three quarters and then gradually returns to baseline (Graph 2, centre panel), turning moderately negative after about 16 quarters. Thus, the response of the lending rate, like that of the DSR, closely tracks that of the policy rate, with a lag of about three quarters, and the pass-through is incomplete at up to 40% of the initial shift of the policy rate.
Meanwhile, the debt-to-income ratio gradually falls after a tightening, by as much as 1.3 percentage points after 18 quarters (Graph 2, right-hand panel). To some extent, the decline counteracts the impact of the increase in the lending rate on the DSR. The medium-term decline in the debt-to-income ratio ultimately translates into a decline in the DSR beyond the three-year horizon.
The role of debt
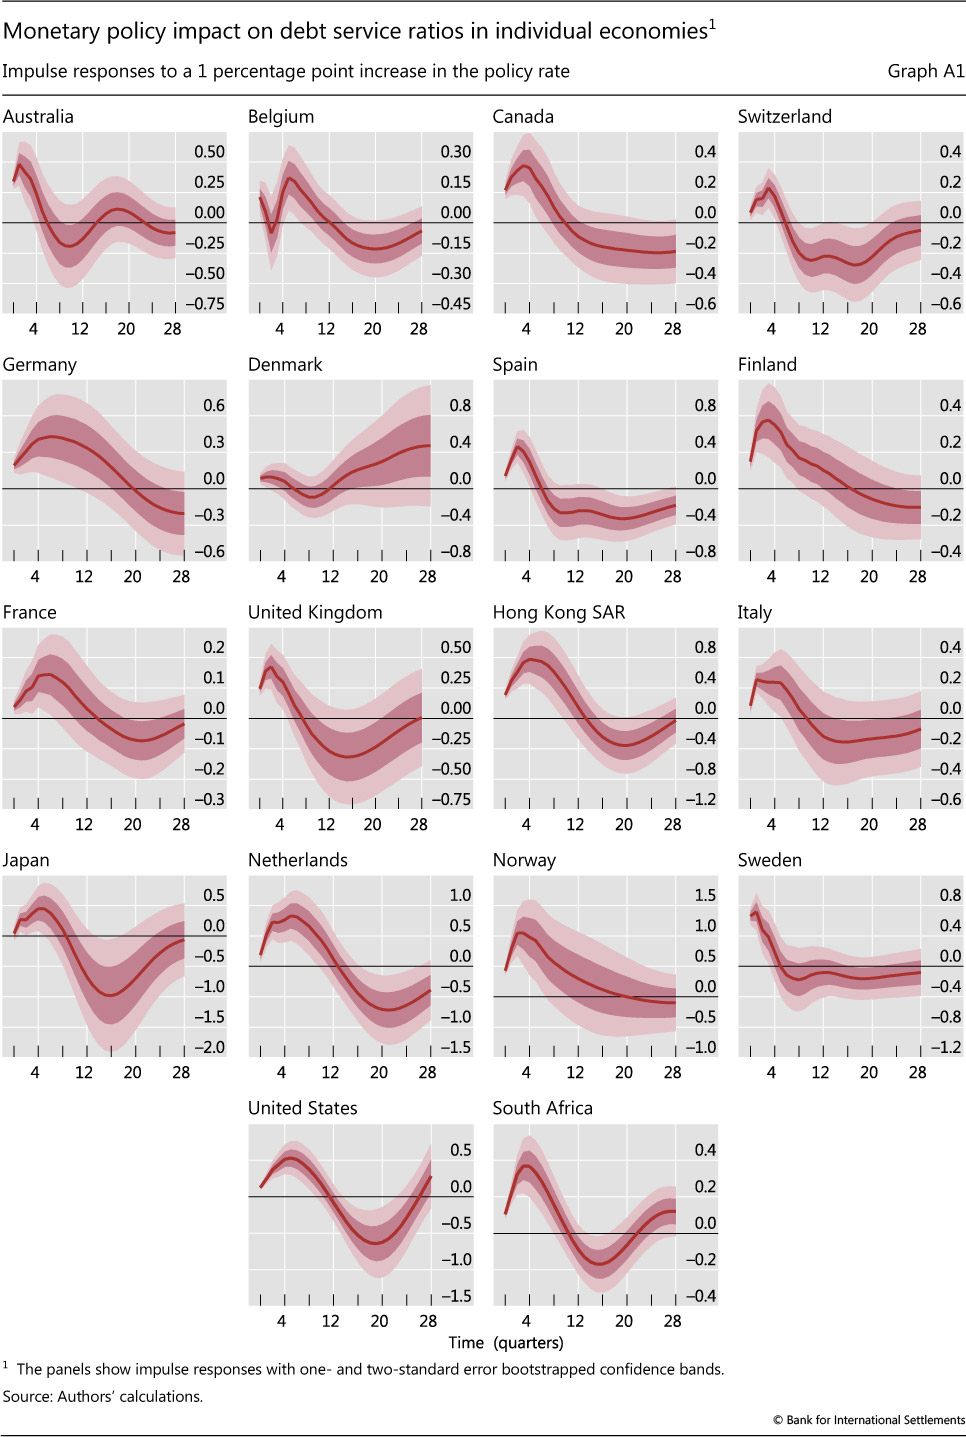
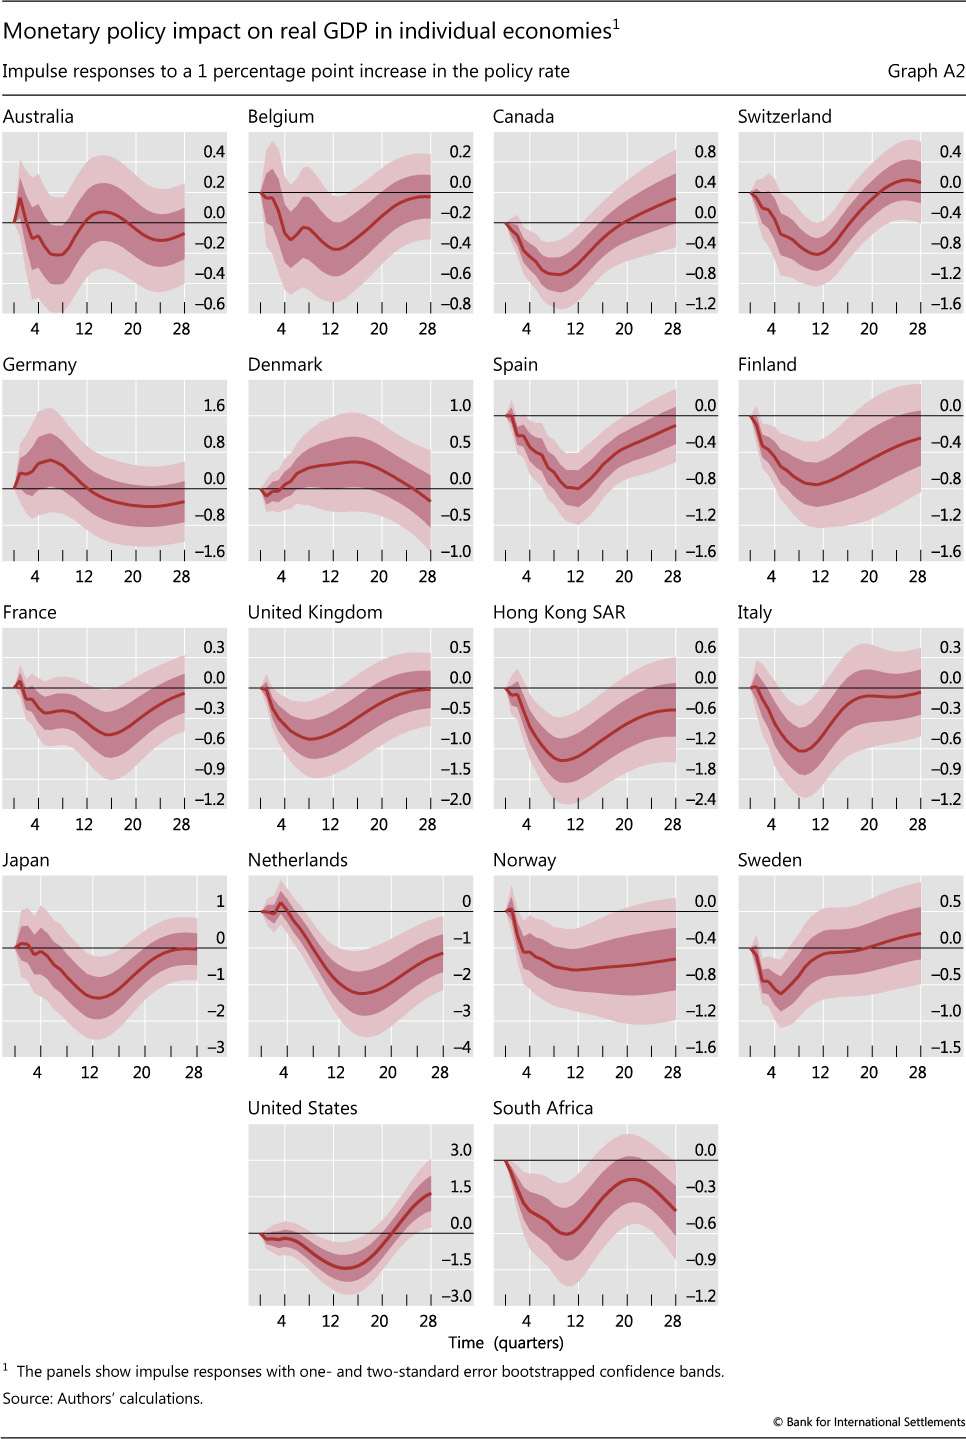
The results of the previous section are based on combined data for 18 economies. They reveal that a higher monetary policy rate tends to increase the DSR over a horizon of two years, because of its impact on the lending rate. Similar results hold at the individual economy level (Appendix Graph A1). However, the size of this effect differs across economies. Similarly, while tighter monetary policy almost always slows real GDP growth, this effect is stronger for some economies than for others (Appendix Graph A2).
One potential reason for these differences is the cross-country variation in private non-financial sector indebtedness.11 By construction, the magnitude of the impact of a change in policy rates on the DSR should, for a given pass-through to lending rates, depend on the (initial) debt-to-income ratio. In other words, when the private sector is more leveraged, a given change in the lending rate should have a larger effect on the DSR. If there is a debt service channel of monetary transmission, this could also strengthen the consequent effects on the macroeconomy.
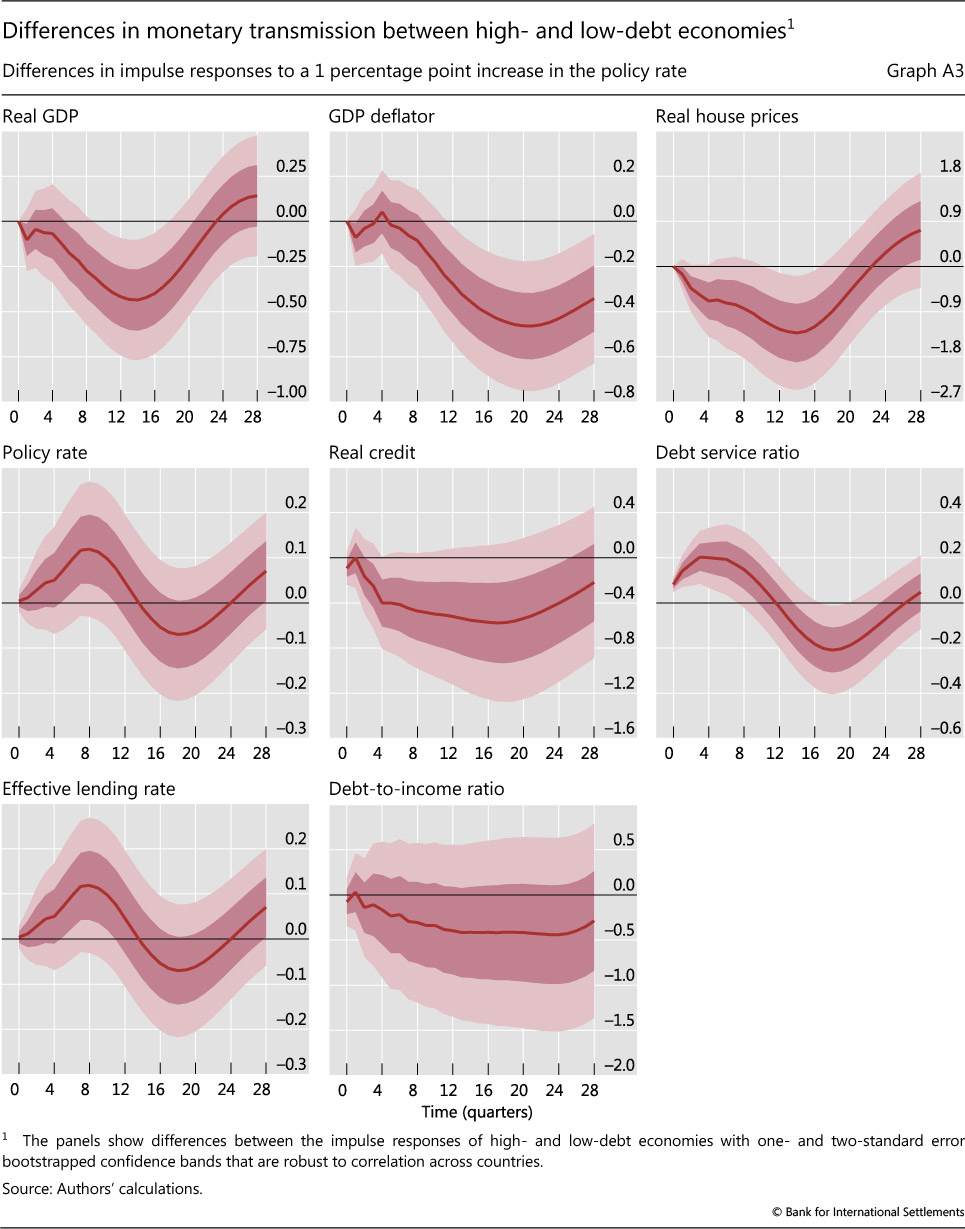
To analyse this hypothesis in more detail, we divide our sample into two groups of nine economies, according to their average private non-financial sector debt-to-GDP ratios over the sample period.12 We then estimate panel VARs for the high- and low-debt groups and compare the IRFs.13 Graph 3 shows the IRFs of the two groups, while Appendix Graph A3 shows the estimated differences between these IRFs.
The data confirm our intuition. The peak impact on the DSR is around 0.2 percentage points higher for the high-debt economies, and the difference is statistically significant (Graph 3 and Appendix Graph A3, sixth panel). By contrast, the impact on the effective lending rate and the debt-to-income ratio is quite similar across both groups. The difference between the impulse responses of the DSR components is statistically also not significant (Appendix Graph A3). This implies that the stronger response of the DSR to monetary policy in the high-debt economies is driven by the higher initial debt level, rather than by the changes in the DSR components following the monetary policy shock.
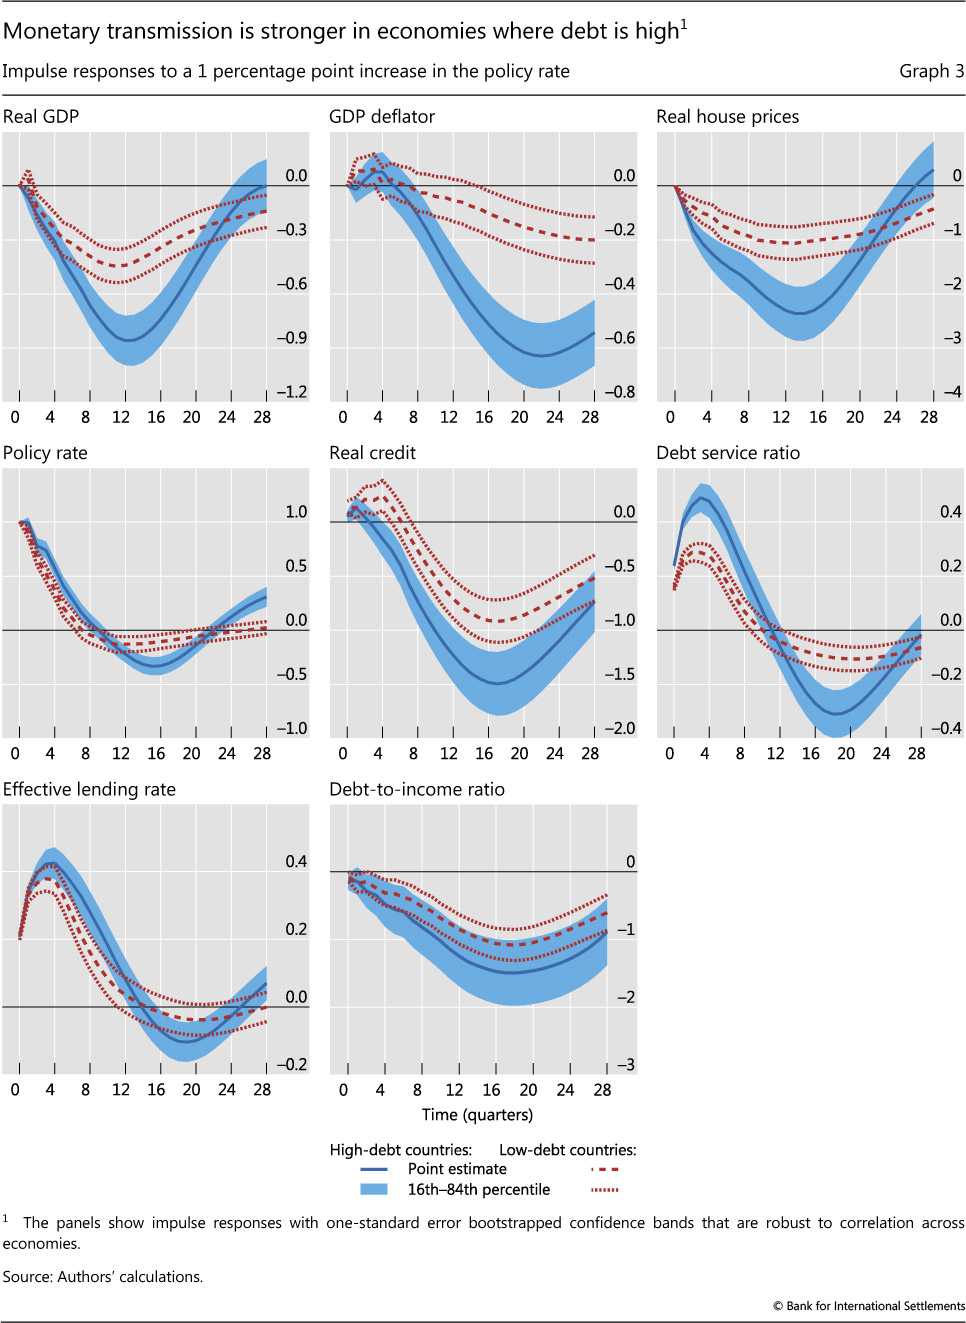
We also observe much stronger effects on economic activity and the price level in economies where private non-financial sector debt levels are higher. The peak responses of both real GDP and the GDP deflator are more than 0.4 percentage points larger in high-debt economies. The estimated differences are economically meaningful, ie the effects on real GDP are roughly double, and statistically highly significant (Graph 3 and Appendix Graph A3, first two panels). The impacts on house prices and credit are also significantly larger. In the high-debt economies, the drop in house prices is 1.3 percentage points larger than in the low-debt group, while that of credit is 0.6 percentage points larger (Graph 3 and Appendix Graph A3, third and fifth panels).14
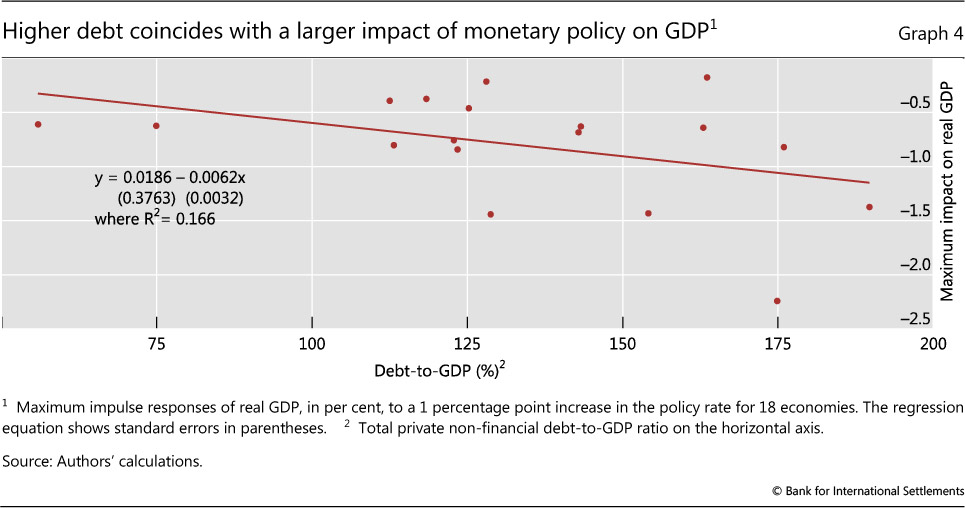
Graph 4 confirms that monetary policy has a stronger impact in economies where private debt is high. This graph compares the maximum impact of tighter policy on real GDP in the individual economies (on the vertical axis) with their average private non-financial sector debt-to-GDP levels during the sample period (on the horizontal axis). The correlation is negative and significant: GDP decreases more after a contractionary monetary policy shock in economies with high debt.
A possible explanation for the stronger effects of monetary policy when debt is high is the larger change in the DSR following a monetary policy shock. Specifically, a larger shift in the DSR implies a larger shift in the disposable income (that is, the income that remains after servicing debt) of debtors, who typically have a higher marginal propensity to consume than savers. Put differently, there might be a debt service channel of monetary transmission at play that enhances the effectiveness of monetary policy in countries with higher debt levels.
The analysis comes with caveats. The correlations between the strength of monetary transmission and the level of debt-to-GDP are obviously based on relatively few observations (economies). Moreover, these correlations do not control for the role of other factors that may be relevant for monetary transmission, such as differences in financial structure or the degree of economic and financial openness. That said, it is a first cross-country analysis of the role of debt in monetary transmission that could be developed further in future research.
Conclusions
Our results confirm that a potentially important, and underappreciated, channel through which monetary policy may affect the economy is its impact on private sector debt service ratios, as previously suggested by Juselius et al (2017). A change in the monetary policy stance, measured here as a monetary policy shock identified in a standard vector autoregression, triggers a significant and persistent change in the DSR in the same direction. A monetary tightening increases the DSR; an easing lowers it. This effect is the result of the positive impact of monetary policy on effective lending rates, which dominates a negative effect on debt-to-income ratios.
We also find that the effects of monetary policy on DSRs, as well as on economic activity, the price level, credit and housing markets, are significantly larger in countries with high private non- financial sector debt. The level of debt and the corresponding response of the DSR might therefore be important for the transmission of monetary policy. Potentially fruitful areas for future research include the precise nature of these effects as well as how they differ across countries, states of the economy, or tightening and easing episodes.
These findings suggest that the extraordinary monetary accommodation engineered by leading central banks in the wake of the Great Financial Crisis may have alleviated debt service burdens in highly indebted countries. This might have played an important role in dampening the after-effects of the crisis and in supporting the recovery. At the same time, our results also suggest that persistent high debt levels may represent a complicating factor in the ongoing or prospective normalisation of monetary policy in many economies. We find that economies with high debt are more interest rate-sensitive, so that a policy tightening could have stronger adverse macroeconomic effects than otherwise. Some observers argue that this could induce central banks to pursue the normalisation in a more cautious way, which could in turn raise the risk of a "debt trap" (eg Borio and Disyatat (2014) and Juselius et al (2017)): high debt makes it harder to raise rates, but keeping rates low induces further debt accumulation. A deeper analysis of these normative considerations is, however, beyond the scope of this special feature and is left for future research.
References
Albuquerque, B (2017): "One size fits all? Monetary policy and asymmetric household debt cycles in US states", Ghent University Working Papers, no 2017/937, May.
Alpanda, S and S Zubairy (2017): "Household debt overhang and transmission of monetary policy", Texas A&M University, mimeo.
Auclert, A (2017): "Monetary policy and the redistribution channel", NBER Working Papers, no 23451.
Bank for International Settlements (1995): "Financial structure and the monetary policy transmission mechanism", BIS Papers, no 0, March.
Bauer, G and E Granziera (2017): "Monetary policy, private debt and financial stability risks", International Journal of Central Banking, vol 13, pp 337-73.
Borio, C (1995): "The structure of credit to the non-government sector and the transmission mechanism of monetary policy: a cross-country comparison", BIS Working Papers, no 24, April.
Borio, C and P Disyatat (2014): "Low interest rates and secular stagnation: is debt a missing link?", VOX, June.
Calza, A, T Monacelli and L Stracca (2013): "Housing finance and monetary policy", Journal of the European Economic Association, vol 11, pp 101-22.
Christiano, L, M Eichenbaum and C Evans (1996): "The effects of monetary policy shocks: evidence from the flow of funds", The Review of Economics and Statistics, vol 78, no 1, pp 16-34.
--- (1999): "Monetary policy shocks: what have we learned and to what end?", in J Taylor and M Woodford (eds), Handbook of Macroeconomics, vol (1)A, Amsterdam: Elsevier Science, pp 65-148.
Cloyne, J, C Ferreira and P Surico (2016): "Monetary policy when households have debt: new evidence on the transmission mechanism", Bank of England, Working Papers, no 589, April.
Committee on the Global Financial System (2006): "Housing finance in the global financial market", CGFS Papers, no 26, January.
Di Maggio, M, A Kermani, B Keys, T Piskorski, R Ramcharan, A Seru and V Yao (2017): "Interest rate pass-through: mortgage rates, household consumption, and voluntary deleveraging", American Economic Review, vol 107, no 11, pp 3550-88.
Di Maggio, M, A Kermani and R Ramcharan (2015): "Monetary policy pass-through: household consumption and voluntary deleveraging", Society for Economic Dynamics 2015 Meeting Papers, no 256.
Drehmann, M, A Illes, M Juselius and M Santos (2015): "How much income is used for debt payments? A new database for debt service ratios", BIS Quarterly Review, September 2015, Box 2, p 98.
Drehmann, M and M Juselius (2012): "Do debt service costs affect macroeconomic and financial stability? ", BIS Quarterly Review, September, pp 21-35.
--- (2014): "Evaluating early warning indicators of banking crises: satisfying policy requirements", International Journal of Forecasting, vol 30, no 3, pp 759-80 (also published as BIS Working Paper no 421).
Drehmann, M, M Juselius and A Korinek (2017): "Accounting for debt service: the painful legacy of credit booms", BIS Working Papers, no 645, June.
Eggertsson, G and P Krugman (2012): "Debt, deleveraging, and the liquidity trap: a Fisher-Minsky-Koo approach", Quarterly Journal of Economics, vol 127, no 3, pp 1469- 1513.
Hofmann, B and G Peersman (2017): "Monetary policy transmission and trade-offs in the United States: old and new", BIS Working Papers, no 649, July.
Jordà, Ò, M Schularick and A Taylor (2013): "When credit bites back", Journal of Money, Credit and Banking, vol 45, issue s2, pp 3-28.
Juselius, M, C Borio, P Disyatat and M Drehmann (2017): "Monetary policy, the financial cycle, and ultra-low interest rates", International Journal of Central Banking, vol 13, no 3, pp 55-90.
Juselius, M and M Drehmann (2015): "Leverage dynamics and the real burden of debt", BIS Working Papers, no 501, May.
Kaplan, G and G Violante (2014): "A model of the consumption response to fiscal stimulus payments", Econometrica, vol 82, no 4, pp 1199-1239.
Koo, R (2009): The holy grail of macroeconomics - lessons from Japan's Great Recession, John Wiley & Sons.
La Cava, G, H Hughson and G Kaplan (2016): "The household cash flow channel of monetary policy", Reserve Bank of Australia, Research Discussion Papers, no 2016-12, December.
Lombardi, M, M Mohanty and I Shim (2017): "The real effects of household debt in the short and long run", BIS Working Papers, no 607, January.
Mian, A and A Sufi (2014): House of debt: how they (and you) caused the Great Recession, and how we can prevent it from happening again, University of Chicago Press.
Mian, A, A Sufi and E Verner (2017): "Household debt and business cycles worldwide", Quarterly Journal of Economics, forthcoming.
Sims, C (1992): "Interpreting the macroeconomic time series facts: the effects of monetary policy", European Economic Review, vol 36, no 5, pp 975-1000.
Sims, C, J Stock and M Watson (1990): "Inference in linear time series models with some unit roots", Econometrica, vol 58, no 1, pp 113-44.
Tobin, J (1982): Asset accumulation and economic activity: reflections on contemporary macroeconomic theory, University of Chicago Press.
1 The authors would like to thank Bruno Albuquerque, Claudio Borio, Stijn Claessens, Benjamin Cohen, Selien De Schryder, Mathias Drehmann, Mikael Juselius and Hyun Song Shin for helpful comments and Matthias Lörch for assistance with the graphs. The views expressed are those of the authors and do not necessarily reflect those of the BIS.
2 Previously, Juselius and Drehmann (2015) have documented a key role for DSRs in driving expenditures. DSRs have also been shown to be a useful short-term early warning indicator for financial distress (Drehmann and Juselius (2012, 2014)).
3 Recent studies have focused on a possible weakening of monetary transmission when there is a debt overhang in the private sector as a consequence of the attenuating effects of deleveraging motives. In such situations, borrowers decide to lower expenditures in order to cut their debt burdens and restore their wealth through higher saving (Mian and Sufi (2014)). Giving priority to balance sheet repair over intertemporal expenditure smoothing could then dampen the impact of lower rates on economic activity (eg Koo (2009) and Di Maggio et al (2017)). For example, Alpanda and Zubairy (2017) find for the United States that monetary transmission is weaker in periods of debt overhang, measured as the deviation of debt from its long-term trend. Note that our results suggest that a higher level of debt can strengthen monetary transmission across economies and over time through the DSR, which is not necessarily incompatible with a possibly weaker transmission in periods of large debt overhang. On the other hand, our results are at odds with Albuquerque (2017), who finds that the long-run effects of monetary policy on real GDP and household debt are weaker in US states with higher household debt ratios.
4 The BIS publishes estimated DSRs for the household sector, the non-financial corporate sector and the total private non-financial sector using standardised data inputs for 17 countries beginning in 1999. Total DSRs are also available for 15 additional countries, using alternative income and interest rate measures, reflecting differences in data availability at the national level. The data and more detailed information are available on the BIS website at http://www.bis.org/statistics/dsr.htm. The historical data used in the analysis here are from Drehmann and Juselius (2014).
5 The economies are Australia, Belgium, Canada, Denmark, Finland, France, Germany, Hong Kong SAR, Italy, Japan, the Netherlands, Norway, South Africa, Spain, Sweden, Switzerland, the United Kingdom and the United States.
6 Over this period, many central banks provided additional monetary policy stimulus through other policy tools, in particular large- scale asset purchases, rendering the policy rate an inaccurate summary indicator of the monetary policy stance.
7 The "price puzzle" refers to a counterintuitive initial increase in the price level following a contractionary monetary policy shock. Sims (1992) first uncovered this anomaly and showed that it tends to disappear when commodity prices are included in a VAR. He suggested that the anomaly arises because central banks respond to commodity prices as an indicator of future inflation, so that omitting this variable from the model would produce an apparent price "reaction" that in fact reflects the response of monetary policy to perceived future inflation. Note that extending the VAR with commodity prices does not alter our conclusions.
8 We estimate the VAR in (log) levels with four lags, which allows for possible cointegrating relationships in the data (Sims et al (1990)).
9 Results from robustness checks with different orderings of house prices and credit are available upon request.
10 The confidence intervals are constructed using 10,000 replications of a recursive-design wild bootstrap procedure that accounts for possible correlation of the VAR residuals across economies.
11 Another possible reason is the flexibility of the effective lending rate, determined by the maturity structure of debt contracts (short- vs long-term) and the adjustability of lending rates (fixed vs variable). We do not assess the relevance of this potential factor here because the information on lending rate flexibility is rather sketchy. For instance, information on the adjustability of lending rates is generally available only for the household sector and for specific points in time (Borio (1995), CGFS (2006)). BIS (1995) finds that the distinction between fixed and flexible lending rates was important in explaining cross-country differences in monetary transmission. More recently, Calza et al (2013) report VAR- based evidence suggesting that monetary transmission to house prices, consumption and residential investment is stronger in economies with predominantly variable rate - as opposed to fixed rate - mortgage contracts.
12 Debt-to-GDP is preferred to debt-to-income of the private non-financial sector because it also accounts for the share of the private sector in total GDP. The group of high-debt economies comprises Canada, Denmark, Hong Kong SAR, Japan, the Netherlands, Norway, Sweden, Switzerland and the United States; the low-debt economies are Australia, Belgium, Finland, France, Germany, Italy, South Africa, Spain and the United Kingdom.
13 The confidence intervals are constructed as before (see footnote 10). The joint estimation of the VARs allows us to construct confidence intervals for the differences between the high-debt and low-debt economies' IRFs.
14 These results also hold when we exclude individual countries from the analysis, and when we change the groupings, eg comparing the six highest and six lowest debt-to-GDP economies.