Downsized FX markets: causes and implications
For the first time in 15 years, FX trading volumes contracted between two consecutive BIS Triennial Surveys. The decline in trading by leveraged institutions and "fast money" traders, and a reduction in risk appetite, have contributed to a significant drop in spot market activity. More active trading of FX derivatives, largely for hedging purposes, has provided a partial offset. Many FX dealer banks have become less willing to warehouse risk and have been re-evaluating their prime brokerage business. At the same time, new technologically driven non-bank players have gained firmer footing as market-makers and liquidity providers. Against this backdrop, FX trading is becoming increasingly relationship-driven, albeit in an electronic form. Such changes in the composition of market participants and their trading patterns may have significant implications for market functioning and FX market liquidity resilience going forward.1
JEL classification: C42, C82, F31, G12, G15.
This article explores the evolution of trading volumes and structural shifts in the global foreign exchange (FX) market, drawing on the 2016 Triennial Central Bank Survey of Foreign Exchange and Derivatives Market Activity (in short, "the Triennial"). Central banks and other authorities in 52 jurisdictions participated in the 2016 survey, collecting data from close to 1,300 banks and other dealers.
For the first time since 2001, global FX trading declined between two consecutive surveys. Global FX turnover fell to $5.1 trillion per day in April 2016, from $5.4 trillion in April 2013 (Graph 1, left-hand panel). In particular, spot trading fell to $1.7 trillion per day in April 2016, from $2.0 trillion in 2013. In contrast, trading in most FX derivatives, particularly FX swaps, continued to grow. In addition, a number of emerging market economy (EME) currencies gained market share, most notably the renminbi.2
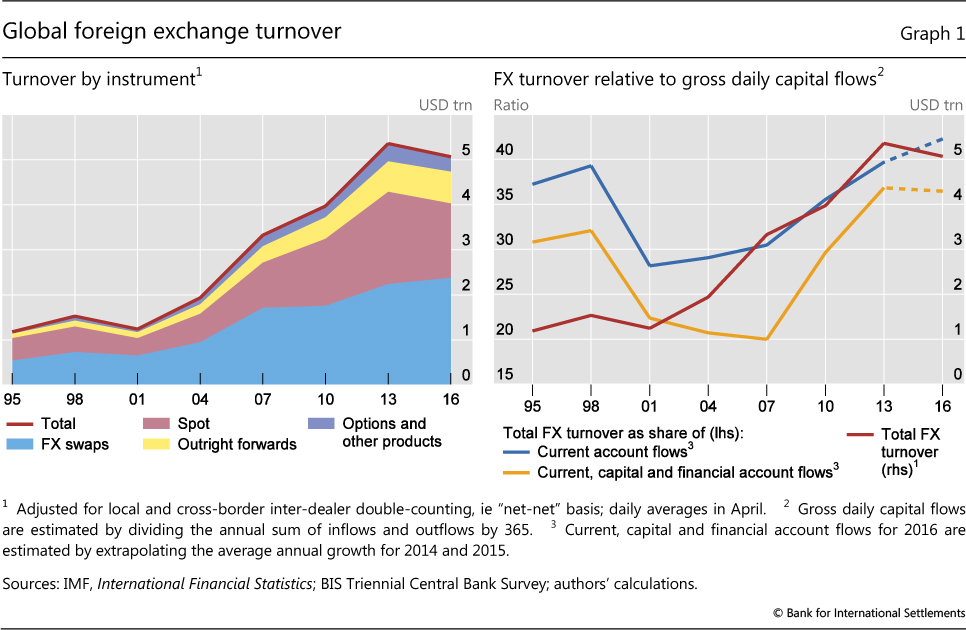
Part of the decline in global FX activity can be ascribed to less need for currency trading, as global trade and capital flows have not returned to their pre-Great Financial Crisis (GFC) growth rates (Graph 1, right-hand panel). However, conventional macroeconomic drivers alone cannot explain the evolution of FX volumes or their composition across counterparties or instruments. This is because fundamental trading needs only account for a fraction of transactions. Instead, the bulk of turnover reflects inventory risk management by reporting dealers, their clients' trading strategies and the technology used to execute trades and manage risks.
This special feature examines these structural factors and changes in trading patterns underpinning global FX activity. Some major takeaways are as follows. The composition of participants changed in favour of more risk-averse players. The greater propensity to transact FX for hedging rather than risk-taking purposes by these investors has led to a decoupling of turnover in most FX derivatives from that in spot and options trading. Patterns of liquidity provision and risk-sharing in FX markets have also evolved. The number of dealer banks willing to warehouse risks has declined, while non-bank market-makers have gained a stronger footing as liquidity providers, even trading directly with end users. These shifts have been accompanied by complementary changes in trade execution methods. Market structure may be slowly shifting towards a more relationship-based form of trading, albeit in a variety of electronic forms.
The rest of the article is organised as follows. The first section focuses on the changing composition of FX market participants and its implications for the configuration of the main FX instruments. The second section discusses the changing patterns of liquidity provision, the growth of electronic non-bank market-makers and new forms of risk-sharing in wholesale FX markets. The third section looks at the associated changes in trade execution methods, which appear to be gravitating towards relationship-based electronic trading models. The conclusion highlights some implications for policy and financial stability.
The changing composition of FX markets
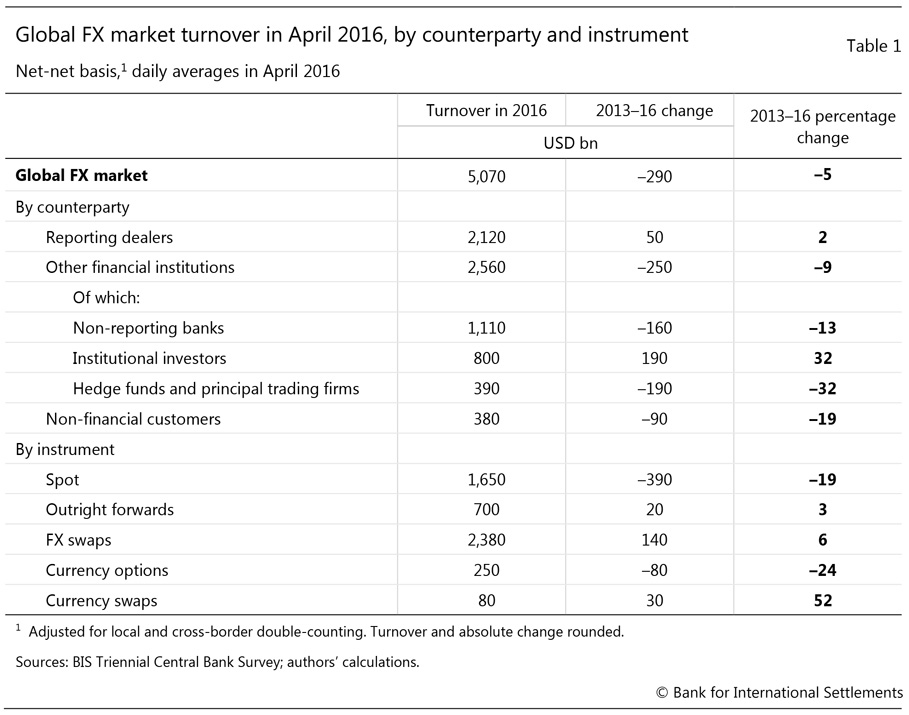
The past three years have seen large shifts in FX market activity, in terms of both participants and instruments (Table 1). Hedge funds, non-financial end users and smaller banks have reduced their market presence. In contrast, institutional investors have increased their participation, notably for hedging purposes. And certain algorithmic strategies primarily based on speed have reached a saturation point. These shifts have contributed to the decoupling of FX spot trading from activity in most FX derivatives.
Trends in FX market participation
Participation in FX markets has shifted towards less leveraged and more risk-averse participants. A first indication of such a shift is that trading involving institutional investors, such as insurance companies and pension funds, grew by a third between 2013 and 2016 (Table 1). These types of long-term investors tend to exhibit lower tolerance for foreign currency risk in their portfolios and use FX markets to hedge such risks. Indeed, their FX swap trading volume rose by approximately 80% to more than a quarter of a trillion US dollars per day in 2016.
Box A
Drivers of aggregate FX turnover
The macroeconomic backdrop has pointed to a moderation of the underlying demand for (spot) FX trading. Global trade (as a share of GDP) and global capital flows have fallen since 2013. Hence, global FX turnover has actually held up well relative to gross current, capital and financial account trading needs (Graph 1, right-hand panel). Trading with non-financial customers has dropped by about 20% (Table 1), another sign pointing to a decline in FX transactions associated with global trade.
The overall fall in turnover conceals important nuances about the evolution of FX turnover between the 2013 and 2016 Triennials. To see this, we follow Bech (2012) and Bech and Sobrun (2013) and compute measures of benchmarked FX volumes using a combination of sources, including the more frequent FX surveys conducted by regional foreign exchange committees, information from major electronic trading platforms and CLS settlement volumes. The higher-frequency perspective reveals an even more pronounced drop in trading activity. FX activity actually peaked in September 2014, at $6.5 trillion per day (Graph A, left-hand panel). Volumes fell off steeply thereafter, to less than $5 trillion per day in November 2015, before recovering somewhat by April 2016.
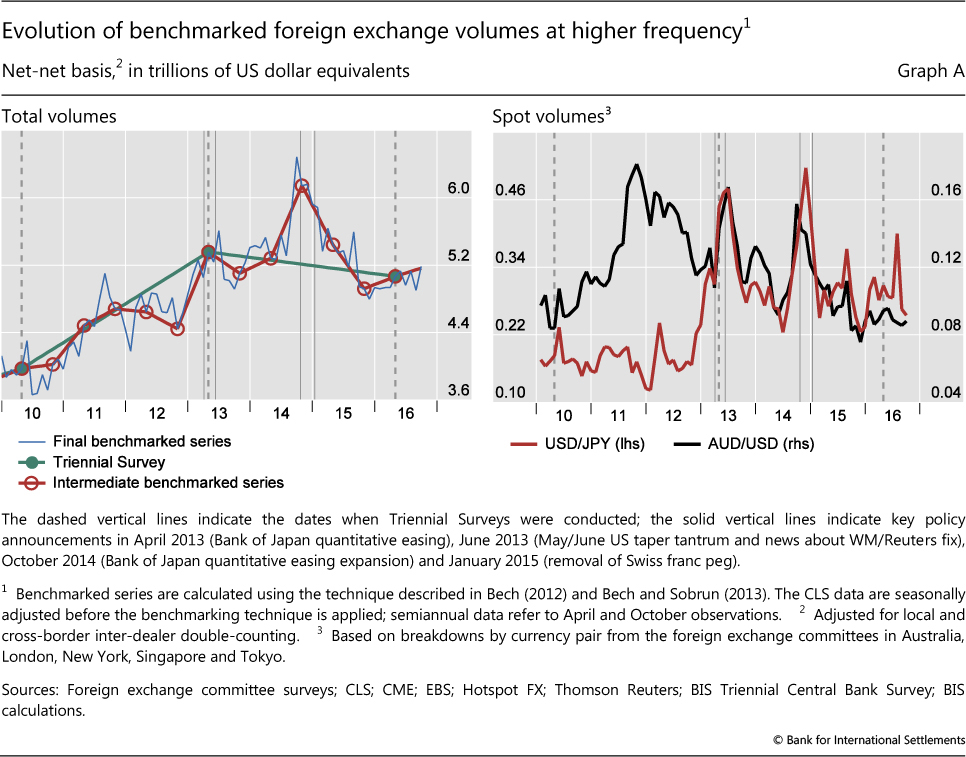
Several factors, some due to central bank policy measures, seem to have led to this pattern. The previous Triennial took place amid heightened FX activity against the background of policy easing by the Bank of Japan in April 2013 (Rime and Schrimpf (2013)). FX trading then continued to rise until June 2013. This was the month when attention turned to the London 4 pm WM/Reuters fixing scandal. The same month coincided with the "taper tantrum", when expectations mounted that the US Federal Reserve would begin tapering its asset purchases. Trading volumes rebounded again in the second half of 2014, against the background of further easing by the ECB, including the introduction of negative policy rates, and an expansion of the Quantitative and Qualitative Monetary Easing (QQE) programme by the Bank of Japan that October. Indeed, major policy innovations by the Bank of Japan appeared to trigger heightened trading activity in the JPY/USD currency pair and related crosses, such as AUD/USD (Graph A, right-hand panel). This, in turn, contributed to spikes in total global FX market activity.
Aggregate volumes were also driven by the interaction of several macroeconomic developments with the micro drivers discussed in the text. The outsize price moves in the wake of the Swiss National Bank's abandonment of the Swiss franc's peg against the euro on 15 January 2015 sent shockwaves through the prime brokerage industry, causing prime brokers to raise fees and cut clients. This has further reduced participation by hedge funds and other leveraged players in FX markets, as they have already been experiencing low returns. Some banks also cut their business exposures to retail margin brokerage, which affected market access for retail aggregators. High-frequency trading (HFT) firms were also faced with tighter FX market access from the decline in prime brokerage as well as from various measures to curb HFT activity which were put in place by major FX trading venues beginning in mid-2013. All these developments had a disproportionate impact on spot trading, because the above-mentioned market participants seek returns by taking open currency positions or, in the case of HFT, focus on the most liquid instruments.
By contrast, trading in FX swaps rose because of the increase in currency hedging activity by long-term institutional investors, as they rebalanced their international portfolios on the back of central bank quantitative easing programmes. Similarly, FX liquidity management among dealer banks increased, as money market rates and lending spreads in major currencies diverged, which also contributed to the rise in FX swap turnover.
Second, and particularly striking, FX turnover via prime brokers3 fell sharply compared to 2013 - by 22% overall, and by close to 30% in spot markets (Graph 2, left-hand panel).
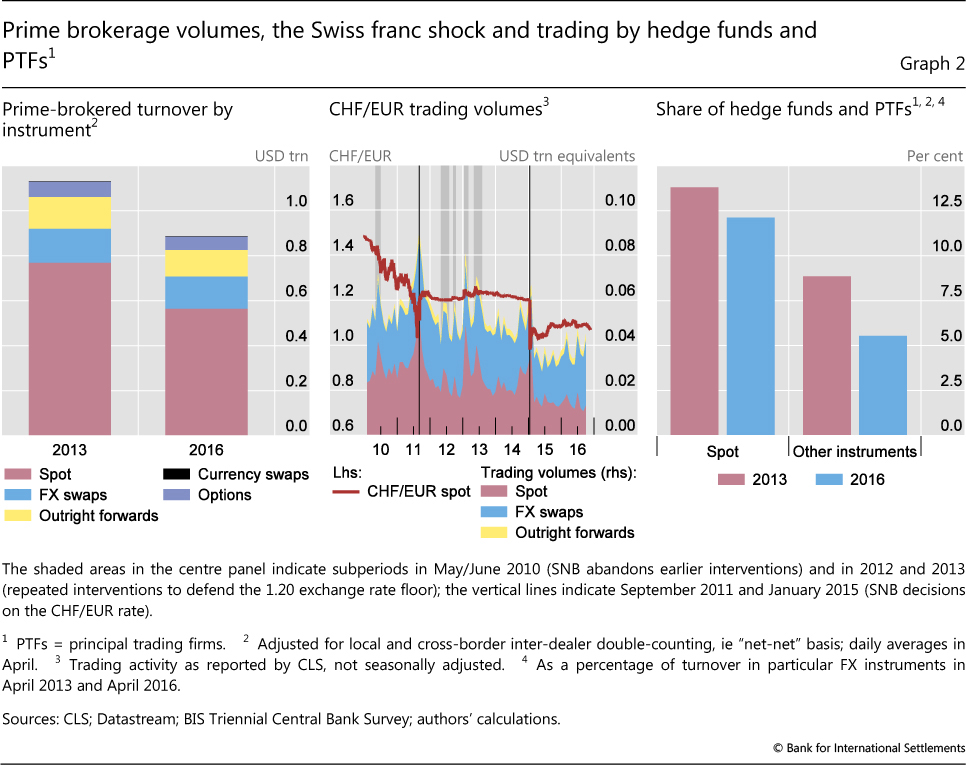
The drop in prime brokerage reflects a combination of factors. On the supply side, banks have been reassessing the profitability of their prime brokerage business in the wake of post-GFC regulatory reforms, low overall profitability and deleveraging pressures. A number of major prime brokers raised capital requirements, introduced tighter admission procedures and raised fees. In addition, the prime brokerage industry was jolted by the outsize price moves following the Swiss National Bank's decoupling of the Swiss franc from the euro on 15 January 2015 (Graph 2, centre panel), with FX dealer banks taking further steps to mitigate risks associated with FX prime brokerage. Interviews confirm that prime brokers have focused on retaining large-volume clients, such as large principal trading firms (PTFs) engaged in market-making (see below), while shedding retail aggregators, smaller hedge funds and some high-frequency trading (HFT) firms.
On the demand side, reduced trading by hedge funds and PTFs has been a key driver behind the drop in prime-brokered activity (Graph 2, right-hand panel). Hedge fund returns have been under pressure post-crisis, with assets under management falling further after the Swiss franc shock (Graph 3, left-hand panel).4 The fall in PTF activity, in turn, largely reflects the saturation of HFT strategies focused on aggressive fast trade execution and short-term arbitrage.5 The introduction of "speed bumps" in the form of latency floors by major inter-dealer platforms made such strategies less attractive (see below).
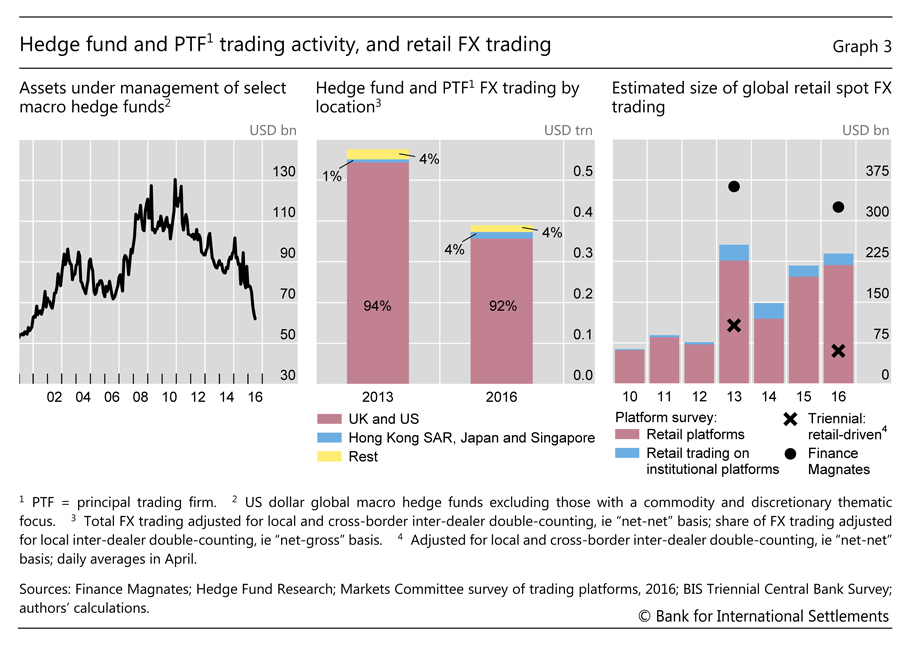
While declining in the aggregate, hedge fund and PTF activity has also been increasingly shifting towards Asian financial centres, albeit from a very small base (Graph 3, centre panel). Specifically, FX trading by hedge funds and PTFs in London and New York dropped by 50% and 10%, respectively, but rose by 88% in Hong Kong SAR, more than doubled in Singapore and tripled in Tokyo. Combined, Asian financial centres now account for 4% of trading by hedge funds and PTFs, compared with 1% in 2013. In part, this shift reflects the increased liquidity of Asian currencies, inducing PTFs to co-locate closer to the corresponding trading venues.
The retail brokerage segment was particularly affected by bouts of extreme volatility because retail traders are typically offered very high leverage against small initial margin requirements. Retail margin brokers were thus particularly exposed to losses stemming from the volatility that followed the removal of the Swiss franc's peg to the euro. As a result, some major FX dealing banks scaled down their business exposure to retail brokerage platforms. This, in turn, led retail aggregators to increasingly seek access to FX trading venues via a "prime-of-prime" relationship, whereby they are prime-brokered by a non-dealer bank, which is itself prime-brokered by an FX dealing bank. This migration of retail FX trading to venues at arm's length from FX dealer banks has contributed to the decline in spot trading classified as retail-driven in the Triennial (Graph 3, right-hand panel).
Implications for FX market activity across instruments
The decline in leverage and risk aversion also affected activity across FX instruments. On the one hand, the decline in FX trading by leveraged players and "fast money" traders, such as hedge funds and certain types of PTFs, contributed to a disproportionate fall in turnover in spot and FX options (Table 1). Their trading strategies often generate returns by taking directional exposures to currency movements using spot and options contracts. Similarly, HFT strategies tend to focus on spot trades because of the standardisation and liquidity of the instruments.
On the other hand, trading in derivatives used for FX funding by banks and for hedging by institutional investors and corporates actually increased. Most notably, turnover in FX swaps, the most actively traded instrument, rose by a further 6% (Table 1). Trading in (longer-dated) currency swaps also saw a significant pickup, albeit from a relatively low base (see also Box B for a description of similar shifts in renminbi trading).
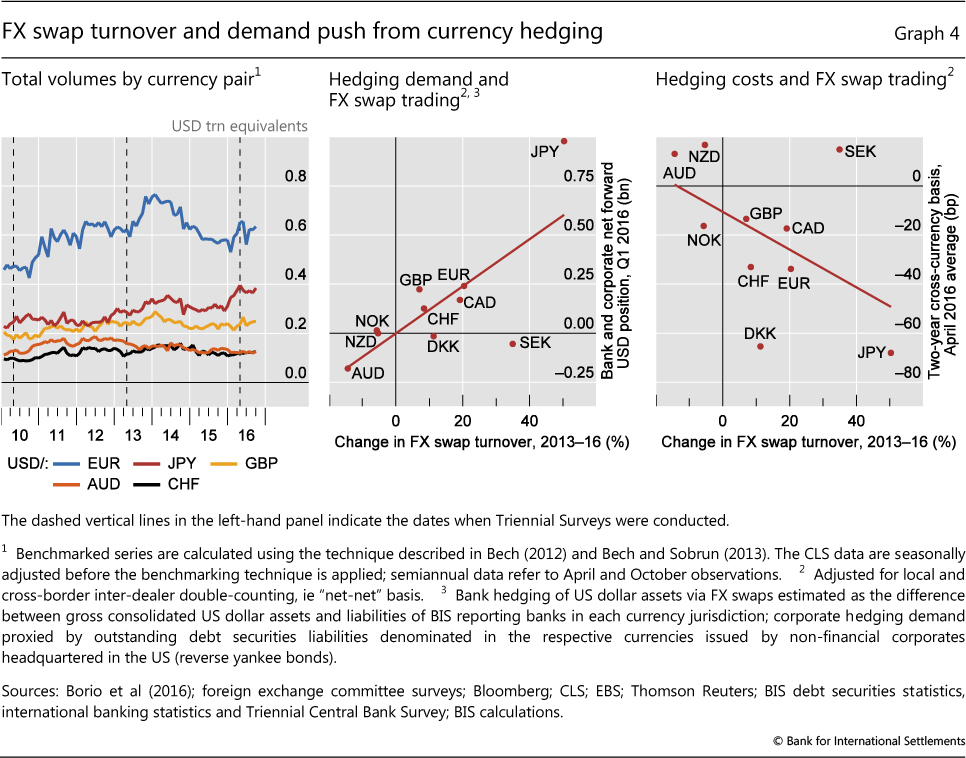
FX swap trading rose more in jurisdictions where measures of the underlying FX hedging needs of banks and corporates were the largest (Graph 4, centre panel). Major currency areas that eased monetary policy further in 2015 and 2016, such as the euro area and Japan, experienced a particularly steep rise in FX swap turnover against the US dollar (Graph 4, left-hand panel). This is consistent with rising demand for FX swaps as investors seek returns in higher-yielding currencies, and borrowers seek funding in lower-yielding currencies. Similarly, the turnover in FX swaps shows close association with currency risk hedging costs, as proxied by the cross-currency basis (Graph 4, right-hand panel), pointing again to the demand push for FX swaps from currency hedgers.6
New mechanisms of liquidity provision
Dealer banks have been adjusting their business models to their reduced capacity to warehouse risk and tighter limits on proprietary trading. In the process, a handful of top-tier dealer banks have consolidated their position as liquidity providers, attracting further customer flows, including from other banks. At the same time, these top FX dealer banks have also faced increasing competition from non-bank electronic market-makers. The composition of the latter has shifted away from those pursuing more aggressive latency-driven trading strategies to more passive strategies based on market-making. As a result, these firms have expanded their business to become top liquidity providers in FX markets.
Bifurcation of banks' role in FX market-making
Among dealer banks, there has been further bifurcation between the few large banks that remain willing to take risks onto their balance sheets as principals and other institutions that have moved to an agency model. The top-tier dealer banks that intermediate the lion's share of customer flows have maintained their position as large flow internalisers (Box C), price-makers and liquidity providers. By contrast, many other banks are increasingly acting simply as conduits, effectively sourcing liquidity from the largest dealers and passing it on to their clients. Thus, the warehousing of inventory risk falls onto the top-tier FX dealers.
Box B
The rise and financialisation of the renminbi
Renminbi turnover has approximately doubled every three years over the past decade and a half (Graph B, left-hand panel). Total daily turnover has reached over $200 million or 4% of global FX turnover. This makes the Chinese currency the eighth most traded currency in the world, overtaking the Mexican peso and only slightly behind the Swiss franc and Canadian dollar.
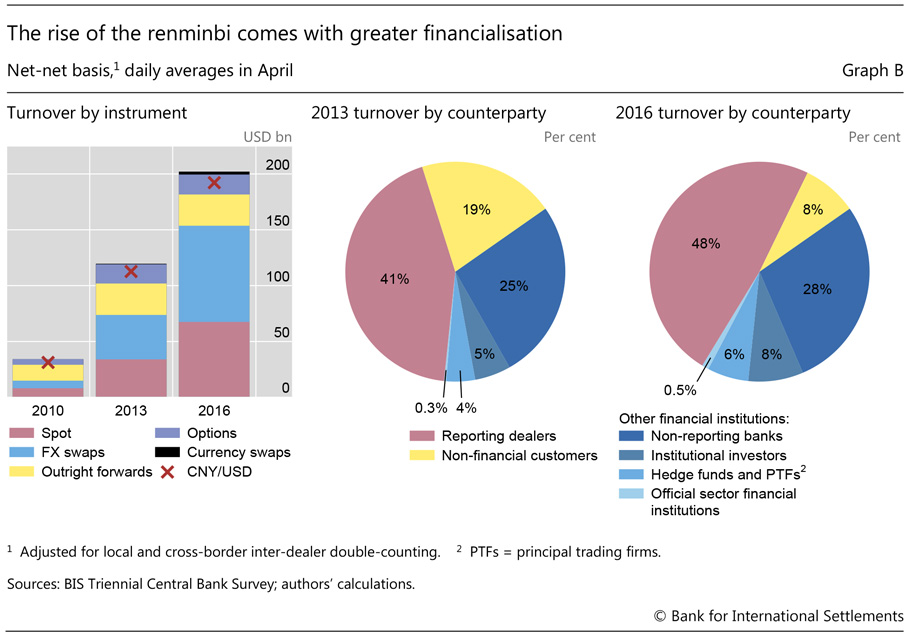
Along with the rise in the overall trading of the renminbi, its use as a financial instrument and to back financial rather than trade transactions has also increased. In the past, most of the limited turnover was in spot transactions. The Triennial reveals that spot now amounts to less than half of total turnover, while the share of FX swap trading has reached 40%. Associated with this, trading among financial institutions is now much more prevalent, while the share of renminbi trading with non-financial customers has declined steeply, from 19% in 2013 to 8% in 2016 (Graph B, centre and right-hand panels). However, the prominent role of the CNY/USD pair has not changed: 95% of renminbi trading is against the US dollar, and there is no serious liquidity in any other CNY pairs.
Renminbi trading volumes are growing rapidly, and the currency is becoming more financialised. The share of derivative compared with spot trading, and of financial compared with non-financial counterparties, are approaching that of well established and liquid currencies. Also, according to McCauley and Shu (2016), in line with RMB internationalisation, trading in offshore deliverable RMB forwards increased significantly, while that in non-deliverable forwards declined since the last survey. However, there are still impediments to the renminbi becoming a truly international currency. In addition to the low liquidity outside the CNY/USD pair, these include capital controls, the wedge between the offshore and onshore exchange rates, and ineligibility for CLS settlement. At the same time, the rapid growth of renminbi trading and the development of the associated financial markets (Ehlers et al (2016)) suggest that these hurdles may be cleared faster than might be expected.
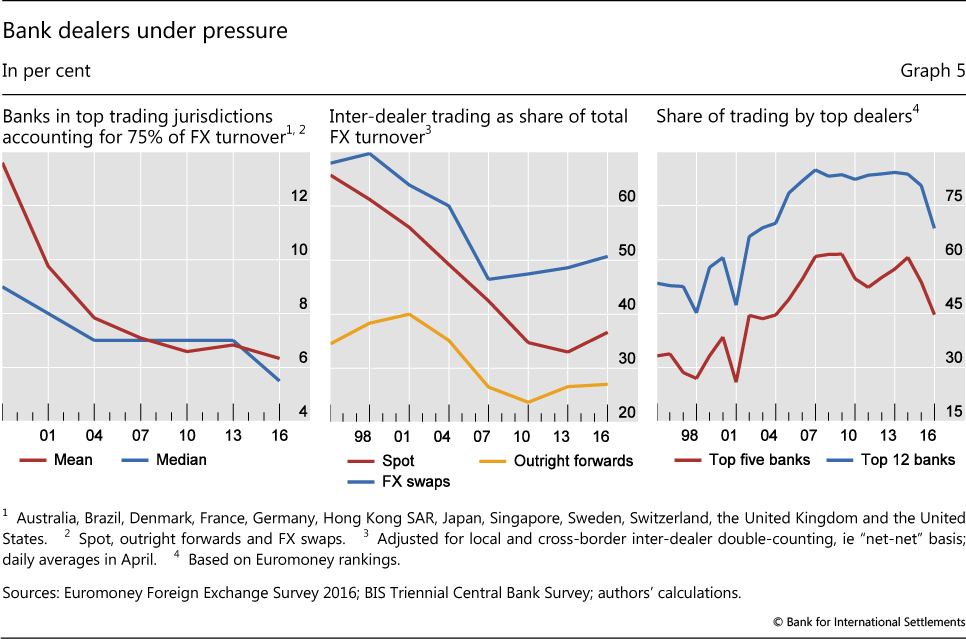
Recent survey data underline this increasing bifurcation. On the one hand, the number of banks accounting for 75% of FX turnover has declined further since the last Triennial (Graph 5, left-hand panel). On the other hand, the share of inter-dealer trading has picked up for the first time since the 1995 survey (Table 1 and Graph 5, centre panel). Taken together, these developments indicate that liquidity flows from a handful of top-tier FX dealer banks to the other banks.
This type of inter-dealer trading between core and periphery is very different from the classic "hot potato" trading of inventory imbalances, which used to be the main driver of trading growth among dealers. The hot potato trading of FX inventory imbalances, as described by Lyons (1997), Evans and Lyons (2002) and Killeen et al (2006), refers to dealer banks trading anonymously with each other via inter-dealer brokers (see below). Nowadays, major FX dealers can stream prices on secondary venues or respond to requests for quote from other banks.
Electronic non-bank market-makers emerge as liquidity providers
New technologies have enabled non-bank market participants to gain ground as market-makers and liquidity providers. While previously focused on HFT strategies, these electronic non-bank market-makers are becoming some of the largest liquidity providers on primary trading venues and have been making inroads in direct e-trading with customers.7 When non-banks appeared in the Euromoney magazine rankings for the first time this year, their share was already 6% of the market-maker segment. And, given that most non-bank market-makers do not disclose their trading volumes, their actual market share is probably higher. In contrast, the share of top dealer banks in total FX trading with clients fell sharply (Graph 5, right-hand panel).
Box C
How large are FX dealers' trade internalisation ratios?
Internalisation refers to the process whereby dealers seek to match staggered offsetting client flows on their own books instead of immediately hedging them in the inter-dealer market. Until now, solid data on this phenomenon have been scarce. Analysis has often relied on soft information obtained via market contacts. The 2016 Triennial aimed to address this information gap with a supplementary question on trade internalisation.
The bifurcation of liquidity provision described in the main text has meant that only a small number of bank dealers have retained a strong position as flow internalisers. This small set of global banks has increasingly faced competition from sophisticated technology-driven non-bank liquidity providers, some of which have also morphed into internalisers. As these large internalisers effectively become deep liquidity pools, their need to manage inventory via hot potato trading has fallen, contributing to a decline in turnover on venues such as EBS and Reuters. The declining share of inter-dealer trading observed between 1995 and 2013 (Graph 5, centre panel) has also been partly ascribed to a rise in trade internalisation. Yet while internalisation is known to have had a strong imprint on market structure, there have hardly been any numerical data on this crucial market phenomenon.
It is not surprising that, according to the Triennial, internalisation ratios are highest for spot, at 63% (Graph C, left-hand panel). Spot trading is the most standardised instrument and the segment of the foreign exchange market with the deepest penetration of electronic trading. However, these aggregate figures mask a high degree of heterogeneity across banks and jurisdictions. Internalisers with a large e-FX business can have much larger internalisation ratios (even above 90% in some major currency pairs). The extent to which the ability to internalise is a feature of large dealing banks can be gleaned by the much lower internalisation ratios when these are not weighted by reporting banks' trading volumes (left-hand and centre panels). While internalisation is most significant for spot, other important FX instruments also feature fairly high internalisation ratios (approximately 40% for both outright forwards and FX swaps).
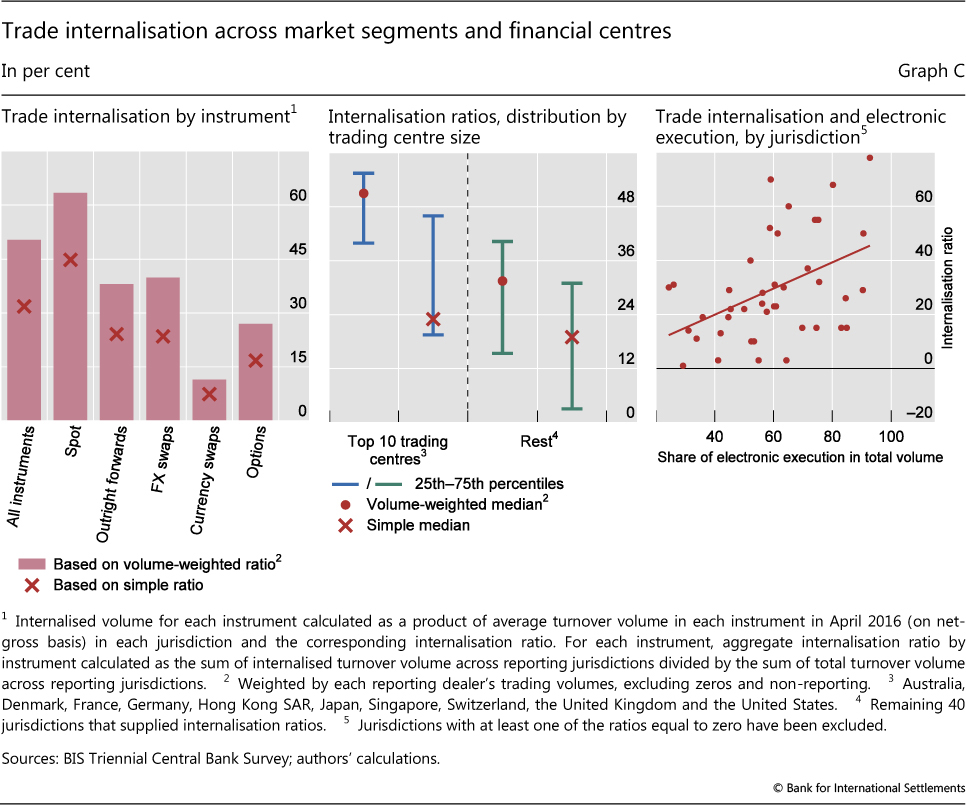
A locational breakdown suggests that internalisation ratios overall tend to be higher for larger FX trading centres (Graph C, centre panel). A large and diverse set of clients is key to a successful business model based on internalisation, and such a client base is most easily served via a major FX trading hub. From a risk management perspective, a business model based on internalisation is easier to operate when the bank's e-trading desk attracts a large client flow. Therefore, as one might expect, a cross-jurisdictional comparison shows that the internalisation ratio of FX dealers is positively correlated with the proliferation of e-trading (right-hand panel).
Bank and non-bank liquidity providers running an internalisation model benefit from access to large volumes of order flow originating from a diverse set of clients. Rather than immediately offloading inventory risk accumulated from a customer trade via the inter-dealer market, flow internalisers may hold open inventory positions for a short time (often not more than a few minutes) before matching against the flow of another customer. By internalising trades this way, they can benefit from the bid-ask spread without taking much risk, as offsetting customer flows come in almost continuously.
Non-bank electronic market-makers are a very diverse group. Some have a comparative advantage in internalising large volumes because of their presence across different markets. Such firms use algorithmic strategies to hedge their FX exposures with positions in other asset classes, such as futures. Others utilise sophisticated algorithmic strategies, mostly aimed at earning bid-ask spreads with minimal inventory risk. By pooling liquidity across clients and trading venues, the largest non-bank electronic market-makers can quote very tight bid-ask spreads in wholesale markets and even to end users. Non-bank liquidity providers have thus made a dent in what was traditionally the realm of dealer banks.
Shift towards relationship-driven electronic trading
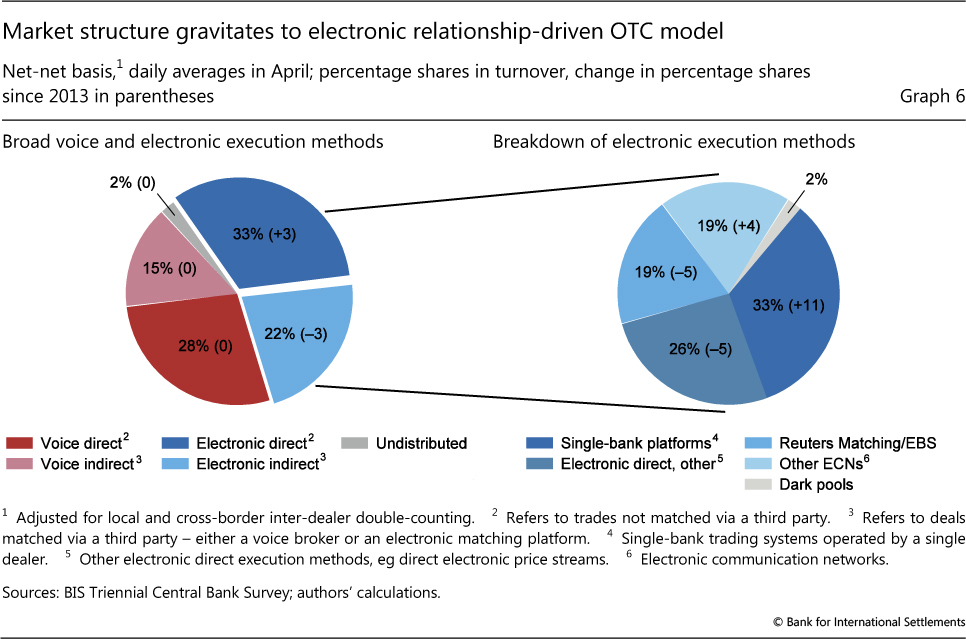
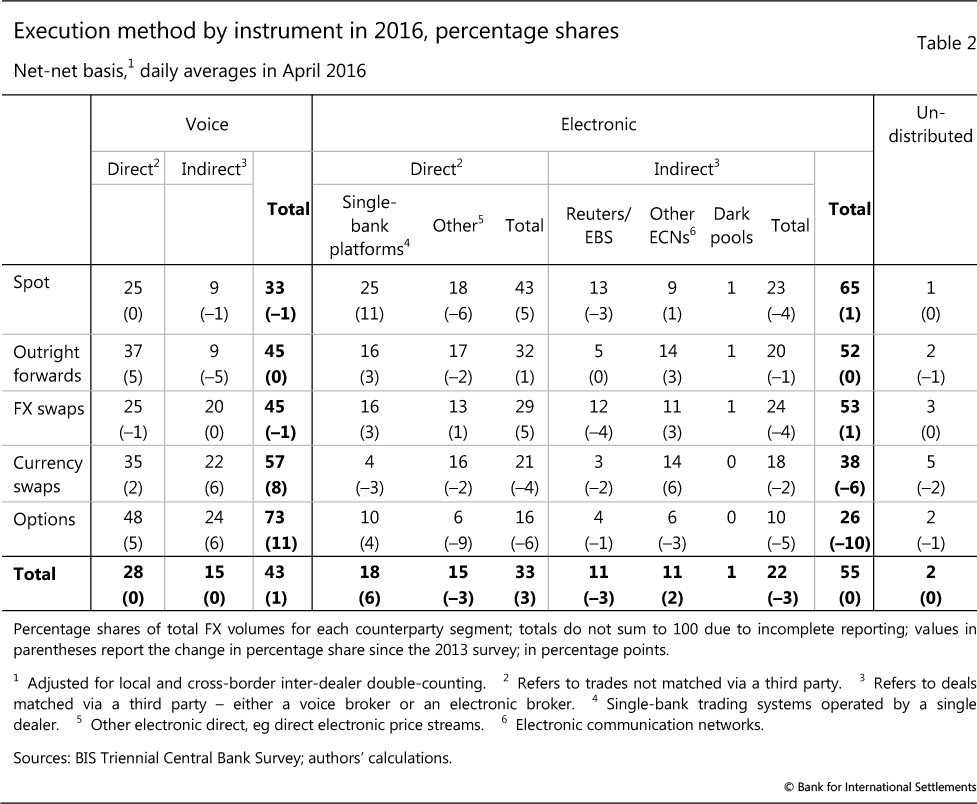
Changes in the composition of market participants, liquidity provision and risk-sharing in FX markets have gone hand in hand with changes in trade execution methods. The 2016 Triennial results suggest that the structure of FX markets may be slowly moving from anonymous trading towards a more relationship-based form of activity. The traditional over-the-counter (OTC) structure of the FX market has been fairly robust, albeit in a more sophisticated electronic form. Within the electronic trading landscape, there has been a notable shift from indirect electronic execution via multilateral trading platforms8 to direct (or bilateral) trading between a dealer and a counterparty (Graph 6, left-hand panel).9
Electronic relationship trading thrives
Dealer banks appear to have focused more on retaining a relationship-driven market structure, where bilateral OTC transactions dominate. Bilateral trading takes place primarily via proprietary single-bank trading platforms operated by FX dealing banks, or electronic price streams via application programming interface (API) connectivity.10 Clients, such as smaller regional banks, can obtain liquidity from global FX dealer banks and non-banks by directly receiving quotes via an API price stream.
The strong rise in direct electronic trading is thus mostly due to a 6% rise in the share of total FX trading via single-bank platforms (Graph 6, right-hand panel and Table 2). This reflects active competition by major FX dealer banks to attract buy-side customers to their platform. For example, the platforms of top dealer banks have been enhancing services such as cross-asset trading and pre- and post-trade analysis.
Major banks' investments in their single-dealer platforms support their position as liquidity providers and large trade flow internalisers (Box C). When providing liquidity to their customers via proprietary trading platforms or direct API streams, banks are often able to quote narrower spreads compared with those on anonymous primary electronic venues, such as EBS and Reuters, because of the lower risk for them of trading against a more informed counterparty.11 Moreover, banks are able to offer multiple price streams to different types of clients.12 This form of price discrimination allows them to extract higher rents from market-making and remain profitable as intermediaries.
In addition, FX volumes have also migrated to other electronic communication networks (ECNs), where dealers can stream prices or respond directly to clients using a request-for-quote (RFQ) protocol.13 Hence, other ECNs, which include multi-bank electronic trading platforms like Currenex, Hotspot and FXall, have seen their share edge up (Graph 6, right-hand panel, and Table 2). Such secondary multilateral trading venues are geared towards matching dealers and end clients, rather than engaging in inter-dealer hot potato trading, and allow certain aspects of relationship trading to be retained. Hence, their rise also goes hand in hand with the bifurcation of dealers' FX business models and the increase in trading with institutional investors.
Shift away from traditional anonymous trading venues
As the relationship-driven model of FX trading has thrived, trading on primary electronic venues has fallen. This is especially the case for platforms which rely on centralised limit order books (CLOBs) as their primary trading protocol, such as EBS and Reuters Matching (Table 2). As discussed above, traditional anonymous inter-dealer hot potato trading has been largely replaced by the flow of liquidity from the top dealer banks and non-bank market-makers to smaller dealer banks on ECNs that do not use CLOBs as a trading protocol.
Another factor which contributed to the decline of trading on primary electronic venues is the levelling-off of HFT, as EBS and other platforms have introduced "speed bumps" in the form of latency floors.14 In addition, as discussed above, bank prime brokerage for HFT firms has declined. Indeed, average trade size on institutional trading platforms has been relatively stable in recent years, indicating that automated trading has levelled off (Graph 7, left-hand panel). Data provided by EBS also point to a stagnation of automated trading over the past three years (Graph 7, centre panel). As noted above, a major exception is electronic market-makers; while CLOBs used to be their home turf, they have now also made inroads into direct electronic trading.
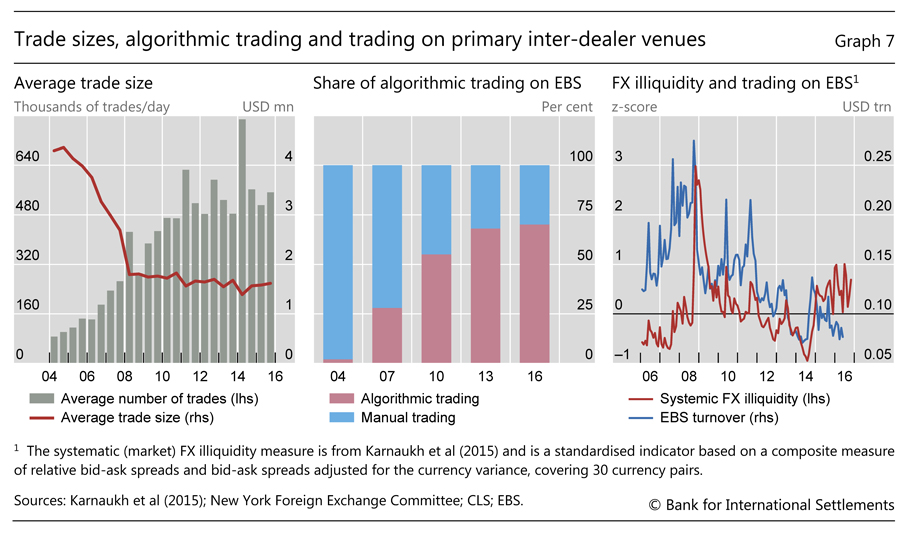
Nevertheless, traditional inter-dealer electronic trading venues continue to be vital to FX market functioning. First, electronic venues such as EBS and Reuters Matching play a key role in price discovery. According to market sources, EBS and Reuters Matching have remained the primary reference sources for benchmark pricing of major currency pairs. Second, multilateral trading platforms provide a crucial backstop when FX market conditions worsen. Specifically, FX trading volumes fall back onto CLOBs when volatility spikes or market liquidity deteriorates, as can be gleaned from the rise in trading on EBS when FX markets become less liquid (Graph 7, right-hand panel). This is because while dealers can internalise large FX flows and quote narrow spreads to their customers in good times, their need to hedge inventory risk on an anonymous basis in the inter-dealer market rises sharply in stress episodes.
Conclusion
This article explores the main drivers behind the fall in global FX volumes since the last Triennial Survey in 2013, discussing a number of structural changes in the market ecosystem as well as implications for market functioning.
The fall in global trade and gross capital flows in recent years partly explains why FX spot activity has fallen. Diverging monetary policies in major currency areas and the rise of long-term investors in FX markets have also played an important role. These factors have led to a rise in the volume of trading for hedging and liquidity management rather than for taking currency risk. The two main FX instruments, spot and FX swaps, have thus been pulled in different directions. Changes in FX market structures have also played an important role. The decline in prime brokerage has been associated with a fall in trading by hedge funds and principal trading firms, with spot market volumes contracting as a consequence.
In wholesale FX trading, a more pronounced bifurcation of liquidity provision can be observed among dealers. While some banks have successfully built a business model around client flow internalisation and warehousing risk, others merely act as a conduit by operating an agency model. In this environment, the electronic relationship-driven OTC model has thrived, whereas volumes on primary wholesale electronic trading venues have declined. In addition, bank dealers have been facing increased competition from electronic market-makers. Some of these technologically driven players have also emerged as flow internalisers, but the majority of non-bank market-makers often do not bring much risk absorption capacity to the market.
Such changes in the composition of market participants and their trading patterns may have implications for market functioning. While relationship-driven, direct dealer-customer trading on heterogeneous electronic trading venues delivers lower spreads in stable market conditions, its resilience to stress may be tested going forward. For example, non-bank market-makers may have higher exposure to correlation risk across asset classes. There are also indications of rising instances of volatility outburst and flash events. Tentative evidence suggests that market participants rush to traditional anonymous multilateral trading venues when market conditions deteriorate. Hence, the risk-sharing efficacy of the evolving FX market configuration is still uncertain. Any major changes to liquidity conditions might have consequences for market risk and the effectiveness of the hedging strategies of corporates, asset managers and other foreign exchange end users.
References
Bank for International Settlements (2016a): "Foreign exchange turnover in April 2016", Triennial Central Bank Survey of Foreign Exchange and Derivatives Market Activity, September.
--- (2016b): "Glossary", BIS Quarterly Review, December, pp 27-34.
Bech, M (2012): "FX volume during the financial crisis and now", BIS Quarterly Review, March, pp 33-43.
Bech, M, A Illes, U Lewrick and A Schrimpf (2016): "Hanging up the phone - electronic trading in fixed income markets and its implications", BIS Quarterly Review, March, pp 79-94.
Bech, M and J Sobrun (2013): "FX market trends before, between and beyond Triennial Surveys", BIS Quarterly Review, December, pp 45-54.
Borio, C, R McCauley, P McGuire and V Sushko (2016): "Covered interest parity lost: understanding the cross-currency basis", BIS Quarterly Review, September, pp 45-64.
Dunne, P, H Hau and M Moore (2015): "Dealer intermediation between markets", Journal of the European Economic Association, vol 13, no 5, pp 770-804.
Ehlers, T, F Packer and F Zhu (2016): "The changing landscape of renminbi offshore and onshore markets", BIS Quarterly Review, December, pp 72-3.
Evans, M and R Lyons (2002): "Order flow and exchange rate dynamics", Journal of Political Economy, vol 110, no 1.
Karnaukh, N, A Ranaldo and P Söderlind P (2015): "Understanding FX liquidity", Review of Financial Studies, vol 28, no 11, pp 3073-108.
Killeen, W, R Lyons and M Moore (2006): "Fixed versus flexible: lessons from EMS order flow", Journal of International Money and Finance, no 25, pp 551-79.
King, M and D Rime (2010): "The $4 trillion question: what explains FX growth since the 2007 survey?", BIS Quarterly Review, December, pp 27-42.
Lyons, R (1997): "A simultaneous trade model of the foreign exchange hot potato", Journal of International Economics, no 42, pp 275-98.
Markets Committee (2011): High-frequency trading in the foreign exchange market, September.
--- (2016): Electronic trading in fixed income markets, January.
McCauley, R and C Shu (2016): "Non-deliverable forwards: impact of currency internationalisation and derivatives reform", BIS Quarterly Review, December, pp 81-93.
Melvin, M and J Prins (2015): "Equity hedging and exchange rates at the London 4 p.m. fix", Journal of Financial Markets, no 22, pp 50-72.
Menkveld, A (2013): "High frequency trading and the new market makers", Journal of Financial Markets, vol 16, no 4, pp 712-40.
Michelberger, P and J Witte (2016): "Foreign exchange market microstructure and the WM/Reuters 4 pm fix", The Journal of Finance and Data Science, vol 2, no 1, pp 26-41.
Rime, D and A Schrimpf (2013): "The anatomy of the global FX market through the lens of the 2013 Triennial Survey", BIS Quarterly Review, December, pp 27-43.
1 The authors thank Claudio Borio, Alain Chaboud, Benjamin Cohen, Dietrich Domanski, Robert McCauley, Hyun Song Shin, Christian Upper, Philip Wooldridge and Laurence Wright for useful comments and suggestions. We are grateful to Angelo Ranaldo for sharing data on FX market liquidity. We also greatly appreciate the feedback and insightful discussions with numerous market participants at major FX dealing banks, buy-side institutions, electronic market-makers, retail brokers and electronic trading platforms. We are also grateful to Denis Pêtre and Tsvetana Spasova for compiling the underlying data and Amy Wood and Ingomar Krohn for excellent research assistance. The views expressed are those of the authors and do not necessarily reflect those of the BIS.
2 See BIS (2016a) for the preliminary statistical release of the 2016 Triennial results, including details of FX turnover across currency pairs, instruments, counterparties and trading locations.
3 For definitions of technical terms, see the glossary in BIS (2016b).
4 Global macro hedge funds have been faced with low FX volatility and an appreciation of typical carry trade funding currencies (that is, those with low interest rates), such as the Swiss franc and Japanese yen. At the same time, some traditional carry investments (high interest rate currencies such as the Australian dollar, as well as several EME currencies, such as the Mexican peso), have seen significant depreciation pressures.
5 See also Markets Committee (2011) for an analysis of HFT trading in FX markets and Markets Committee (2016) for a discussion of algorithmic trading in fixed income markets.
6 See Borio et al (2016) for an analysis of FX hedging demand and the cross-currency basis anomaly.
7 The diverse set of non-bank electronic market-makers includes XTX Markets, Virtu Financial, Citadel Securities, GTS and Jump Trading. These market-makers' trading volume is captured in the Triennial because their trades are prime-brokered by a dealer bank. They are active on multilateral trading platforms, where they provide prices to banks' e-trading desks, retail aggregators, hedge funds and institutional clients. According to market sources, the typical daily volume per individual firm is estimated to be in the vicinity of $10 billion - and up to $40 billion for the very top firms - with the highest concentration in spot trading.
8 One example is platforms such as Reuters Matching and EBS with centralised limit order books as the main trading protocol. Non-banks can also access these platforms via prime brokerage relationships. Another example are multi-dealer electronic communication networks (ECNs), allowing customers to trade directly with a range of dealers, using a suite of trading protocols, such as price streams from individual dealers or requests for quotes.
9 The continued resilience in voice trading even in spot markets suggests that market participants at times prefer to avoid primary electronic venues due to concerns about price impact and information leakage. Another way to minimise price impact when executing block trades and to avoid certain counterparties (eg HFT firms) is trading through dark pools - a category first introduced with the 2016 Triennial. Yet these accounted for a relatively minor part of FX activity in April 2016, with only some 2% of all electronic trades in 2016 being executed via dark pools.
10 Examples are Citi Velocity, JPMorgan's Morgan Markets, UBS Neo and Deutsche Bank's Autobahn.
11 Dunne et al (2015) shows similar inversion for trading in sovereign bond markets.
12 Price streams with "last look" tend to have the narrowest spreads, because they give the liquidity provider (under certain circumstances) the ability to reject an order even when it matches their price quote.
13 In response to the success of the electronic relationship-driven model of FX trading, platforms such as EBS have introduced new facilities to allow direct e-trading. Such facilities give participants alternatives to the traditional CLOB trading protocol. Driven by similar considerations, Thomson Reuters acquired FXall, a multi-bank trading platform based on the RFQ trading protocol.
14 In an attempt to insulate themselves from HFT, several large dealer banks were behind the April 2013 launch of the trading platform ParFX, which applied randomised pauses (measured in milliseconds), known as latency floors, to orders executed on the platform. EBS followed by introducing a latency floor on the AUD/USD pair in August 2013, and then extended it to a number of other currencies in the following months. Similarly, Reuters Matching introduced latency floors in 2014. However, it is also important to note that, in addition to these "speed bumps", trading platform providers have also been adjusting other parameters, including the granularity of pricing (measured in fractions of a pip) and minimum quote life.