Recent enhancements to the BIS statistics
The BIS regularly seeks to enhance its statistical offerings to support monetary and financial stability analysis, in close coordination with central banks and other national authorities and international organisations.
The exposure of economies to foreign currency risk is one potential source of vulnerability that has received increased attention in recent years, and the relevant data gaps are being addressed in the second phase of the Data Gaps Initiative (DGI) endorsed by the G20 (BIS-FSB-IMF (2015), FSB-IMF (2017)).
Concurrently with this issue of the Quarterly Review, the BIS is expanding the data it publishes on exchange rates, on the currency composition of cross-border positions and on foreign currency debt. Specifically, the BIS is introducing new statistics in the following areas:
- a currency breakdown of cross-border loans and deposits, from the BIS locational banking statistics (LBS);
- country-level estimates of total US dollar, euro and yen credit, as part of the BIS global liquidity indicators; and
- long time series on bilateral US dollar exchange rates for the currencies of approximately 190 economies.
The BIS also continues to enhance its data offerings and statistical tools in other areas. In particular, with the current issue the BIS is:
- introducing a data set of long time series on central bank policy rates, covering 37 countries plus the euro area, with data in some cases going back to 1946; and
- enhancing the tools provided on the BIS website for analysis of the LBS.
Locational banking statistics by currency and new web tools1
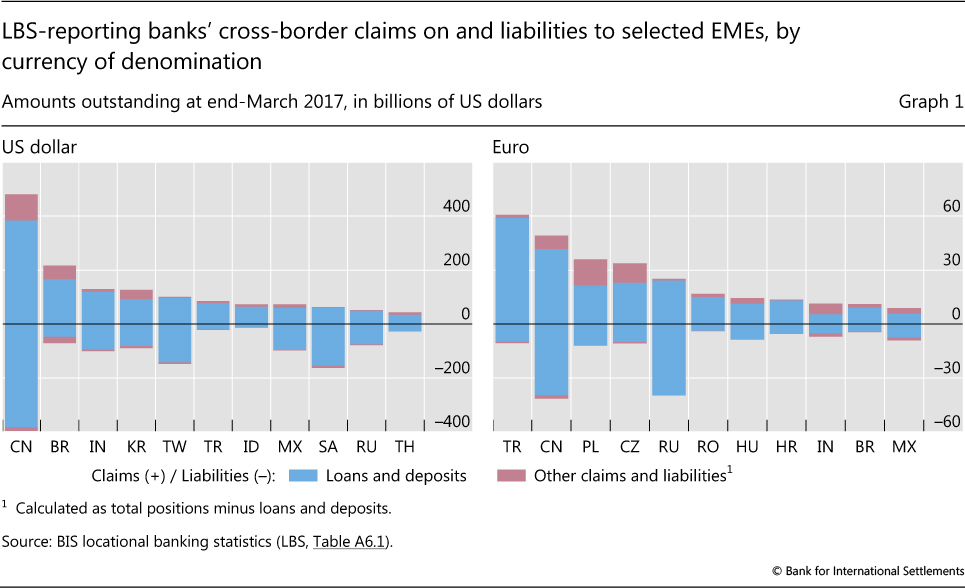
A unique feature of the LBS is their currency breakdown. Banks participating in the LBS report the currency in which their assets and liabilities are denominated, allocated into seven buckets: their domestic currency (ie that of the country where the bank is located), five major currencies (US dollar, euro, yen, sterling, Swiss franc), and a residual category for all other foreign currencies. The quality and completeness of these data were improved as part of the enhancements to the international banking statistics agreed by the Committee on the Global Financial System following the 2007-09 global financial crisis (Avdjiev et al (2015)).
With this issue of the Quarterly Review, the BIS is expanding the currency breakdown of banks' cross-border positions published in Table A6.1. Whereas previously the currency breakdown was published only for total cross-border assets and liabilities - loans and deposits, debt securities, derivatives and other instruments combined - it is now also published for banks' loans and deposits. These currency details are available for counterparties in over 200 countries, from Q4 1995 onwards, when loans and deposits were first reported separately from total assets and liabilities in the LBS.
Data about the currency denomination of loans and deposits are especially useful for analysing the foreign currency exposures of emerging market economies (EMEs). Bank loans can be added to debt securities to estimate the build-up of total foreign currency debt, as discussed in the next section. Funds deposited with banks abroad are also an important component of EME residents' foreign currency assets.2 Banks' US dollar- and euro-denominated claims and liabilities vis-à-vis a selection of EMEs are shown in Graph 1.
With the release of this Quarterly Review, the BIS is also implementing a number of other improvements intended to make the international banking statistics more accessible to users. First, users can now view and download breaks in series through the BIS Statistics Explorer. In the LBS and consolidated banking statistics (CBS), quarterly changes in amounts outstanding are affected by exchange rate movements as well as modifications to how the data are compiled. Such modifications arise from changes in methodology, reporting practices or reporting population and result in "breaks" in series across time. Breaks can be very large, such as in 2009 when US investment banks started to report the CBS after becoming bank holding companies (Avdjiev and Upper (2010)). In the LBS, the BIS estimates underlying flows by using the currency breakdown and breaks to adjust the quarterly changes. The size of these breaks is now shown alongside the published data on amounts outstanding and adjusted changes, confidentiality restrictions permitting.
Second, the BIS Statistics Explorer now includes annual growth rates. These are calculated from adjusted changes and so are not simple changes in amounts outstanding between t and t-4. Exchange rate- and break-adjusted changes are first used to calculate a quarterly growth rate, and then quarterly growth rates are compounded over four quarters to calculate an annual percentage change.3 Importantly, adjusted changes and annual percentage changes are calculated only for the LBS because a currency breakdown is not available for the CBS.
Finally, the matrix of creditor banking systems and borrower countries first published in September 2016 is being expanded and made available in a new table in the BIS Statistical Bulletin and BIS Statistics Explorer, Table A6.2.4 This new table shows the bilateral cross-border positions of banks located in up to 29 LBS-reporting countries against counterparties in more than 200 countries, with breakdowns by instrument (all instruments, loans and deposits) and sector (all sectors, non-bank sector). These geographical details can be used to analyse how shocks might propagate across borders and sectors (BIS (2016)).
Total US dollar, euro and yen credit by country5
Following up on work by the Committee on the Global Financial System (CGFS (2011)) to investigate the measurement, drivers and policy implications of global liquidity, the BIS estimates a set of global liquidity indicators (GLIs). The BIS GLIs combine BIS international banking and debt securities statistics with other data sets to provide various measures of the ease of global credit conditions.
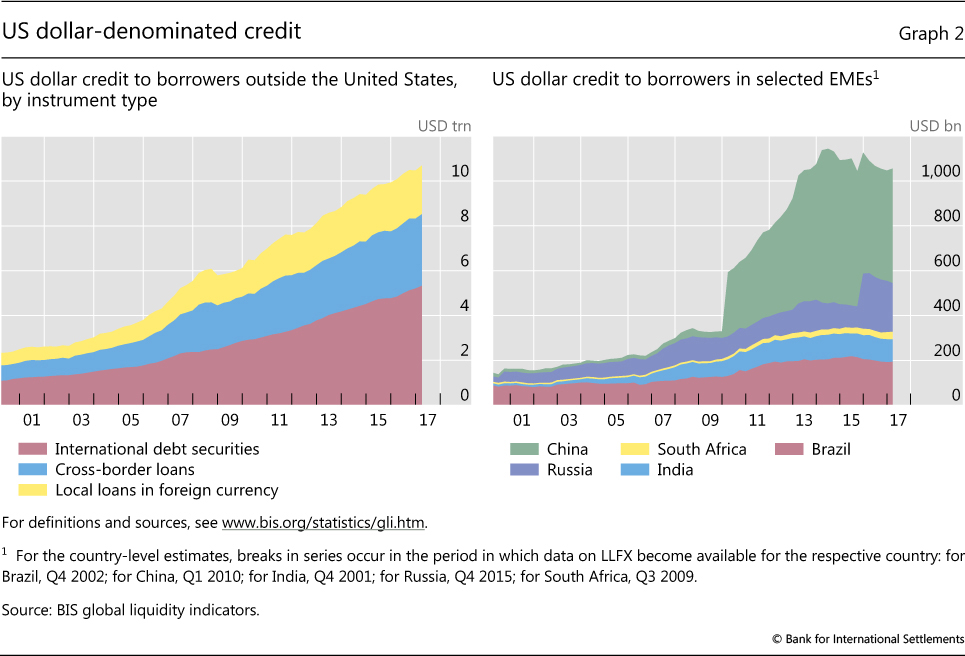
The most widely cited GLI is the BIS's estimates of total credit by currency of denomination, in particular total US dollar credit to non-bank borrowers residing outside the United States. Such credit grew rapidly in the years following the 2007-09 financial crisis, as shown in Graph 2. Previously, the BIS published estimates for US dollar, euro and yen credit to non-residents only at the global level and for four EME regions. To facilitate more in-depth analyses, the BIS is now publishing these foreign currency credit (FCC) estimates at the country level for 14 EMEs.
The country-level FCC estimates aim to provide a comprehensive measure of credit extended by bank and non-bank creditors to non-bank borrowers in a given country. They are constructed by combining data on three sources of foreign currency credit: international debt securities, cross-border bank loans, and local bank loans (Graph 2, left-hand panel). While international debt securities and cross-border bank loans are available for over 200 countries from the BIS international debt securities statistics and LBS, respectively, data on loans extended locally by banks in foreign currency (LLFX) are less readily available. The LBS represent a unique source in this respect, as they provide comparable data on LLFX with a currency, sector and instrument breakdown for most of the 46 reporting countries.6 For countries that do not report LLFX in the LBS, national data are sometimes available from other sources, though often without a currency breakdown (only all foreign currencies combined).
The availability of LLFX constrains the selection of country-level FCC estimates published by the BIS. Among the 14 jurisdictions selected, 11 report LLFX data in the LBS: Brazil, Chile, Chinese Taipei, India, Indonesia, Korea, Malaysia, Mexico, Russia, South Africa and Turkey.7 To boost global coverage, FCC estimates are also published for two non-LBS reporting countries, Argentina and Saudi Arabia, as well as for China, which is an LBS-reporting country but does not report LLFX data. For Argentina and China LLFX are approximated using national data, while for Saudi Arabia LLFX are not included in the FCC estimates. Collectively, the above 14 jurisdictions account for roughly two thirds of US dollar and yen credit to all EMEs and for slightly over half of euro credit to all EMEs.8
The FCC estimates can be used to analyse a number of important policy questions.9 First, they provide a key measure of the extent to which major global funding currencies - US dollar, euro and yen - are used beyond the borders of their respective home jurisdictions. Second, by gauging the foreign currency indebtedness of borrowers in a given country, they provide an indication of the degree to which the respective local economy is exposed to exchange rate fluctuations. Foreign currency lending often generates currency mismatches on borrowers' balance sheets. This leaves the borrowing economy vulnerable to currency fluctuations and, ultimately, allows financial conditions in the borrowing country to be affected by the decisions of the central banks in control of the major global funding currencies.
Despite the importance of foreign currency debt for financial stability, few countries publish comprehensive data. Therefore, the BIS FCC estimates fill an important data gap. National authorities are encouraged under the G20 DGI to disseminate the currency composition of international financial assets and liabilities in their external debt statistics and the international investment position (IIP). Few currently do, although improvements are being implemented.10
Furthermore, the external debt and IIP statistics have an important conceptual limitation: they focus exclusively on positions between residents and non-residents. As a consequence, they capture only exposures to counterparties located in other countries. However, the foreign currency exposures of the borrowers in a given country are not limited to their cross-border liabilities. Banks can extend locally booked loans denominated in a foreign currency, which would not be captured by residency-based statistics. Such foreign currency local positions can be quite substantial. As the left-hand panel of Graph 2 illustrates, locally extended loans make up about a quarter of total US dollar-denominated credit outside the United States.
That said, the BIS FCC estimates also have important limitations.
First, these indicators only capture the foreign currency liabilities of a given country. To accurately measure the overall currency mismatch of the borrowers in a given country, one should also take into account the foreign currency composition of the respective assets.
Second, the foreign currency composition of assets and liabilities does not necessarily equal a country's overall foreign currency exposure, as holdings of financial derivatives or hedging instruments can mitigate, amplify or transfer foreign currency exposures. It is therefore possible that, for some countries, the foreign currency amounts reported in the FCC series are not representative of actual exposures. For example, data from a 2013 foreign currency exposure survey by the Australian Bureau of Statistics show that hedging reduced the foreign currency liabilities of the private non-bank sector in Australia from 17% of GDP to 11% of GDP (Rush et al (2013)).
Third, the FCC estimates capture borrowing by the residents of a country rather than by its nationals. As a consequence, foreign currency debt incurred by offshore affiliates is not reallocated in the FCC estimates to the country in which the parent company is headquartered. This might underestimate FCC in EMEs, as they are increasingly using foreign affiliates to issue debt securities and then repatriating these funds back to their home country (Avdjiev et al (2014)).
Last but not least, debt denominated in foreign currencies may represent a relatively small share of total debt in some countries, such as China (Berger (2016)). Any assessment of its potential to influence the macroeconomic conditions should take this into account. FX credit developments thus need to be analysed in the context of the size and evolution of total credit.
Long series on US dollar bilateral nominal exchange rates11
The BIS nominal exchange rate data set contains USD exchange rates for the currencies of approximately 190 economies at daily, monthly, quarterly and annual frequencies. These exchange rate series, which draw on central bank data as well as other sources, are used for the calculation of the BIS nominal and real effective exchange rate series and as an input to the BIS International Banking and Financial Statistics. With this issue of the Quarterly Review, the BIS is now publishing these data on its website and will update the data set on a weekly basis.
While several institutions publish time series on exchange rates (some with a country coverage similar to the one of the BIS), the BIS data set is unique in several respects. First, it combines current and historical data in a single data set with the highest possible level of consistency and comparability across countries.12 Second, the time series are available in multiple frequencies. The data can be downloaded and visualised conveniently using the various BIS statistical tools on the website, such as the BIS Statistics Warehouse, BIS Statistics Explorer and full CSV files. Finally, the BIS has benefited from the background information provided by the central banks on their time series (specific measure or collection time).
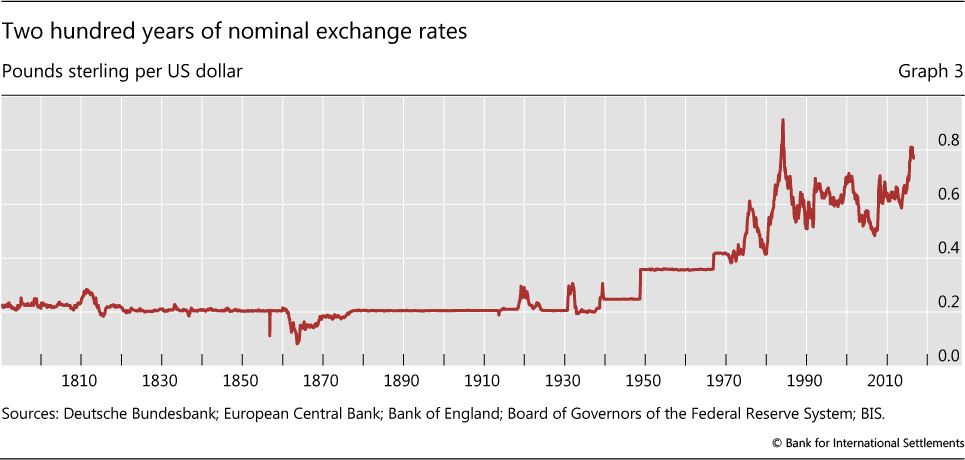
Daily data are available for 79 currencies. While the starting date of most daily series ranges from 1970 to 1995, series starting in the 1950s are available for 14 currencies. For lower frequencies, more historical data are available: the monthly, quarterly and annual series are substantially longer than the daily ones for several currencies. These time series are calculated as end-of-period figures or as averages over daily data, but extended backwards with the additional low-frequency historical data. Most monthly, quarterly and annual series start in 1957. The longest exchange rate series is for GBP/USD, for which monthly data are available starting in 1791 (Graph 3).
For the most recent periods, daily data from the ECB is the main source, complemented with data from the US Federal Reserve. Exchange rates are measured at 13:15 GMT for the ECB data and 17:00 GMT for the Federal Reserve. Using data mainly from these institutions, each of which supplies data on a large number of currencies, maximises comparability across countries in terms of quotation time and market. Data are taken from other BIS member central banks for periods for which no data from the ECB or the Federal Reserve are available. The Deutsche Bundesbank is a key source for historical data. The International Monetary Fund's International Financial Statistics is another source for historical information, as it includes monthly and quarterly exchange rates for 190 economies going back to the 1950s. The documentation of the BIS data set provides detailed information on the sources used for each currency and time period.
Long series on central bank policy rates13
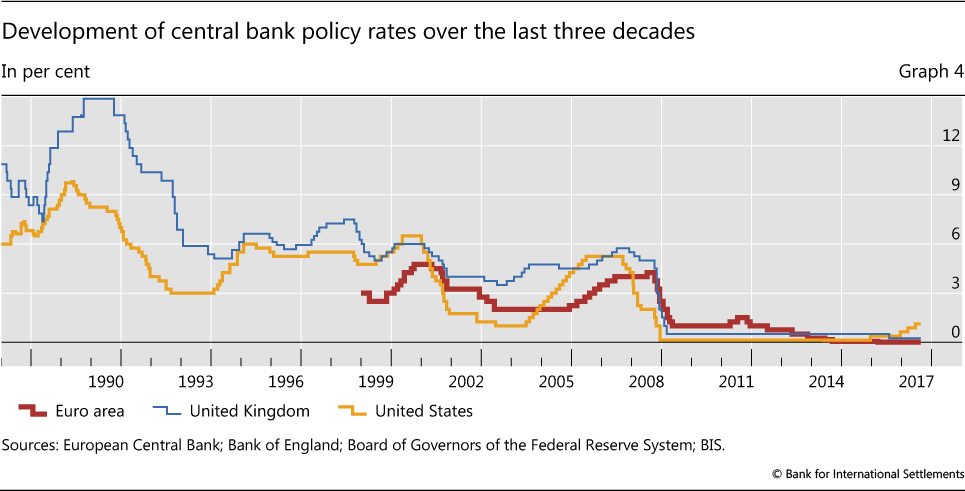
The BIS has already published time series on central bank policy rates for selected countries in its publications on an irregular basis (especially in its Annual Reports). Now, the BIS is releasing a data set on the monetary policy rates of 38 central banks (Graph 4). In undertaking this work, the BIS has collaborated closely with national central banks who participated in the selection of the policy rate(s). The data set also contains historical information on policy rates, going back to 1946 for several countries.14
The BIS data set is unique in three respects. First, this is the only data set containing both current and historical data for a large number of countries. Second, central banks informed the BIS on which interest rates to consider as policy rates. Third, as far as possible, the metadata contain information on the time lag between the announcement of the new rate and the day it becomes effective.
The BIS will update the data set once a week. Similarly to other BIS data sets, the policy rate series can be downloaded and visualised conveniently using the various BIS statistical tools on the website, such as the BIS Statistics Warehouse, BIS Statistics Explorer and full CSV files.
The data set presents the target or, when that is not available, the traded rate for the central bank's main policy instrument. Several central banks implement their monetary policy based on more than one interest rate. For central banks that communicate a target band, the middle of the band is shown unless the central bank has suggested that a different rate be shown. For central banks that changed their main policy instruments during the period covered in the data set, the BIS time series show the sequence of policy instruments used to conduct monetary policy in consecutive periods. The documentation identifies the breaks for all these time series.
The choice of interest rate to be shown in the data set is less obvious for periods when monetary policy was not conducted with an interest rate instrument - for example, under monetary base targeting. For those periods, the most widely referenced money market or central bank interest rate is taken. The documentation clearly highlights the interest rates selected for those periods.15
References
Avdjiev, S, M Chui and H S Shin (2014): "Non-financial corporations from emerging market economies and capital flows", BIS Quarterly Review, December, pp 67-77.
Avdjiev, S, P McGuire and P Wooldridge (2015): "Enhanced data to analyse international banking", BIS Quarterly Review, September, pp 53-68.
Avdjiev, S and C Upper (2010): "Impact of the reclassification of US investment banks", BIS Quarterly Review, March, p 19.
Berger, B (2016): "Debt-weighted exchange rate indices", BIS Quarterly Review, December, pp 100-2.
Bank for International Settlements (2016): "Recent enhancements to the BIS statistics", BIS Quarterly Review, September, pp 35-44.
Bank for International Settlements, Financial Stability Board and International Monetary Fund (2015): Work on foreign currency exposures, report to G20 Finance Ministers and Central Bank Governors, 25 August.
Blindsell, U (2014): Monetary policy operations and the financial system, Oxford University Press.
Borio, C (1997): "The implementation of monetary policy in industrial countries: a survey", BIS Economic Papers, no 47, August.
Borio, C and P Disyatat (2011): "Global imbalances and the financial crisis: link or no link?", BIS Working Papers, no 346, May.
Committee on the Global Financial System (2011): "Global liquidity - concepts, measurement and policy implications", CGFS Papers, no 45, December.
Financial Stability Board and International Monetary Fund (2017): The financial crisis and information gaps: Second phase of the G20 Data Gaps Initiative (DGI-2): Second progress report, September.
Markets Committee (2009): Monetary policy frameworks and central bank market operations (updated version), Bank for International Settlements, May.
McCauley, R, P McGuire and V Sushko (2015): "Global dollar credit: links to US monetary policy and leverage", Economic Policy, vol 30, no 82, pp 187-229.
Rey, H (2015): "Dilemma not trilemma: the global financial cycle and monetary policy independence", NBER Working Papers, no 21162.
Rush, A, D Sadeghian and M Wright (2013): "Foreign currency exposure and hedging in Australia", Reserve Bank of Australia, Bulletin, December.
Shin, H S (2016): "Global liquidity and procyclicality", speech at the World Bank conference on "The state of economics, the state of the world", Washington DC, 8 June.
Wooldridge, P (2006): "The changing composition of official reserves", BIS Quarterly Review, September, pp 25-38
1 This section was prepared by Pamela Pogliani and Philip Wooldridge.
2 In many EMEs, official reserves account for the largest share of deposits with banks abroad. Foreign currency assets held by sectors other than the central bank can be estimated by combining LBS-reporting banks' liabilities to the bank sector in a country with data from the IMF's reserve template on central banks' placements with commercial banks (Wooldridge (2006)).

4 These data, like all other data available in the BIS Statistical Bulletin and BIS Statistics Explorer, can also be downloaded from the BIS Statistics Warehouse or in a single CSV file.
5 This section was prepared by Stefan Avdjiev, Bat-el Berger and Can Yang.
6 Two LBS-reporting countries, China and the United States, do not report LLFX.
7 For the period prior to their becoming an LBS-reporting country, the BIS does not estimate LLFX for individual countries. Therefore, the FCC estimate jumps when LLFX are added. For details about the sources of data for LLFX, see the explanation on the GLI homepage.
8 As the availability of data on LLFX improves, the BIS plans to publish FCC estimates for additional countries.
9 For further discussion of the implication of foreign currency credit for financial stability, see Borio and Disyatat (2011), Rey (2015), McCauley et al (2015) and Shin (2016). For additional sources, see publications on the GLI homepage.
10 National data are available from the World Bank's Quarterly External Debt Statistics (QEDS) and, for IIP data, through the IMF's Special Data Dissemination Standard. As of mid-2017, only 17 countries provided a breakdown of external debt by currency in QEDS, in supplementary table 2.1, and even fewer the currency details requested in Tables A9-I to A9-II of the IIP.
11 This section was prepared by Lilian Arquete, Christian Dembiermont and Robert Szemere.
12 Some institutions publish current and historical time series in separate data sets. Other data sets cover exchange rates collected in various countries at various times of the day (sometimes in various time zones) or based on differing measures of the exchange rate (offer/bid/middle or transactions). The BIS addresses these issues by relying mainly on data of major central banks quoting exchange rates for a large number of currencies. However, for periods when data from these sources are not available, some of the above-mentioned cross-country inconsistencies are still present in the BIS data set.
13 This section was prepared by Christian Dembiermont and Robert Szemere.
14 To avoid breaks in series and facilitate users' data management, the BIS data build on a number of underlying series and therefore cannot be considered official national indicators.
15 See Borio (1997), Markets Committee (2009) and Blindsell (2014) on the complexity and diversity of monetary policy targets across central banks.