I. Sustaining stability amid uncertainty and fragmentation

- Chapter I: Data behind the graphs
- Press release: Trade tensions and uncertainty cloud global economy: BIS
Key takeaways
- The outlook for global growth deteriorated amid heightened uncertainty and the fraying of long-established economic ties. Financial markets experienced significant volatility in response to frequent, unpredictable trade policy announcements.
- The baseline outlook of soft economic growth and moderate inflation is clouded by heightened policy uncertainty, while existing vulnerabilities in the real economy and financial system have the potential to amplify the negative impact of shocks and adverse shifts in policy.
- Policymakers must act as a stabilising force by ensuring fiscal positions are sustainable, enhancing macro-financial resilience through a level playing field across different types of financial intermediation and prioritising price stability.
Introduction
The prospects for the global economy have become much more uncertain and unpredictable in recent months, marking a notable departure from the relative optimism of the previous year when a soft landing was in sight. Trade disruptions now threaten to reshape the global economic landscape, as long-standing political and economic relationships are being questioned. The new US trade policy, with its unknown eventual scope and impact, has elevated measures of economic uncertainty to levels typically associated with crises and sparked high volatility in financial markets. As a result, the outlook for global growth has been downgraded, with mixed implications for inflation across economies.
These developments are unfolding in a world already grappling with significant vulnerabilities. Trade-related challenges are likely to reinforce pre-existing shifts towards greater economic fragmentation and protectionism, further exacerbating the decade-long decline in economic and productivity growth across many economies. Coupled with ageing populations and emerging labour shortages, trade fragmentation could further reduce supply flexibility, leaving economies more prone to inflation pressures. Meanwhile, in several jurisdictions, high public debt makes the financial system vulnerable to interest rate rises, while reducing governments' ability to respond to adverse developments. Adding to these challenges, the shift of financial intermediation from banks to non-bank financial institutions (NBFIs) and towards financing public debt has heightened liquidity risks in bond markets, raising the potential for financial stability risks to emerge outside traditional banking systems.
Addressing these challenges requires efforts by policymakers on multiple fronts. Structural policy needs to address low productivity growth and improve the ability of the economy to scale up production and reallocate resources. The removal of barriers to trade, both within and across borders, would help offset the damage from the ongoing trade conflict. In addition to supporting structural reforms, fiscal policy needs to adjust to ensure debt sustainability and restore the space for supporting the economy when needed. The regulation and supervision of the financial system must take into account the shifting nature of financial risks arising from the structural changes in the financial system described in Chapter II of this report. In this context, there is a need for a consistent regulatory framework for banks and other financial intermediaries that pose similar risks to financial stability. Finally, for monetary policy, the experience of recent years has been a forceful reminder of the primacy of price stability as a cornerstone for sustainable growth. In an era of heightened uncertainty, preserving this anchor is more important than ever.
To succeed in these challenges, policy needs to be conducted with credible frameworks that deliver reasonable outcomes in a broad range of scenarios. Policymakers must set clear targets against which their policies can be assessed and select appropriate tools to achieve them. They need to clearly explain their actions and decisions to the public and be held accountable when things do not go to plan. Periodic reviews aimed at strengthening these frameworks can help to ensure they remain fit for purpose in the face of a changing environment. This steadfast commitment to the pursuit of their goals will foster society's trust in policymakers and institutions, ultimately enhancing the effectiveness of measures taken.
From soft landing to turbulence and uncertainty
The outlook for the global economy, which until early 2025 seemed on track for a soft landing, has been overshadowed by heightened uncertainty. In the second half of 2024, inflation was projected to converge to central bank targets alongside ongoing moderate economic growth. However, the global environment is now characterised by disruptions to trade and rising geopolitical tensions punctuated by periods of heightened financial market volatility.
The global economy was growing at a moderate rate ahead of the disruptions that have defined recent months. Global GDP growth was just over 3% in 2024, broadly in line with mid-2024 expectations (Graph 1).
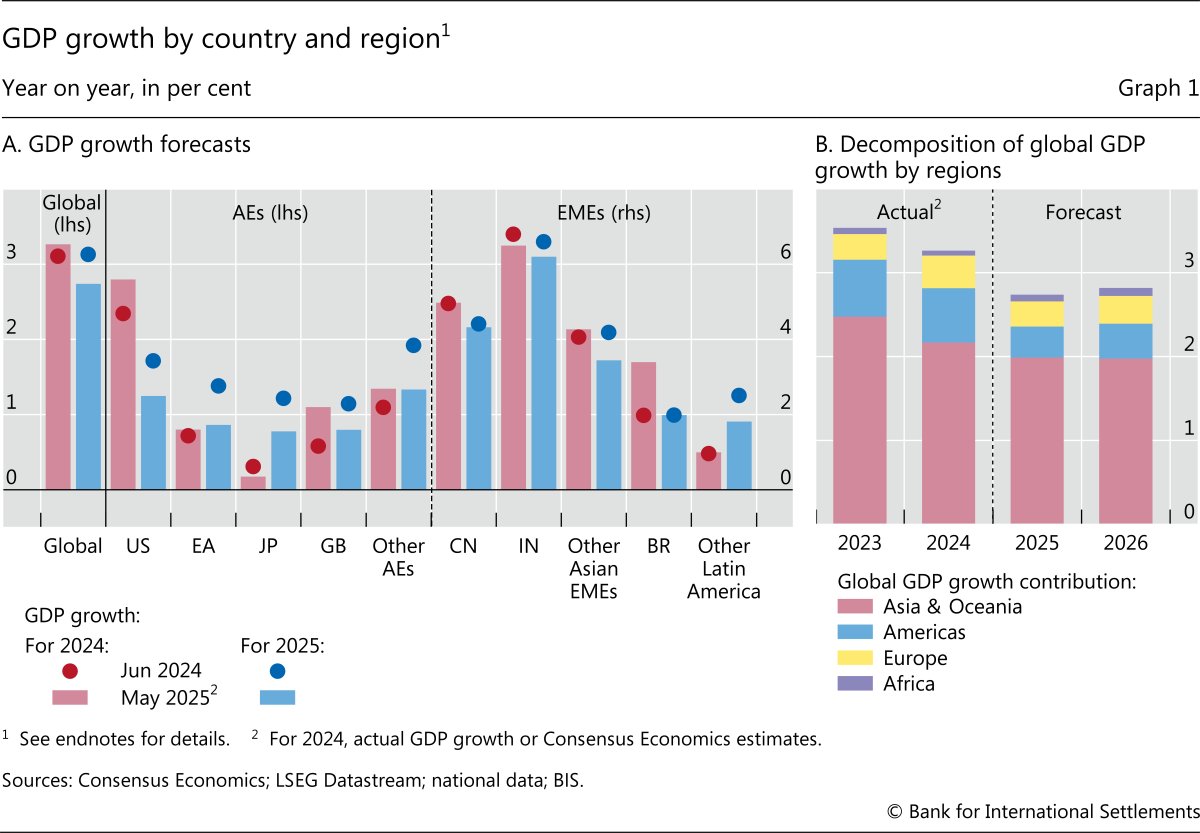
The stable aggregate outcome for global growth in 2024 masked significant differences across economies. The United States stood out as the strong performer among advanced economies (AEs), with economic growth in 2024 once again surprising to the upside. By contrast, growth in Europe and Japan was weak.
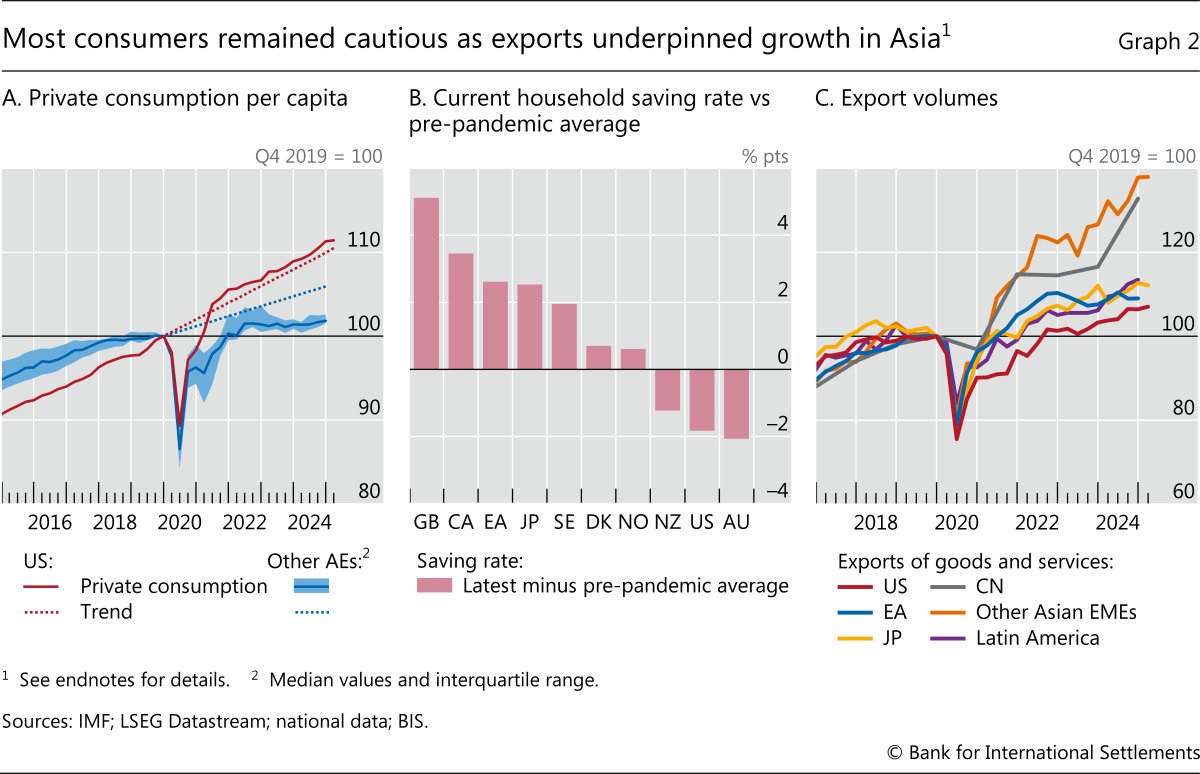
A key factor behind these differences was the resilience of the US consumer (Graph 2.A). Household consumption was above its pre-pandemic trend in the United States with a lower saving rate, while households in most other AEs were much more cautious, with saving rates typically well above their pre-pandemic level (Graph 2.B).
Economic trends in emerging market economies (EMEs) were also varied. In many East Asian economies, solid growth in export volumes helped offset weak domestic demand (Graph 2.C). In China, strong expansion in manufacturing output and exports enabled the country to achieve the authorities' GDP growth target of 5% for 2024, despite the ongoing adjustment in the property sector. Meanwhile, growth in India slowed, following an exceptionally strong performance after the pandemic. In Latin America, economic activity was generally subdued, except in Brazil where strong domestic demand was supported by a tight labour market and fiscal transfers.
Labour market conditions had largely normalised by the second half of 2024. While unemployment rates had increased relative to the very low levels reached in the immediate aftermath of the pandemic, they generally remained below pre-pandemic norms. As labour markets rebalanced, nominal wage growth generally eased but remained firmer than before the pandemic. One exception was Japan, where the growth rate of nominal wages continued to rise, reaching its highest level in decades.
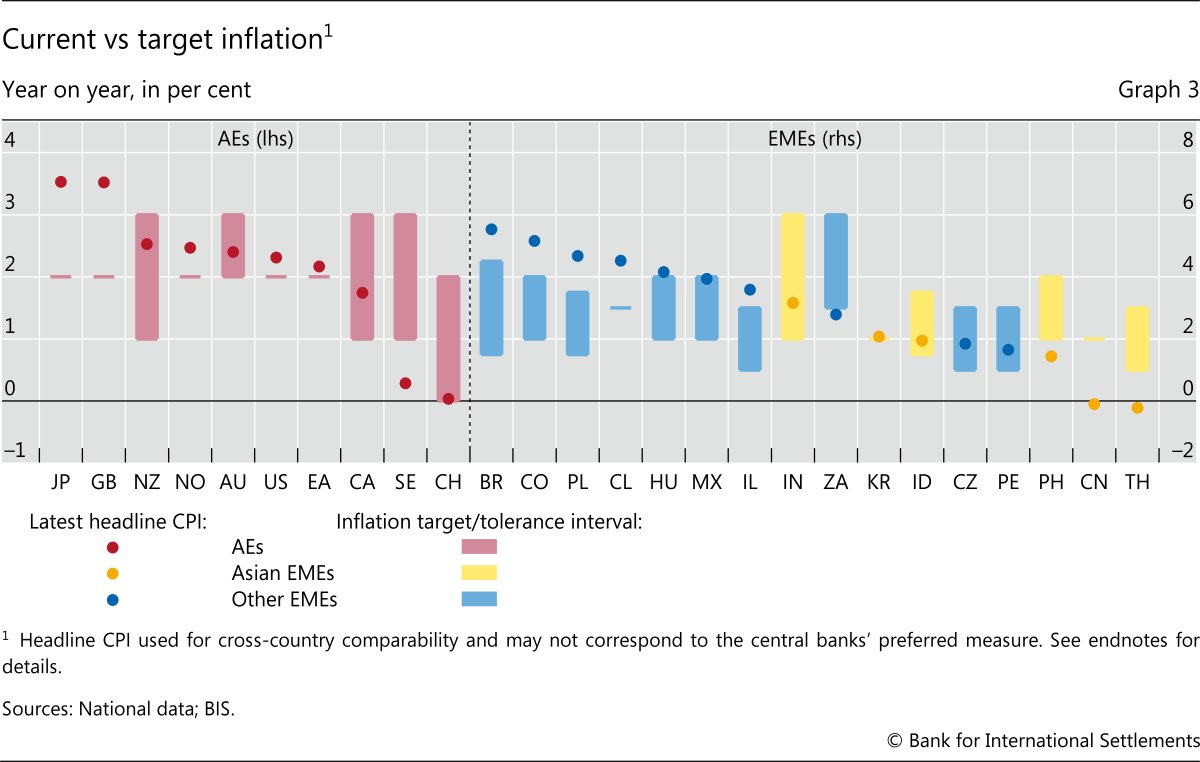
Inflation continued to ease, reaching or approaching central bank targets in most economies (Graph 3). However, progress towards target slowed in some Latin American economies, such as Brazil, Chile and Colombia, due to domestic drivers, including private demand, adjustments in regulated prices and exchange rate depreciations. By contrast, inflation was generally at or below target in East Asia, highlighted by the persistent very low rates of inflation in China.
With inflation reaching or approaching targets, most central banks eased monetary policy over the past year to support economic growth (Graph 4.A). Similarly, the People's Bank of China adjusted its stance from "prudent" to "moderately loose". Two key exceptions to this broad easing trend were the Central Bank of Brazil, which raised rates rapidly in response to evidence that inflation expectations were de-anchoring amid high inflation, and the Bank of Japan, which lifted its policy interest rate to 0.5%, a level last seen about two decades ago.
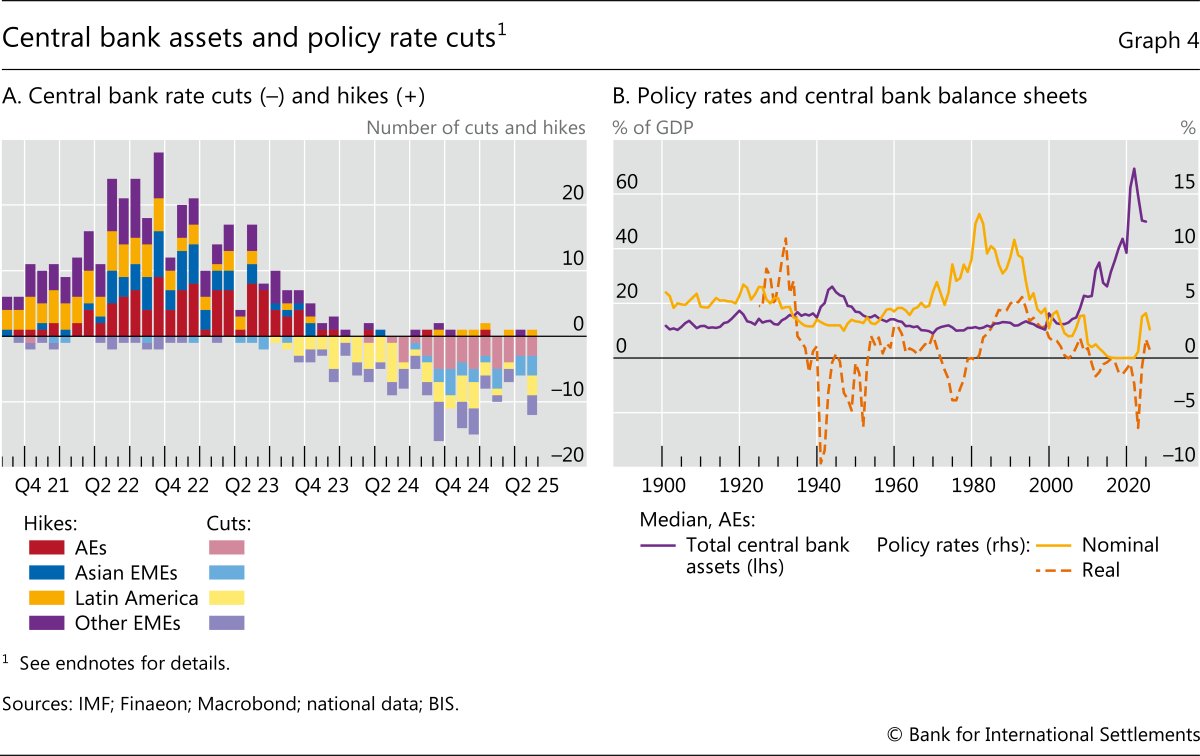
In addition to reducing policy rates, several AE central banks continued to shrink their balance sheets (Graph 4.B). This was primarily done by contracting their government bond portfolios, largely through the passive roll-off of maturing securities. This process has generally proceeded smoothly.
As the soft landing for the economy came into view, financial markets performed strongly through 2024 and early 2025. In the United States, equities rallied on the back of solid growth throughout 2024 as well as expectations of looser regulation and tax cuts from the incoming administration. Similarly, European equity markets surged in late 2024, driven by growing optimism, partly related to the improvement in banks' earnings. This optimism was further bolstered by news that Germany eased its constitutional debt brake for defence-related expenditure and also committed to spending €500 billion – more than 10% of its GDP – on infrastructure over the next 12 years. Consistent with the favourable backdrop for markets, credit spreads generally remained compressed by historical standards. Meanwhile, the US dollar appreciated against most currencies in the second half of 2024, reflecting the relatively strong economic fundamentals of the US economy. Only the muted outlook for EMEs and the sustained gold price rally were out of sync.
Trade policy takes centre stage
The relatively favourable global outlook of early 2025 was overshadowed by major policy shifts and heightened financial market volatility. The announcement of significant US tariffs on Canada and Mexico in January came as a surprise to many and was followed by a series of product- and country-specific tariff proposals over subsequent months, culminating in the announcement of broad-based tariffs on US imports from all trading partners in early April. This marked a watershed moment for the global economy, with the potential to weaken demand, disrupt global supply chains and destabilise the global trading system. The April proposals included "reciprocal" tariffs of at least 10% on almost all countries, with significantly higher rates targeting those with large bilateral trade surpluses. These measures raised fears of retaliation, which materialised as a cycle of escalation between the United States and China. Tariffs peaked at 145% on most US imports from China and 125% on most Chinese imports from the United States.
Subsequent developments saw the US administration scale back the size and scope of its tariff proposals, introducing temporary pauses, carve-outs for certain goods and modest trade deals with select partners. US–China tensions eased as tariff rates were temporarily reduced to allow for further negotiations, calming financial market fears and reducing downside risks to the global economy. Later, at the end of May, a US court ruling that struck down a substantial share of the tariffs imposed by the US administration under existing law cast new doubts on how tariffs would eventually be implemented. Given the frequent reversals, the risk of further escalation and legal challenges, as well as the lack of historical precedents for shifts of this magnitude, the broader impact of these policy changes remains uncertain.
Tariffs were accompanied by several other major policy changes in the United States that heightened concerns about policy direction and stability. The administration also introduced significant shifts in immigration, regulatory and fiscal policy, while doubts were raised about its commitment to central bank independence. Beyond the policy measures themselves, the repeated cycle of announcements, adjustments and reversals has fostered an atmosphere of uncertainty and volatility, compounding the challenges for the global economy.
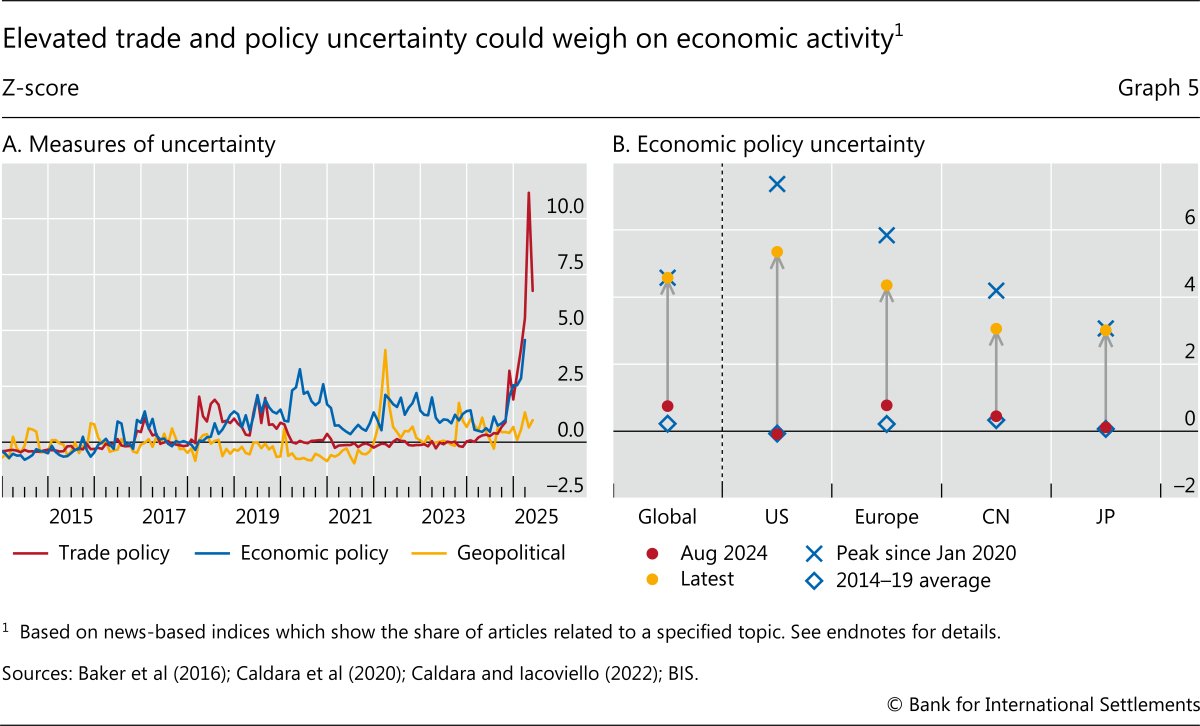
Common metrics of uncertainty have risen sharply. Trade policy uncertainty spiked to a record high in the first half of 2025 (Graph 5.A) and broader economic policy uncertainty also rose, albeit unevenly across regions (Graph 5.B). Moreover, the geopolitical landscape, with active conflicts on multiple continents, remains fertile ground for unpredictable events that could compound challenges from the ongoing trade tensions.
Frequent policy changes led to pronounced swings in financial markets
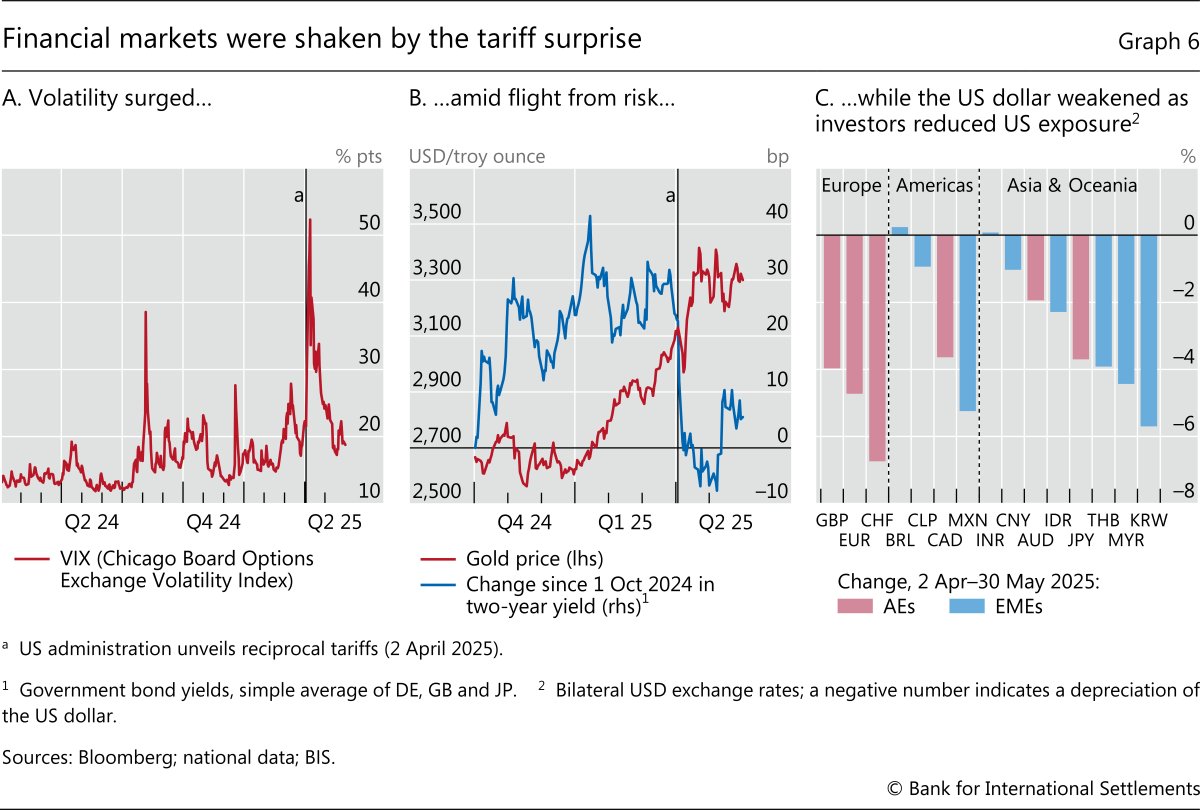
Global financial markets saw a dramatic escalation of volatility when the reciprocal tariffs announced in early April exceeded market expectations. With markets already on edge due to greater policy uncertainty, gauges of volatility surged to levels not seen since the pandemic, as investors scrambled to reduce risky exposures (Graph 6.A). Stock markets across the globe plunged and corporate credit spreads across the rating spectrum soared. As investors curbed US dollar exposures in April, safe haven flows accrued to gold and other major currency markets instead (Graph 6.B). Short-term yields in the euro area, Japan and the United Kingdom dropped swiftly, also driven in part by investors' anticipation of easing monetary policy (blue line). Long-term yields were less responsive, as investors appeared reluctant to increase duration risk exposure. This was particularly evident in US Treasury markets, with large price swings and an increase in long-term yields. Unusually for a risk-off episode, the US dollar depreciated against many currencies, particularly the euro, the yen and the Swiss franc, as investors proceeded to cover some of the currency risk of their US asset holdings (Graph 6.C).
As the larger proposed tariffs were walked back, financial markets stabilised and recovered. Measures of market volatility returned to the range observed in the second half of 2024. Equity markets rebounded, reaching fresh year-to-date highs in some jurisdictions. Credit spreads compressed again, particularly in the high-yield segment. Industrial metals rebounded to the range predating the tariff announcement. Oil prices initially stayed lower, weighed by large increases in supply, but subsequently increased as geopolitical tensions intensified in June. The US dollar, however, traded at the bottom of the range observed since the start of the tightening period in early 2022. And long-term yields in the United States and some other major markets have trended higher over recent months, consistent with growing investor concerns about fiscal sustainability.
The economic impact of tariffs and uncertainty was initially evident in a range of timely survey data, showing a significant deterioration in household and business sentiment, particularly in the United States. By contrast, the effect on conventional statistics – or hard data – has taken more time to emerge and has provided a mixed reading on the economy to date. Some indicators were boosted by the pull forward of spending to beat the imposition of tariffs. The associated variability in these hard data, highlighted by examples such as the contraction in US GDP in the first quarter, made the underlying trend in many economies difficult to distil. Lagging indicators, such as those from the labour market, generally remained firm.
Tariffs and uncertainty have overshadowed the economic outlook
The effects of recent policy developments are expected to have a material impact on the economic outlook. In assessing the economic effects of tariffs several channels are key, from the direct impact of the tariffs on the economy and the implications for supply chains, to the indirect effects associated with the reaction of financial markets and other policy responses. Yet assessing the strength of these channels is difficult, not only because of continuous shifts in policy but also because of the practical and legal complexity of enforcing them, as well as the lack of recent precedents to assess their effects. The related effects of policy uncertainty may add to the drag on the economy, even if trade negotiations are successful.
Consider first the impact of tariffs and their key transmission channels. Increased tariffs are a negative supply shock in imposing countries, reducing output and increasing prices. By making imported goods more expensive, tariffs erode real incomes, in turn reducing demand for imported and domestic goods. While higher import prices may encourage substitution towards domestically produced goods, potentially boosting output in protected industries, empirical evidence suggests that this effect is limited. Importantly, this substitution often comes at the cost of efficiency, as capital and labour are redirected towards less competitive firms and sectors. Furthermore, while tariffs lead to changes in gross import and export flows, they barely affect net trade flows (see Box A).
Tariffs tend to act as a negative demand shock for targeted countries, primarily by lowering exports. Their impact on activity will depend on the strength of trade links, along with the scope to redirect exports to other markets. At the same time, their disinflationary impact will hinge not only on domestic slack but also on the potential increased supply of goods diverted from tariff-imposing countries. In the case of US tariffs, economic output in countries such as Mexico and Canada is likely to be among the largest affected, while the effects on European economies are expected to be smaller.
Further to the direct effects on individual economies, the introduction of higher tariffs could impose adjustment costs on the global economy as trade overall becomes less efficient. As supply chains adjust, there is the potential for significant disruptions to trade and temporary shortages of some goods. As witnessed during the pandemic, such disruptions can have significant and long-lasting ramifications for production and prices across the economy. Additionally, the effects of tariffs will be greatly influenced by the adjustment in monetary and fiscal policies as well as shifts in financial market conditions, including changes in nominal exchange rates. Such effects could be further amplified by existing vulnerabilities (discussed below).
Until greater clarity emerges regarding the scope and coverage of the new tariffs, uncertainty is likely to remain one of the dominant factors shaping the near-term outlook. Evidence suggests that some firms anticipated the potential turbulence ahead, increasing credit lines towards the end of 2024 (Graph 7.A). The increase was most pronounced for firms in sectors exposed to trade policy changes.
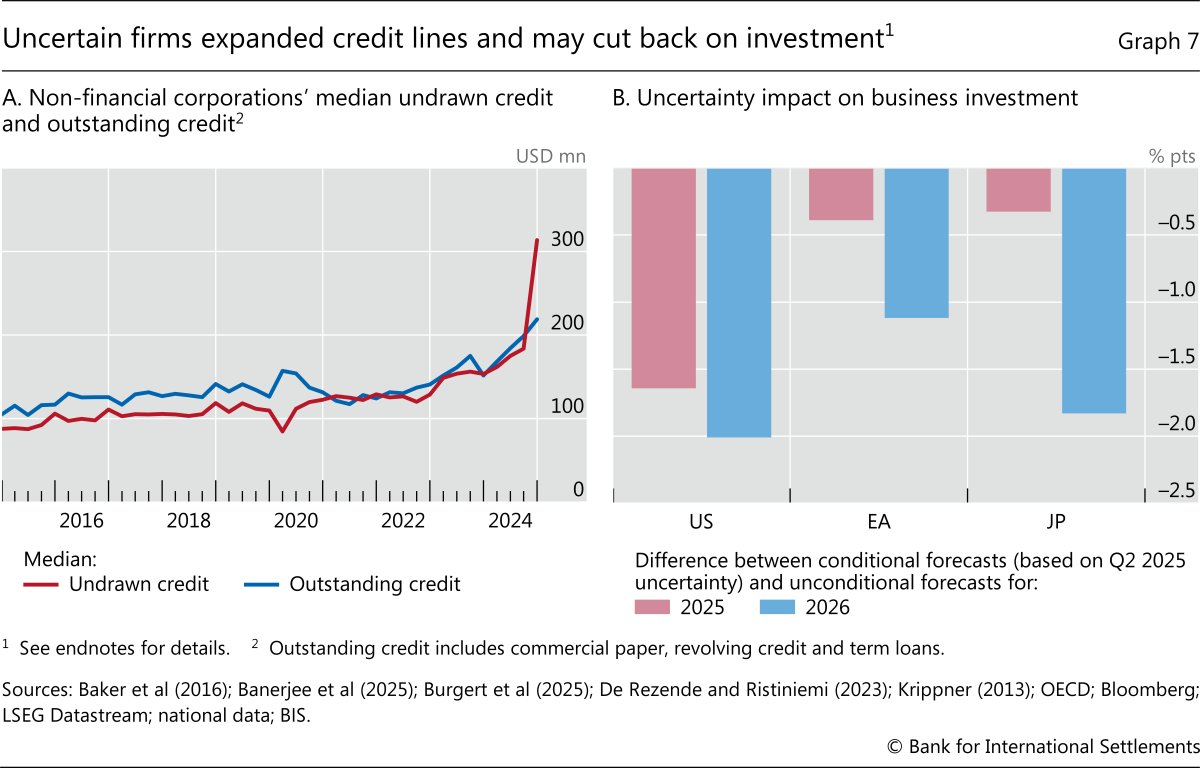
The effects of uncertainty alone could have a major impact on the near-term economic outlook through several channels. For one, heightened uncertainty may lead firms to adopt a more cautious approach to investment and hiring because these decisions could be very costly to reverse. Likewise, consumers may choose to postpone durable goods purchases and increase savings as a precautionary measure. At the same time, elevated uncertainty might also increase the cost of external finance because of greater caution by lenders, further discouraging investment. Consistent with these channels, increases in measures of uncertainty have typically been followed by weaker economic activity and particularly business investment. Estimates suggest a substantial negative contribution of the recent increase in uncertainty on business investment in 2025 and 2026 (Graph 7.B).1
Policymakers have responded to the shifting economic and geopolitical landscape. For example, the Canadian government has introduced a range of economic support programmes to help businesses and workers directly impacted by US tariffs. Authorities in China have announced fiscal support aimed at boosting consumer demand and infrastructure investment. Meanwhile, the European Central Bank, the People's Bank of China, the Bank of Mexico and the Bank of Thailand were among many central banks that cut their policy rates in recent months, citing growth risks from trade and uncertainty. Market pricing suggests central banks will provide additional support in the period ahead. Among the major economy central banks, further easing is expected by the Federal Reserve and European Central Bank. The Bank of Japan is expected to lift rates more gradually than previously projected.
Consensus forecasts for GDP growth have been revised lower as the direct and indirect impacts of the trade conflict have been factored in. Global growth is now expected to be 2.7% in 2025 and only a little firmer in 2026. These forecasts are around a quarter percentage point lower than expectations at the start of 2025. The most significant downward revisions have been observed in North America and parts of East Asia. Growth in the United States was downgraded by around 1 percentage point relative to expectations at the beginning of 2025 along with similar downgrades to growth in Mexico and Canada, which both have the United States as their largest trading partner. Elsewhere, the near-term outlook for GDP growth is generally somewhat weaker relative to expectations at the start of 2025.
The net effects of lower growth and trade policy changes on inflation vary by economy, particularly in the near term. In the United States, the cumulative effect of broad-based tariffs is expected to lead to a large increase in the price level over coming months. However, inflation is projected to ease in 2026, as weakness in the domestic economy weighs on price growth. The inflationary impact of the US tariffs for many other economies is generally expected to be small but will depend on the interaction of trade policy responses such as retaliatory measures, the redirection of trade flows and currency movements. Combined with the associated slowdown in global growth due to the trade frictions, the outlook for inflation has been revised a little lower for many economies.
Vulnerabilities on the path ahead
The existence of multiple vulnerabilities magnifies the risks to the global outlook. These fall into three broad categories. The first pertains to the real economy. Potential growth has been steadily declining for decades in many economies, while supply capacity is also becoming less flexible. Moreover, the pandemic-era surge in inflation may have heightened households' and firms' sensitivity to future inflation. Second, public debt has reached unprecedented levels in many countries. As a result, risks to inflation and financial stability can more easily originate from or be propagated through stress in sovereign bond markets. Finally, credit and liquidity risks have grown in parts of the non-bank financial sector, with implications for banks as well as the functioning of key financial markets. This section considers each of these vulnerabilities in turn.
Real vulnerabilities
The global economy faces a combination of long-standing and emerging structural problems. A major issue is the decades-long decline in economic growth, a trend evident in many AEs and, more recently, in several EMEs (Graph 8.A). Slower growth not only limits improvements in living standards but also delays recovery from recessions, undermines debt sustainability and heightens risks to macroeconomic and financial stability. In addition, with population ageing and globalisation slowing, many economies are now beginning to grapple with a less responsive supply, which could make inflation more sensitive to output changes.
Consider lower trend economic growth first. In many AEs, productivity growth had been on a downward trend for decades.2 This decline partly reflects diminishing productivity gains from new technologies. At the same time, the timeline for realising the full benefits of emerging technologies, including generative artificial intelligence (AI), remains uncertain. Adding to these challenges, population ageing means that most AEs can no longer count on the domestic labour force expanding (Graph 8.B).
A similar growth slowdown is now also evident in many EMEs. After benefiting from catch-up growth, convergence with their AE counterparts has slowed, with many EMEs now beginning to face challenges similar to those of AEs, including ageing populations. Additionally, several of these EMEs remain highly reliant on foreign direct investment (FDI) for technology diffusion and, especially in Asia, on export-led growth.
That said, policy retains a crucial role in shaping long-term growth. Across many economies, including the most dynamic ones, the slowdown in productivity growth has been accompanied by weaker business dynamism – as shown in several countries by declining rates of business formation, expansion and exit – and lower allocative efficiency, as seen in greater dispersion of firms' productivity outcomes.3 These declines stem from multiple causes that vary by country but often include insufficient competition, regulatory complexity, rigid labour markets, and high energy and logistics costs from inadequate infrastructure.4,5
Against this backdrop, globalisation has been a vital force in sustaining income growth, countering other factors that have weighed on it. The integration of trade and capital flows has fostered greater specialisation, improved capital allocation and enhanced competition. It has also greatly facilitated technological diffusion through FDI, especially among EMEs.6,7
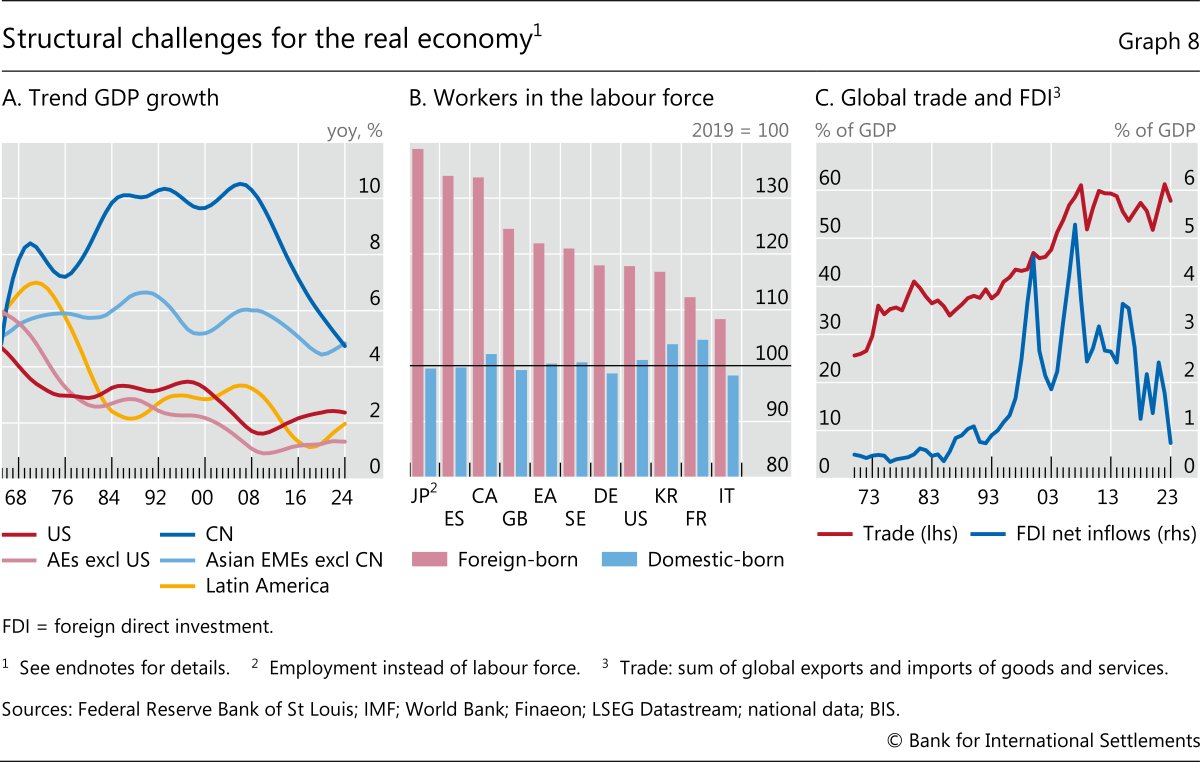
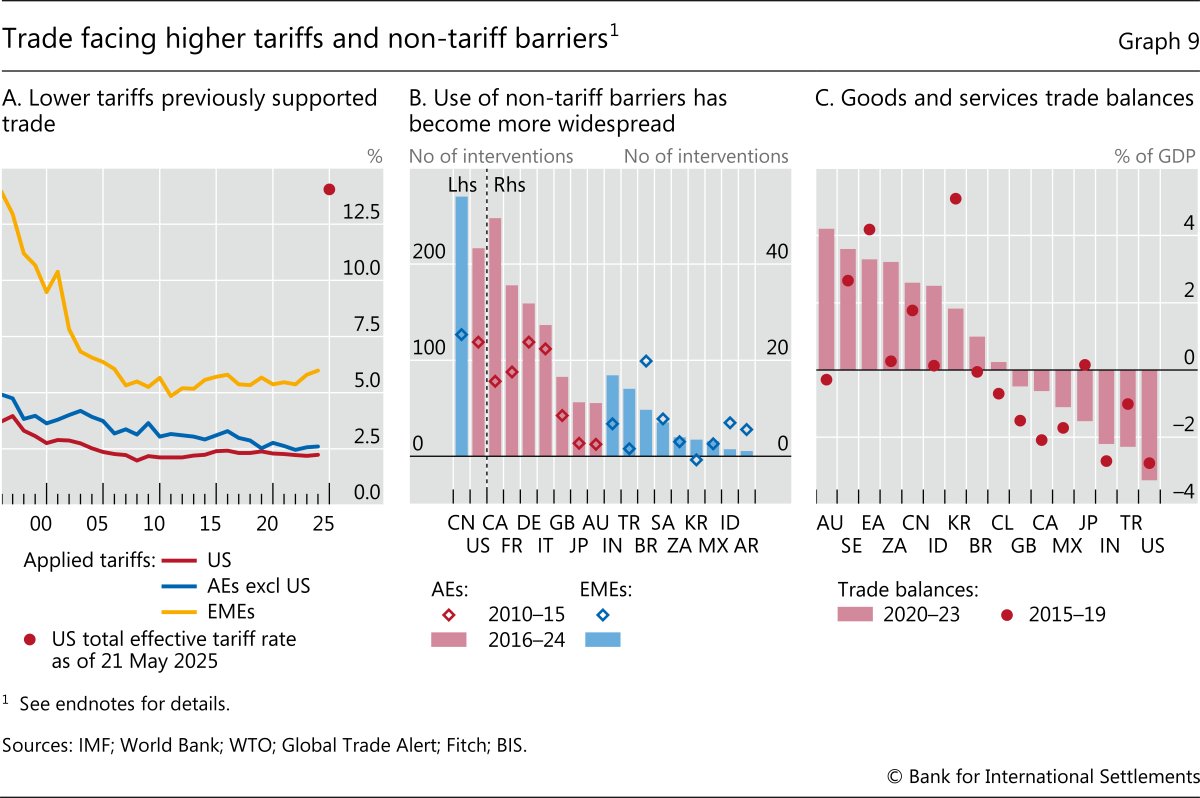
Yet these benefits are increasingly under threat from escalating trade and geopolitical tensions. Even before recent US tariff announcements, growth in global trade had slowed considerably and FDI had been falling following the Great Financial Crisis (GFC) (Graph 8.C; see Box B). To be sure, these trends partly reflect the maturity of global value chains, as well as the growth slowdown in China and other major EMEs. The benefits from earlier reductions in tariffs had waned, while non-tariff barriers and industrial policy measures had also been increasing, especially in AEs (Graphs 9.A and 9.B). This has coincided with a rise in protectionist sentiment, especially in countries with persistent trade deficits, fuelled by concerns over rising income inequality and job losses (Graph 9.C). The imposition of substantial trade tariffs by the United States marked a further intensification of these trends.
Broad-based import tariffs are, however, unlikely to address these concerns effectively. In countries imposing them, such tariffs risk lowering overall living standards and reducing employment, even in sectors competing with imports.8 Instead, if the objective is to reduce trade imbalances, a more effective approach involves the adoption of appropriate fiscal and structural policies, including policies that help displaced workers to find jobs in other sectors (see Box A).
Recent structural developments not only exacerbate long-standing factors that limit trend growth but also reduce the economy's supply flexibility in responding to shocks. For instance, demographic shifts are contributing to labour shortages in several economies and a more inelastic labour supply. In many cases, reliance on foreign-born workers has been the only factor preventing outright declines in labour forces as older workers retire (see Graph 8.B). In less globally integrated goods markets, firms may face higher costs when expanding output, constrained by limited access to intermediate products, weaker competition and more rigid supply chains. Market rigidities that hinder resource allocation may further constrain firms' ability to adapt to shifts in demand. As a result, many economies might today face a steeper Phillips curve than in recent decades, with changes in output translating into larger changes in inflation.9
In addition, inflation expectations may have become less stable. Having been caught by surprise by the inflation surge during the pandemic recovery, business and household expectations of inflation are likely to react more quickly to future price increases. Indeed, recent surveys show that households' inflation expectations for the year ahead are closely related to their perception of the increase in the price level over the past five years. This link is stronger today than it was pre-pandemic (see Box C). As a result, the risk that inflation expectations could become unmoored seems greater post-pandemic.10,11
Compounding these challenges is the increased likelihood that the economic landscape will face more frequent, intense and persistent adverse supply shocks. Key drivers of these shocks include climate change, with its extreme weather events, and geopolitical tensions, with their potential to disrupt commodity markets and value chains. Overall, inflation may be subject to more frequent and persistent deviations from targets in the future as economic activity suffers, making the conduct of monetary policy more challenging.
Fiscal vulnerabilities
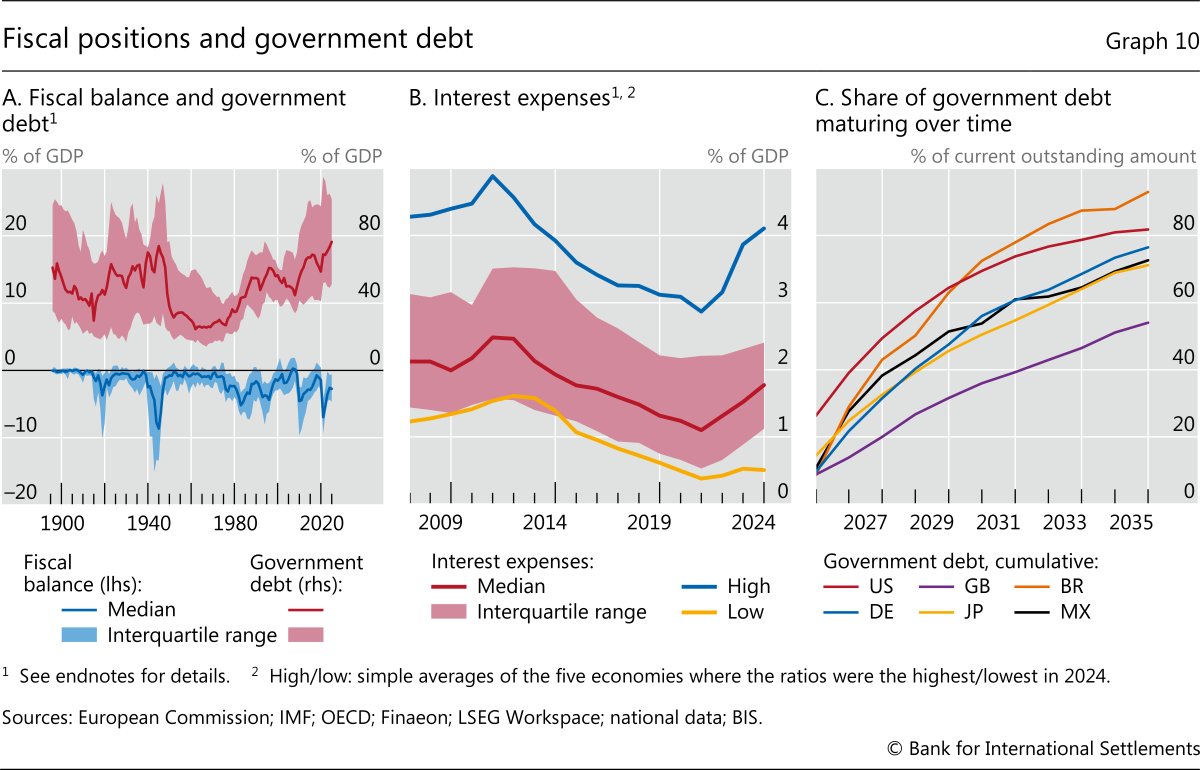
The GFC and the pandemic have left many economies with higher public debt and large fiscal deficits, with debt levels in many cases reaching historic peacetime highs (Graph 10.A). These levels are projected to rise further, as deficits – which were 6–7% of GDP in several major economies in 2024 – are expected to close only partially or at a slow pace in the coming years. Debt levels will also face upward pressure from population ageing, which drives up pension and healthcare costs, as well as from emerging demands such as infrastructure investment, the transition to greener energy and growing defence needs. Furthermore, limited tolerance for further erosion in real incomes among households could lead to more immediate demands for compensation via fiscal support in the event of future shocks.
While higher public debt levels can be sustainable in the presence of strong income growth and low interest rates, current and future conditions look less favourable. As noted above, economic growth is expected to remain subdued for the foreseeable future. Moreover, interest rates may not return to the low levels observed in the pre-pandemic decade. Indeed, current interest rates are already putting pressure on fiscal accounts. For instance, among Organisation for Economic Co-operation and Development (OECD) countries with relatively high interest payments, average payments have risen from 3% of GDP in 2021 to more than 4% in 2024 (Graph 10.B), and they are projected to increase further, even if rates remain unchanged, as several countries are set to refinance up to half their public debt stock within the next two years (Graph 10.C). A significant risk for debt sustainability is that bond yields could rise even higher, especially if inflation were to prove more volatile and persistent or if governments delay tackling large fiscal deficits.
These risks could be compounded by shifts in the investor base. In major economies, the reduction in central bank holdings of government securities – as central banks unwind their quantitative easing programmes – tilts the supply-demand imbalance in sovereign markets, putting upward pressure on yields through term premia. Such reduction has already led to some widening in term premia from the lows seen in the aftermath of the GFC and the pandemic, as private investors stepped in to fill the gap (Graph 11.A). For example, the Federal Reserve's $1½ trillion reduction in Treasury holdings since mid-2022 is estimated to have increased long-term yields by around 80 basis points, reversing around two thirds of the estimated impact of quantitative easing during the pandemic.12
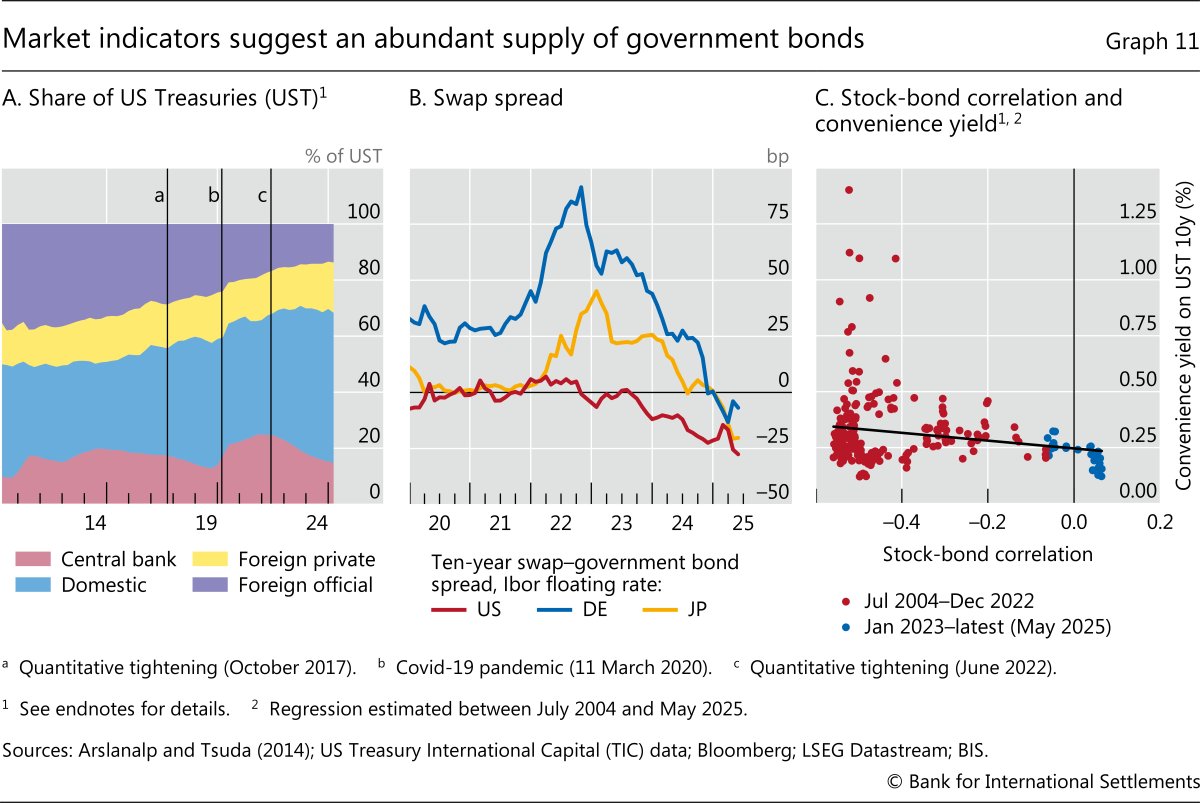
At the same time, there are signs of some weakening in investor appetite for government bonds and rising intermediation challenges. One indicator is the recent decline of interest rate swap spreads – the difference between the fixed-rate leg of an interest rate swap and government bond yields of the same tenor – into negative territory for Japanese yen and German euro swaps, following in the footsteps of comparable US instruments (Graph 11.B).13 Meanwhile, the rising correlation between stocks and bonds signalled a reduction in the traditional hedging properties of government bonds for investment portfolios, amid higher inflation expectations and rising concerns about inflation uncertainty. This is also reflected in lower convenience yields on US Treasuries – the premium investors place on holding these securities for their safety and liquidity (Graph 11.C).14
High public debt levels, if coupled with rising interest rates and sluggish economic growth, raise the chance of adverse scenarios that could compromise price and financial stability. For instance, growing concerns about fiscal sustainability could give rise to refinancing challenges and potentially dislodge inflation expectations, complicating the conduct of monetary policy. These challenges could be compounded by currency depreciation, as capital flees the country, amplifying inflationary pressures. That said, these risks are significantly mitigated by central bank independence and strong institutional safeguards, which shield monetary authorities from political interference and enable them to adhere strictly to their mandates. This reinforces public trust, anchoring inflation expectations even in periods of heightened concerns about fiscal sustainability.15
High public debt also makes the financial system vulnerable to lower asset values when interest rates increase, especially when it is accompanied by high leverage in the financial sector.16 Whether it reflects changes in sovereign or inflation risk, or an unexpected but necessary tightening of monetary policy, a repricing of government securities can lead to substantial losses for banks and NBFIs with significant sovereign debt holdings. Such losses could, in turn, potentially trigger deleveraging or even insolvencies and ultimately tighten financial conditions for the broader economy. The resulting economic slowdown can further erode sovereign creditworthiness, creating a feedback loop between fiscal and financial vulnerabilities that exacerbates risks to both sectors.
Recent events have highlighted how these vulnerabilities can play out in case of a sharp increase in perceived fiscal risks. For instance, bond losses were central to the turmoil in the UK gilt markets following the announcement of the mini-budget in September 2022. This episode also triggered a crisis in liability-driven investment (LDI) strategies used by UK pension funds, which faced sudden margin calls as gilt yields surged, forcing them to sell assets in a self-reinforcing spiral that further destabilised the market. Similarly, the rapid increase in US policy rates to combat inflation played a pivotal role in the March 2023 US regional banking crisis. Unrealised losses on government bonds became a critical issue when some banks faced sudden and substantial deposit withdrawals. In the future, the stress could be much more severe if the creditworthiness of some sovereigns is questioned.
Macro-financial vulnerabilities
Macro-financial vulnerabilities have the potential to amplify economic developments, including the anticipated slowdown triggered by the shift in trade policy and heightened uncertainty. While private sector debt levels have remained relatively stable in most countries since the GFC and throughout the pandemic, they remain historically high among non-financial corporations in several jurisdictions and households in several smaller economies (Graph 12.A).
At the same time, major changes in the financial system since the GFC have introduced new risks. Debt issuance by the government in the form of sovereign bonds has outpaced the growth of claims on the private sector, while financial intermediation has increasingly shifted from banks to NBFIs. Private credit funds now play a larger role in providing credit to private firms, while asset managers and hedge funds have a larger footprint in sovereign bond markets and cross-border flows, supported by the expansion of short-term funding and hedging markets. As a result, financial conditions as well as financial stability risks are increasingly influenced by players outside traditional banking systems.17
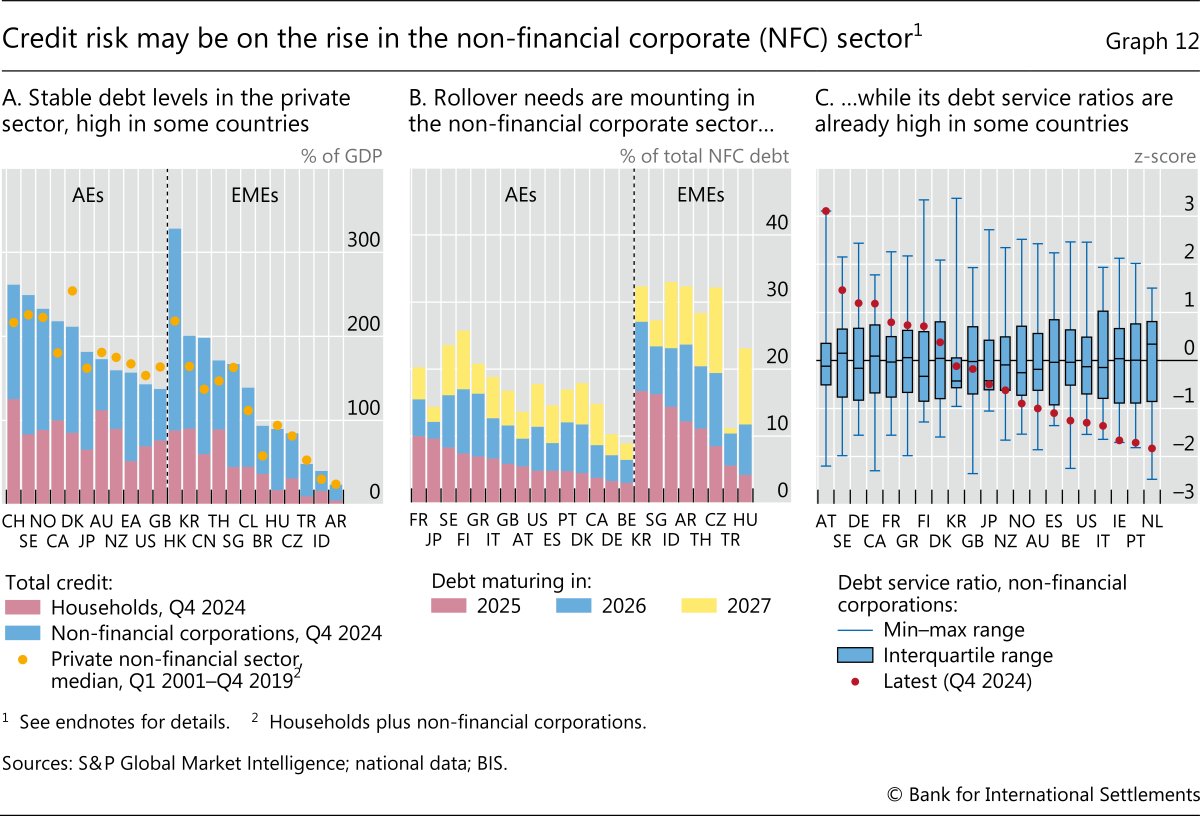
Consider first the risks posed by high debt in the household and non-financial corporate sectors. One concern is that elevated debt could amplify any economic downturn by leading to wider credit spreads, rising defaults and reduced credit availability. In the household sector, debt service ratios suggest that risks in most countries remain contained. But a deterioration in labour market conditions, coupled with declining house prices, could slow consumer spending and pose significant challenges in countries with high household debt. In the corporate sector, the potential deflationary impact of recent economic events could worsen the credit worthiness of firms in some economies. Furthermore, non-financial corporations – particularly in EMEs – will continue to face substantial debt rollovers in the coming years (Graph 12.B). If benchmark rates increase further and spreads widen from today's compressed levels, the cost for firms of refinancing maturing debt could rise substantially, putting additional pressure on debt service ratios, which are already elevated in some jurisdictions (Graph 12.C).
In this context, the rapid growth of private credit markets in recent years could represent an emerging pocket of risk. A growing share of the long-term credit to small or medium-sized and highly indebted companies is provided by private credit funds, which are, in turn, typically funded by pension funds and insurance companies.18 Compared with bank loans, this form of credit is less exposed to maturity transformation and liquidity risks but is also notoriously opaque.19 Since these assets are not regularly marked to market, they are less likely to amplify reductions in credit supply during a downturn, but they may allow bad credit to accumulate in the corporate sector.20 Moreover, recent trends such as efforts to attract retail investors and the offer of frequent redemption windows may reintroduce liquidity risks. Ultimately, the resilience of this relatively young sector to a sizeable downturn in the credit cycle remains largely untested.
While private credit providers present emerging risks, traditional banks are also exposed to credit risk through the support they provide to private markets. For example, banks supply loans to finance leveraged buyouts or warehouse portfolios of loans before they are securitised – that is, sold to private investors. As long as these loans are on banks' balance sheets, banks remain exposed to the associated credit and market risks.21 When conditions for securitisation deteriorate, as occurred in 2022, banks' balance sheets may become encumbered with those loans, crowding out new lending.22
Aside from loan markets, the shifts in financial intermediation activity towards NBFIs has increased the likelihood that financial instability could originate or be amplified by liquidity stresses. For instance, with broker-dealer balance sheets having smaller heft in the financial system post-GFC, liquidity in sovereign bond markets increasingly relies on open-ended mutual funds, hedge funds and other asset managers. These entities often face significant liquidity mismatches, rely on short-term funding backed by government securities as collateral or are either frequently highly leveraged or exhibit leverage-like behaviour. As a result, their liquidity provision is less stable and more likely to evaporate during periods of market stress.
Hedge funds, in particular, have increasingly become a significant source of procyclical liquidity, especially in government bond markets. These investors actively pursue relative value trading strategies that seek to exploit small price differences between related financial instruments.23 To boost the returns on these small price differences they heavily leverage their positions. One method often used is to pledge government securities as collateral in the repo market to borrow more cash with which to purchase additional government securities. This practice has further evolved in recent years, with investors borrowing amounts equal to or higher than the market value of the collateral provided – that is, without any discount, or haircut, protecting the cash lender from market risk.24 In turn, that means that the borrower can obtain more leverage, leaving the overall market exposed to dislocations if haircuts are increased even slightly, leading to forced selling. The increased heft of hedge funds is reflected, for instance, in their growing US Treasury gross exposure – now exceeding 10% of the outstanding free float (Graph 13.A, red line) – and the expansion of the US repo market segment catering to leveraged investors (blue line).25
Hedge funds' relative value strategies are highly vulnerable to adverse shocks in funding, cash or derivative markets, as evidenced by some recent episodes. During the market turmoil of March 2020, for instance, margin calls in Treasury futures markets triggered fire sales, resulting in destabilising deleveraging spirals.26 More recently, a more orderly unwinding of relative value trades – this time tied to interest rate swap markets, where investors had bet on a narrowing in spreads due to potential deregulation – seems to have contributed to the heightened volatility observed in Treasury markets in early April 2025.
Another potential source of liquidity risk stems from the growing presence of stablecoins in the Treasury market. Although relatively small in terms of aggregate capitalisation, some major issuers, such as Tether and Circle, hold significant reserves in US Treasuries and provide substantial repo market funding through dedicated money market funds (Graph 13.B). Their increasing heft raises financial stability concerns, as it exposes traditional finance to the ebbs and flows of the crypto ecosystem. On the one hand, as stablecoins grow, they will absorb an increasing share of safe assets that traditional financial institutions could otherwise use. On the other hand, negative shocks in the crypto market could lead to sizeable sell-offs which could disrupt the orderly functioning of Treasury markets (see Chapter III).
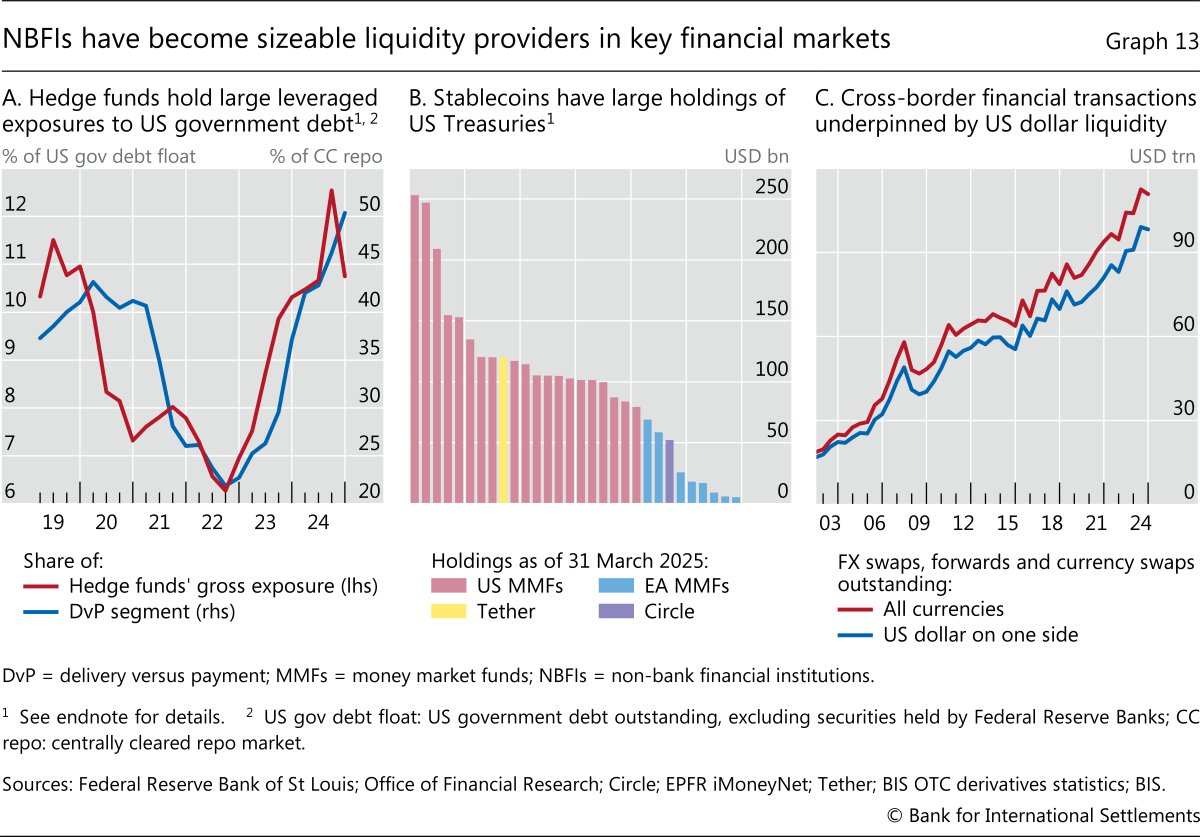
NBFIs have also significantly expanded their role in cross-border financial transactions, mainly through portfolio investment in bonds. Many rely on short-term dollar funding and hedging markets through repos and foreign exchange (FX) swaps to finance positions and manage currency exposures. Notably, non-US pension funds and insurers hold substantial US assets hedged with short-maturity FX derivatives that are continuously rolled over. By end-2024, dollar borrowing through FX swaps, forwards and currency swaps accounted for 90% of the $111 trillion in these instruments globally outstanding (Graph 13.C). While these tools facilitate funding and hedging of large cross-border positions, they also expose NBFIs to significant short-term rollover risks and funding squeezes, as highlighted by the sharp volatility in early August 2024 (see Chapter II).
Policies to deal with a more uncertain and fragmented world
Economic policy should strive to promote sustainable economic growth while preserving economic and financial stability. Its success depends not only on the specific measures chosen but also on how they are implemented. Central to effective policymaking is building and maintaining society's trust, defined as the expectation that policymakers will act predictably in the pursuit of legitimate and predefined goals and that they will achieve these goals over time. For this, policymakers must set clear targets against which their policies can be assessed and select appropriate tools to achieve them. They must remain steadfast in pursuing them, addressing deviations promptly and transparently, while clearly explaining their actions and decisions to the public.
When trust exists, the public aligns its behaviour with policymakers' actions and is more willing to accept short-term costs for long-term gains. This not only enhances the effectiveness of policy but also strengthens its ability to adapt to changing circumstances – a trait that becomes even more vital in periods of sudden disruptions and heightened uncertainty. Trust and policy effectiveness reinforce each other, forming a virtuous circle. But the dynamic can also work in reverse. From this viewpoint, threats to central bank independence or drastic changes in international policies risk not only failing to achieve their stated objectives but also undermining the effectiveness of future policy measures. Thus, policymakers should continuously strive to strengthen their policy frameworks, ensuring they remain fit for purpose in the face of evolving challenges.27
Against this backdrop, the rest of this section discusses the main policy priorities needed to support long-term growth and preserve monetary and financial stability in the face of the vulnerabilities described earlier.
Structural policy
Structural reforms are key to addressing the persistent challenges of low economic and productivity growth experienced by many economies in recent decades, as well as the growing rigidity of the supply side of these economies.
Despite their importance, structural reforms have often lagged behind. Yet the need to implement them has now become more pressing. For one, if higher tariffs and other trade barriers become permanent, or if the fragmentation of the global economy along geopolitical lines continues, the global economy might see significant reconfigurations of supply chains, changes in the patterns of capital flows and shifts in the final destinations of goods and services. This puts a premium on improving the capacity of domestic markets to reallocate resources efficiently across firms and sectors. In addition, with higher public debt and still elevated private sector debt, raising potential growth is crucial for improving debt sustainability and ensuring broader macroeconomic stability.28 Finally, structural reforms that strengthen the supply side are the only means to achieving sustainable economic growth. Neither expansionary monetary policy nor expansionary fiscal policy can act as a lasting driver of long-term growth. At the same time, a stronger and more flexible supply side also improves the economy's resilience to adverse shocks, easing the trade-offs faced by central banks.
Structural policies should focus on at least three key interrelated areas, with a balance that depends on the specific needs and priorities of each country.
One is to reduce market rigidities and strengthen administrative capacity. In tight labour markets, reforms to fiscal incentives, pension systems and immigration policies are crucial to expand the labour supply. Business dynamism could be enhanced by reducing bureaucracy, streamlining administrative processes and offering targeted tax relief, among other measures.29 To lessen these rigidities, an efficient administration is also key. This may require attracting top talent, changing staff incentives and reviewing planning laws and regulations to make regular government spending and major public investment projects more efficient.
Another area of reform is to remove barriers to trade, both within and across borders, which could help offset the loss of trade from the ongoing trade conflicts. Remarkably, internal barriers can be quite large. For instance, estimates indicate that intra-EU trade barriers amount to tariffs of 45% on manufacturing and 110% on services trade, while provincial trade barriers in Canada resemble a 7% tariff.30 Reducing these barriers, including those preventing the full integration of internal capital markets, can foster business growth and improve credit flow to new investment projects.
Given ongoing trade tensions, revamping existing regional trade arrangements or striking new ones has gained greater urgency. For example, increasing the breadth of the Southern Common Market (Mercosur/Mercosul) in Latin America and the Regional Comprehensive Economic Partnership in the Asia-Pacific region has the potential to offset the current drop in cross-border investments. Moreover, the trade conflict may accelerate the conclusion of long-stalled trade agreements (eg EU-Mercosur) and the full ratification of repeatedly delayed treaties (eg Canada-EU).
Finally, greater public investment is essential in many countries not only to address low trend growth and supply rigidities but also to tackle emerging challenges such as the impact of climate change and increased defence needs. It may also prove key to helping the economy adapt to shifting trade patterns in the future. Importantly, public investment also serves as a catalyst for private business investment. By improving infrastructure and supporting research in areas like energy, biomedicine and AI, public investment can reduce costs, create new markets and stimulate private sector activity.31 Furthermore, the additional demand generated by public investment can amplify private investment through acceleration effects.
Unfortunately, the share of public investment as a share of public expenditure has been on a declining trend in many economies, contributing in part to the persistent slowdown in productivity growth.32 The German government's recent announcement of a large infrastructure fund is a step towards reversing this trend, and similar initiatives may follow in other countries with sufficient fiscal space.33 However, limited capacity to complete large projects on time and within budget poses significant challenges in some countries, while others may struggle to fully utilise available funds, as evidenced by the low uptake of the European Union's Recovery and Resilience Facility in certain cases. Moreover, without addressing supply side rigidities, substantial public investment risks fuelling higher inflation. To succeed, large investment plans need to be complemented by structural reforms in many countries.
Fiscal policy
A key priority for fiscal policy is to ensure debt sustainability and the rebuilding of fiscal buffers. This reduces the risk of destabilising scenarios that threaten price and financial stability, while creating the fiscal space needed to accommodate future increases in essential expenditures, such as increased public investment or support for broader structural reforms.
In practice, this means that countries facing large fiscal deficits and limited fiscal space must pursue fiscal consolidation. Research shows that fiscal consolidation is more likely to succeed when certain conditions are met.34 For a start, consolidation should be gradual to minimise short-term output costs, as long as markets have not raised concerns about fiscal sustainability. A large negative output impact would make it harder to stabilise debt ratios, making a gradual approach more effective.
Equally important is the quality of the fiscal adjustment, as the composition of spending and tax changes must be carefully designed to not only achieve the fiscal targets but also minimise short-run costs and enhance long-term supply potential. In countries with already high levels of spending and taxation, relying heavily on tax-based consolidation could hinder growth further. Adjustments to the composition of taxes and spending are part of structural reforms needed to boost sustainable growth and are better carried out with other structural measures, as discussed above.35
A strong fiscal framework – including well designed budget rules to guide short-term decisions, fiscal rules to meet longer-term objectives and an independent fiscal council – helps reinforce the credibility of fiscal plans, thereby allowing for gradual consolidation and smaller output costs. An added benefit of strong fiscal institutions is that they tend to be associated with lower risk premia and hence lower financing costs for the broader economy, even outside periods of consolidation.36 These are clear examples of how trust in policy institutions strengthens policy effectiveness.
Fiscal consolidation also tends to be more successful when implemented during periods of robust economic growth and stable global financial conditions. From this perspective, the recent deterioration of the global economic outlook risks complicating consolidation efforts. Should a downturn materialise, the pace of consolidation would have to be carefully calibrated to avoid deepening the slowdown, yet without endangering investors' confidence. For governments with limited fiscal space, a prudent approach could focus on stabilising the structural balance while allowing automatic stabilisers to operate fully. Countries that have robust fiscal institutions and are already implementing needed structural reforms would be in a better position to do so.
Regulation and supervision
Key risks to financial stability include a growing range of potential sources of liquidity stress in core financial markets, such as those for government bonds. At the same time, the myriad linkages between banks and non-banks have expanded the way stress in the NBFI sector could spill over to the banking sector.
Two key priorities for prudential policies and financial regulation will help address growing vulnerabilities in the financial system: first, ensuring the consistent implementation of Basel III across jurisdictions; and second, adopting a more holistic approach by applying consistent regulatory frameworks to financial intermediaries that pose similar risks to financial stability.
Some jurisdictions have considered delaying the implementation of Basel III or deregulating their financial sector in an attempt to balance growth objectives with financial stability risks. Proponents argue that easing regulations can stimulate credit supply and economic activity. However, history demonstrates that any short-term gains come at the cost of long-term instability. Adequate capital and liquidity regulation, together with supervision and the appropriate macroprudential overlay, have been shown to reign in excessive risk-taking by financial institutions, preventing financial crises that could have jeopardised the broader economy.37 Moreover, higher capital ratios have been associated with higher loan growth, highlighting the importance of bank capital as a robust funding source for credit supply.38
The timely and consistent adoption of Basel III across regions remains central to addressing regulatory shortcomings revealed by the GFC. Moreover, the insights on interest rate and liquidity risk management gained from the 2023 banking turmoil should also be used to inform and adapt national and international standards.39
Further, regulators need to be mindful of the risks and vulnerabilities that have migrated to the NBFI sector. As explained above, two key developments are the migration of credit risk from well regulated to less regulated entities and rising liquidity risks, especially in government bond markets. Examples include strong growth and rising leverage in private credit,40 the increasing presence of internationally active NBFIs and stablecoins' growing ties to traditional finance. Left unaddressed, these developments could amplify shocks and pose financial stability risks, for example when margin calls force fire sales and trigger deleveraging spirals. At the same time, such vulnerabilities have become harder to assess because more of the activity is conducted by less regulated entities, often with high levels of leverage.
This requires regulatory frameworks that apply similar stringency to financial intermediaries posing similar risks to financial stability, regardless of legal form or business model. A holistic approach, or "congruent regulation", would ensure that even if traditional banking activities migrate to the NBFI sector, they are subject to similar regulation, in turn reducing the potential for dangerous build-ups of systemic risk.41 Examples could include requiring minimum haircuts in all securities financing transactions and appropriately calibrated margin requirements even in transactions that are not centrally cleared. Such changes could improve the functioning and stability of bond markets in stress events and reduce the risks of liquidity spirals. Similarly, regulation of stablecoins and cryptoassets should follow a technology-neutral, "same activities, same risk, same regulatory outcomes" approach. The most pressing issues relate to integrity and financial crime – including adherence to anti-money laundering/countering the financing of terrorism reporting requirements – and the backing of stablecoins.
Such a holistic approach to regulation would ensure that regulatory adjustments are made with careful consideration of systemic consequences, avoiding the unintended effect of merely diluting existing safeguards.42
Monetary policy
The post-pandemic experience and recent trade tensions demonstrated that broad-based inflationary pressures could emerge from multiple sources, not just strong aggregate demand. Structural shifts and the growing rigidity of the supply side of many economies might translate into shocks having a larger impact on inflation than in the past. Added to that, the scars from the post-pandemic inflation surge might leave a lasting imprint on inflation expectations with implications for the outlook for inflation (see Box C). In such an environment, central banks' role as anchors of price stability becomes even more important.
For some central banks, including that of the United States and those of countries that retaliate strongly to US tariffs, these developments are expected to resemble a supply shock. They therefore present a difficult trade-off for monetary policy. In choosing the extent and pace of ongoing monetary easing – or whether to pause it altogether – central banks must carefully balance the need to cushion the impact on output and employment against the risk that the expected one-off rise in prices morphs into persistently higher inflation. Assessing this trade-off is particularly challenging given a lack of clarity surrounding the combined effect of the tariffs so far implemented and uncertainty regarding potential future measures. The initial impact on the price level will depend on the extent to which tariffs could be absorbed by firms' margins and on the response of exchange rates, both of which are hard to predict.
This uncertainty is further compounded by the interplay of forces that could either amplify or mitigate the initial impact on inflation and its subsequent trajectory. On one hand, wage- and price-setters may have become more responsive to new inflation shocks. Households, in particular, may show less tolerance for real wage declines following the sharp rise in living costs after the pandemic. On the other hand, a large negative impact of tariffs and uncertainty on domestic output and unemployment could put downward pressure on inflation. Additional disinflationary forces may arise from declining commodity prices, particularly in the event of a pronounced global economic slowdown, as well as from trade diversion and lower prices from tariff-affected countries like China and other surplus economies. These mitigating factors are likely to be especially relevant for economies other than the United States.
In countries that have not imposed tariffs or retaliatory measures, the trade shock is likely to be more akin to an adverse demand shock. As a result, the disinflationary effects in these economies are likely to dominate, including from lower prices for manufactured goods and lower commodities prices. Economies in this group, particularly Asian EMEs experiencing inflation at or below target, may therefore have greater room to continue supporting growth with monetary easing.
Whatever course of action they take, central banks should continue to foster a stable economic environment with a medium-term orientation for policy. By adhering firmly to their mandates, especially against political pressures, and communicating their decisions with clarity and consistency, they can build trust and anchor expectations, providing a sense of predictability in an otherwise uncertain environment. Importantly, central banks should protect their independence and credibility by remaining grounded in realistic views of what monetary policy can and cannot deliver, focusing on the objectives they are well equipped to achieve, namely price and financial stability.
Looking ahead, it is important that monetary policy frameworks remain fit for purpose in a rapidly evolving economic landscape characterised by a wider range of supply shocks and increased uncertainty and unpredictability. Periodic reviews of these frameworks, as currently undertaken by some major central banks, serve this purpose and are informed by three key lessons from recent experience.
First, the experience of the post-pandemic inflation surge and the rising prevalence of supply shocks highlights the need for a symmetric approach to inflation targeting. Such an approach allows central banks to respond forcefully not only to the risks of inflation undershooting the target and interest rates hitting the effective lower bound but also to the risks of inflation surges.
Second, in the face of high and rising uncertainty central banks should remain agile and responsive, continuously adapting their tools to evolving economic conditions. Flexible policy tools and exit strategies should be prioritised to address the potential for abrupt macroeconomic changes. The policy rate should remain the primary instrument, while the use of balance sheet instruments outside crisis periods should be approached with caution. Large-scale asset purchases, in particular, tend to exhibit diminishing returns and are difficult to reverse. Similarly, forward guidance should be employed judiciously, along with clear communication emphasising its state-contingent nature and the dependence of future policy paths on economic developments.
Tools for restoring market functioning should be carefully designed with a clear exit strategy to alleviate moral hazard concerns and to ensure that they do not interfere with the appropriate monetary policy stance.43 Instead, macroprudential tools should play a pre-emptive, complementary role, containing the build-up of vulnerabilities and increasing the resilience of the financial system in the face of shocks, thereby reducing the likelihood of financial crises throughout the interest rate cycle.44 Central banks, in particular in EMEs, would continue to benefit from frameworks that combine inflation targeting and greater exchange rate flexibility with judicious use of FX intervention to shield against destabilising external developments.
Finally, policymakers must be humble in the face of high uncertainty, acknowledging the inherent limits of economic forecasting. Relying too heavily on a single baseline outlook may hinder policymakers' ability to effectively communicate the risks to the outlook and their potential responses to alternative outcomes. By incorporating information such as sensitivity analyses and alternative scenarios, central banks can provide greater transparency around their decisions. While this approach in communication is more complex, as it can dilute the message or overemphasise unlikely outcomes, it can offer the public a more nuanced understanding of the risks to the outlook and the trade-offs the central bank is facing.
Endnotes
1 The estimated impact of uncertainty is also uncertain. For further evidence on the relationship between uncertainty and economic activity, see Cascaldi-Garcia et al (2023) and Londono et al (2025). The impact of the increase in uncertainty following the imposition of US trade tariffs is discussed in Burgert et al (2025).
2 After temporarily rising during the pandemic, productivity growth has fallen back to or below pre-pandemic trends. The strong performance of the United States was the notable exception. See Igan et al (2024).
3 Dispersion in firm-level productivity outcomes has risen in both the United States (Akcigit and Ates (2021)) and other countries (Banerjee et al (2024)). The growing disparity is mostly attributed to a lack of catch-up in productivity by laggard firms, rather than changes in frontier firms (Andrews et al (2019)). Demographic trends that inhibited entrepreneurship and firm entry are partly responsible for the poor performance of laggard firms (Hopenhayn et al (2022) and Karahan et al (2024)).
4 Very low interest rates and easy financial conditions have also contributed to reducing incentives to screen investment projects (Kharroubi et al (2023) and Gopinath et al (2017)). Too large a financial system may compete for highly skilled workers, diverting them from more productive sectors (Cecchetti and Kharroubi (2019)). Credit may not flow to more innovative firms, as they have insufficient collateral (eg Caballero et al (2025) and Kharroubi et al (2023)).
5 Higher taxation and low public investment may have further stifled private initiatives and innovation, particularly in countries burdened by high public debt. See eg Fornaro and Wolf (2025) and Cecchetti et al (2011).
6 FDI may be more important for growth in EMEs than domestic investment, especially in countries that have a minimum stock of human capital (Borensztein et al (1998)). FDI facilitates knowledge transfer both to the firms receiving the investments and to those that later hire their workers (Poole (2013)). Aside from the effects transmitted through labour mobility, FDI in EMEs also generates positive spillovers through local suppliers in upstream sectors (Javorcik (2004)).
7 Globalisation has substantially reduced poverty rates and income inequality among countries. AEs have also benefited, despite slower growth from other forces, as their income levels would be significantly lower without globalisation. See Gambacorta et al (2025) for a discussion of the factors that have led to rising trade tensions.
8 See eg McKibbin et al (2024).
9 It also suggests that global measures of economic slack, which have been found to be relevant in explaining domestic inflation (eg Borio and Filardo (2007) and Ciccarelli and Mojon (2010)), may lose relevance going forward.
10 For a detailed description of how the economy can transition from a low- to a high-inflation regime, see Borio, Lombardi, Yetman and Zakrajsek (2023).
11 Additionally, the pandemic-era inflation surge highlighted the non-linear nature of the Phillips curve. When inflation rises sharply, the frequency of price adjustments increases, amplifying the transmission of the initial inflationary shock and intensifying its impact on the broader economy.
12 See Eren et al (2023) for a discussion of the effects of the composition of government debt holders.
13 Interest rate swaps are contracts in which counterparties exchange fixed rate payments for floating rate payments linked to a benchmark. The swap spread is the difference between the swap rate (the fixed rate) and the yield on a government bond of the same maturity. Swap rates and bond yields are connected by arbitrage, so swap spreads should typically stay close to zero, barring costs and risk compensation. Negative swap spreads are not arbitraged away because they capture intermediation costs rather than a "free lunch". Negative spreads compensate intermediaries for holding government bonds on their balance sheets and entering swaps as fixed rate payers.
14 For further information on the signals about government debt demand in market activity, see Aquilina et al (2024) and Acharya and Laarits (2023) on stock-bond correlations, inflation expectations and the convenience yield on Treasuries.
15 For example, a credible monetary policy greatly reduces the impact of fiscal deficits on inflation even when fiscal policy is not stabilising public debt. See Banerjee et al (2022).
16 See Borio, Farag and Zampolli (2023) for a detailed description of the relevant channels and the associated evidence.
17 See Borio, Claessens, Schrimpf and Tarashev (2023).
18 The search for yield appears particularly intense in private credit. See Aramonte and Avalos (2021).
19 Aramonte and Avalos (2021) and Avalos et al (2025).
20 Valuation losses in public markets can sometimes amplify economic fluctuations by reducing the net worth of firms and households, thus tightening their borrowing constraints. Bank loans are not marked to market either, but banks do have provisions for non-performing loans, which can be detrimental to their lending capacity, possibly amplifying economic fluctuations too.
21 Banks warehouse leveraged loans – ie hold them temporarily on their balance sheet – during the process of gathering the pool of loans to be securitised as a collateralised loan obligation (CLO). In addition to domestic warehousing banks, foreign institutional investors and banks are large holders of CLOs and private assets exposures, sometimes highly concentrated. See Aramonte and Avalos (2019).
22 Banks also provide "subscription lines" to asset managers operating in private markets to bridge the gap between investments and capital calls to investors. Those credit lines are typically collateralised with the capital commitments of the very same investors, so the credit risk is relatively low. Moreover, investment banks provide prime brokerage services to hedge funds, family offices and other institutional clients. Those services involve trade execution, custody of assets, securities lending, leveraged trading and risk management, in some cases representing significant market and credit risks for the banks. The collapse of Archegos Capital Management in March 2021 illustrates the vulnerabilities involved.
23 Within fixed income markets, the cash-futures basis trade, which exploits narrow price gaps between futures and cash bonds, has been under scrutiny in recent years. Other common strategies include yield curve arbitrage and swap spread arbitrage, both of which have been associated with episodes of market stress in the post-pandemic period (eg in October 2021 and April 2025, respectively). Many other strategies exist, including in interest rate, equity and commodity markets, often involving an array of derivative instruments in addition to futures, such as swaps, forwards and options.
24 More than 70% of the non-centrally cleared bilateral repos are transacted with zero haircut (Hempel et al (2023)). For evidence of repos transacted at negative haircuts, see Hermes et al (2025) and Lu and Wallen (2025).
25 This is the delivery-versus-payment (DvP) segment of the repo market, where transactions settle against specific securities. In these transactions, a dealer facilitates non-dealer counterparties' access to the Fixed Income Clearing Corporation (FICC) cleared repo platform. In terms of amounts, they are the exact mirror image of the hedge fund basis trade volume (Aldasoro and Doerr (2023)).
26 See Schrimpf et al (2020) and Avalos and Sushko (2023). Moreover, the repo linkage means stress in one sector can quickly spill over to another – arguably one of the contributing factors to the market stress in September 2019 and March 2020 – highlighting the fragility of financing highly leveraged positions with very short-term funding. See Avalos et al (2019) and Eren et al (2020a, 2020b).
27 See eg Carstens (2023, 2024).
28 Many of the required structural reforms to boost growth are fiscal in nature, involving long-lasting changes in the level and composition of taxes and expenditures and requiring policymakers and societies to agree on and adopt a long-term view on the broader role of government in the economy.
29 See eg Nagel (2025) and Draghi (2024) on the structural reforms that could boost growth.
30 For estimates regarding the European Union and Canada, see IMF (2024) and Bemrose et al (2020), respectively.
31 See, for example, Antolin-Diaz and Surico (forthcoming), who find that public spending boosts private sector productivity and innovation in the medium term, leading to a large and persistent increase in output at longer horizons.
32 While public investment accounted for 7.5–8% of government expenditures on average up to the early 2010s, this share has fallen significantly during the last decade, down to 6.5%.
33 The Draghi (2024) report calls for €750–800 billion in investment annually (or about 5% of EU GDP).
34 For a review see eg Balasundharam et al (2023) and IMF (2023).
35 See eg Adarov and Panizza (2024) for evidence. See also Fornaro and Wolf (2025) for a theoretical model in which fiscal austerity coupled with pro-growth policies can help economies escape from a high debt, large fiscal distortion and low productivity regime.
36 On the impact of fiscal rules on sovereign spreads and ratings, see eg Chrysanthakopoulos and Tagkalakis (2024), Gomez-Gonzalez et al (2022) and Sawadogo (2020).
37 The Basel Committee on Banking Supervision (BCBS) finds that "there are clear net long-term economic benefits from increasing the minimum capital and liquidity requirements from their current levels in order to raise the safety and soundness of the global banking system". The benefits mainly stem from a lower probability of a financial crisis (BCBS (2010)).
38 See Gambacorta and Shin (2018).
39 See BCBS (2023).
40 Aldasoro and Doerr (2025) and Aldasoro et al (forthcoming).
41 See Metrick and Tarullo (2021).
42 Efforts to strengthen macroprudential regulation of NBFIs have been under way since the GFC at both national and international levels. The Financial Stability Board, for instance, has recommended robust domestic frameworks to identify and monitor NBFI leverage vulnerabilities, alongside measures to address these risks through adjustments to legal and regulatory frameworks and the adoption of targeted policy tools, such as activity-, entity- and concentration-based approaches.
43 See BIS (2024).
44 See BIS (2024).
Additional notes to graphs
Graph 1.A: Actual figures, Consensus Economics estimates and forecasts. For IN, for fiscal years beginning in April. For the regions, GDP-PPP weighted averages of seven other AEs, eight other Asian EMEs and five other Latin American economies. Global is the GDP-PPP weighted average of 65 economies, based on data availability.
Graph 1.B: Actual figures, Consensus Economics estimates and forecasts as of May 2025. GDP-PPP weighted averages. The sample consists of 65 economies, based on data availability. Asia & Oceania = AM, AU, AZ, CN, GE, HK, ID, IL, IN, JP, KR, KZ, MY, NZ, PH, SA, SG, TH, TM, TR, UZ and VN; Americas = AR, BO, BR, CA, CL, CO, CR, DO, EC, GT, HN, MX, NI, PA, PE, PY, SV, US, UY and VE; Europe = AL, BA, BG, BY, CH, CZ, DK, EA, GB, HU, MD, ME, MK, NO, PL, RO, RS, RU, SE and UA; Africa = EG, NG and ZA. For IN, for fiscal years beginning in April.
Graph 2.A: Real private consumption per capita; seasonally adjusted series. The trend is based on Q1 2015–Q4 2019 data. Other AEs includes 10 economies.
Graph 2.B: Households and non-profit institutions serving households (NPISHs), or closest based on data availability. Definitions differ among economies; seasonally adjusted series. Latest: for CA, SE and US, Q1 2025; Q4 2024 otherwise. Pre-pandemic average: for NZ, Q2 2016–Q4 2019; Q1 2015–Q4 2019 otherwise.
Graph 2.C: GDP-PPP weighted average of eight other Asian EMEs and six Latin American economies. For CN, annual series from IMF, World Economic Outlook; seasonally adjusted quarterly national series otherwise.
Graph 3: Latest: for AU and NZ, Q1 2025; April 2025 otherwise. Inflation targets/tolerance intervals are official point targets, target bands, tolerance ranges or unofficial objectives announced by authorities.
Graph 4.A: The sample covers 11 AEs, nine Asian EMEs, six Latin American economies and 13 other EMEs.
Graph 4.B: Median across AT, AU, BE, CA, CH, DE, DK, ES, FI, FR, GB, GR, IE, IT, JP, LU, NL, NO, NZ, PT, SE and US, where data are available. End-year central bank assets and annual average policy rates. The real policy rate is calculated by adjusting the nominal rate for headline inflation. For policy rates in 2025, averages of available data.
Graph 5.A: Trade policy uncertainty index refers to the number of articles related to trade policy uncertainty as a share of the total number of articles in seven newspapers each month (data downloaded from www.matteoiacoviello.com/tpu.htm). Economic policy uncertainty index refers to the number of articles related to economic policy uncertainty as a share of the total number of own-country articles in each month; GDP-PPP weighted average of 21 economies (data downloaded from www.policyuncertainty.com). Geopolitical risk index refers to the number of articles related to adverse geopolitical events as a share of the total number of articles in 10 newspapers each month (data downloaded from www.matteoiacoviello.com/gpr.htm). Series are demeaned and divided by their standard deviation based on the period starting in January 2000.
Graph 5.B: Economic policy uncertainty index refers to the number of articles related to economic policy uncertainty as a share of the total number of own-country articles in each month (data downloaded from www.policyuncertainty.com). For global, GDP-PPP weighted average of 21 economies. For CN, index based on mainland newspapers; DE, ES, FR, GB and IT represent Europe. Series are demeaned and divided by their standard deviation based on the period starting in January 2000. Latest: for global, March 2025; for CN, April 2025; for Europe, JP and US, May 2025.
Graph 7.A: Seasonally adjusted medians. The sample covers AR, AT, AU, BE, BR, CA, CH, CL, CN, CO, CY, CZ, DE, DK, ES, FI, FR, GB, GR, HK, HU, ID, IE, IL, IN, IT, JP, KR, LU, MT, MX, MY, NL, NO, NZ, PH, PL, PT, RU, SA, SE, SG, SI, TH, TR, US and ZA. See Banerjee et al (2025).
Graph 7.B: The uncertainty impact on business (non-residential private) investment is derived from conditional forecasts using a BVAR model running the following country-specific regressions at quarter t: , where is an vector of endogenous variables, is an intercept vector, are coefficient matrices and is an vector of Gaussian exogenous shocks with zero mean and variance-covariance matrix encompasses a range of key economic indicators, including non-residential private investment, labour productivity (measured as real GDP per hour worked), public investment, real GDP, consumer price index (CPI), term premium (ie 10-year minus three-month yield), shadow rate and economic policy uncertainty index (EPU) by Baker et al (2016) (data downloaded from www.policyuncertainty.com). The model includes four lags and is estimated using the Minnesota prior with a hierarchical approach to prior selection (Giannone et al (2015)). The uncertainty impact is measured as the difference between a forecast conditioned on Q2 2025 uncertainty levels and an unconditional forecast. Specifically, the uncertainty conditions for Q2 2025 are an average over the EPUs for April and May 2025. Conditional forecasts are computed based on a range of structural shocks (monetary policy shock, uncertainty shock, fiscal policy shock, supply shock, demand shock and other shocks). See the online annex of Burgert et al (2025) for further details.
Graph 8.A: Hodrick-Prescott filtered trend of year-on-year real GDP growth rates. For the regions, GDP-PPP weighted averages of 10 AEs; nine Asian EMEs and six Latin American economies.
Graph 8.B: Latest observations: for US, April 2025; for CA, average of February to April 2025; for GB, Q1 2025 and 2024 otherwise. Monthly and quarterly series are seasonally adjusted. JP shows end-October values.
Graph 8.C: World trade and foreign direct investment (FDI) from World Bank.
Graph 9.A: Based on trade-weighted averages of all products for each country. For the regions, median across economies: AEs = AU, CA, CH, GB, JP, NO and NZ; EMEs = AE, AR, BR, CL, CN, CO, DZ, ID, IL, IN, KR, KW, MA, MX, MY, PE, PH, RU, SA, SG, TH, TR, VN and ZA; where data are available. The US total effective tariff rate is defined by Fitch as the total duties as a percentage of total imports and changes with shifts in import share by country of origin and product mix.
Graph 9.B: The panel shows net interventions, which are defined as all harmful interventions minus all liberalising interventions as defined by the Global Trade Alert. The number of net interventions for each bilateral country relationship are weighted using the bilateral goods imports as a share of sample country goods imports. Non-tariff interventions include all harmful trade interventions except tariff interventions. The timing is based on the implementation date of an intervention.
Graph 9.C: Trade balance = exports minus imports. For the periods, simple averages are used.
Graph 10.A: The sample covers AR, AT, AU, BE, CA, CH, CO, DE, DK, ES, FI, FR, GB, GR, IE, IN, IT, JP, KR, MX, NL, NO, NZ, PH, PT, SE, TH, US and ZA, where data are available. Definitions may vary across time and countries. Estimates, if actual is not available.
Graph 10.B: The sample covers AT, AU, BE, CA, CH, CZ, DE, DK, ES, FI, FR, GB, GR, HU, IE, IT, JP, KR, LU, NL, NO, NZ, PL, PT, SE and US. Gross general government interest payments. OECD estimates, if actual is not available.
Graph 11.A: Based on data from the US Treasury International Capital (TIC) System. Sovereign investor base estimates by Arslanalp and Tsuda (2014); last updated on 2 May 2025.
Graph 11.C: Stock-bond correlation = 10-year rolling correlation between the three-month log returns of bonds and equity. For bonds, total return index of the 10-year US Treasury; for equity, S&P 500. Convenience yield = 10-year TIPS yield + 10-year inflation swap rate – 10-year Treasury yield.
Graph 12.A: Households = households and NPISHs.
Graph 12.B: Annual data, 2024 if available, 2023 otherwise.
Graph 12.C: Each series starts in 1980 or with the earliest available observation; demeaned and divided by the standard deviation.
Graph 13.A: Gross exposure represents the sum of long and short positions. The US government debt asset class includes debt issued by US federal, state and local entities, such as cash Treasury securities, Treasury bond futures, other Treasury security derivatives, municipal bonds and obligations issued by government-sponsored entities. CC repo market includes the tri-party market, the Fixed Income Clearing Corporation's (FICC) DvP service and FICC's General Collateral Financing (GCF) Repo service. Hedge funds' gross exposure: quarterly data. Repo data correspond to quarterly averages of daily values.
Graph 13.B: Tether's and Circle's reported holdings of Treasuries including indirect (eg via repo), compared with US and EA government money market funds (MMFs). Full fund size (including non-US treasuries) for EA MMFs.
References
Acharya, V and T Laarits (2023): "When do Treasuries earn the convenience yield? A hedging perspective", NBER Working Papers, no 31863, November.
Adarov, A and U Panizza (2024): "Public investment quality and its implications for sovereign risk and debt sustainability", CEPR Discussion Papers, no 19252, July.
Akcigit, U and S Ates (2021): "Ten facts on declining business dynamism and lessons from endogenous growth theory", American Economic Journal: Macroeconomics", vol 13, no 1, pp 257–98.
Aldasoro, I and S Doerr (2023): "Who borrows from money market funds?", BIS Quarterly Review, December, pp 47–59.
----- (2025): "Collateralized lending in private credit", BIS Working Papers, no 1267, May.
Aldasoro, I, S Doerr and K Todorov (forthcoming): "Private credit goes retail: leverage and liquidity mismatches", BIS Bulletin.
Alfaro, L, A Chanda, S Kalemli-Ozcan and S Sayek (2004): "FDI and economic growth: the role of local financial markets", Journal of International Economics, vol 64, no 1, pp 89–112.
Alfaro, L and J Chauvin (2020): "Foreign direct investment, finance and economic development", in F Rivera-Batiz (ed), Encyclopaedia of international economics and global trade, vol 1, World Scientific, pp 231–58.
Andrews, D, C Criscuolo and P Gal (2019): "The best versus the rest: divergence across firms during the global productivity slowdown", CEP Discussion Papers, no 1645, August.
Antolin-Diaz, J and P Surico (forthcoming): "The long-run effects of government spending", American Economic Review.
Aquilina, M, A Schrimpf, V Sushko and D Xia (2024): "Negative interest rate swap spreads signal pressure in government debt absorption", BIS Quarterly Review, December, pp 15–17.
Aramonte, S and F Avalos (2019): "Structured finance then and now: a comparison of CDOs and CLOs", BIS Quarterly Review, September, pp 11–14.
----- (2021): "The rise of private markets", BIS Quarterly Review, December, pp 69–82.
Arslanalp, S and T Tsuda (2014): "Tracking global demand for advanced economy sovereign debt", IMF Economic Review, vol 62, no 3, pp 430–64.
Avalos, F, S Doerr and G Pinter (2025): "The global drivers of private credit", BIS Quarterly Review, March, pp 13–30.
Avalos, F, T Ehlers and E Eren (2019): "September stress in dollar repo markets: passing or structural?", BIS Quarterly Review, December, pp 12–14.
Avalos, F and V Sushko (2023): "Margin leverage and vulnerabilities in US Treasury futures", BIS Quarterly Review, September, pp 4–5.
Baker, S, N Bloom and S Davis (2016): "Measuring economic policy uncertainty", Quarterly Journal of Economics, vol 131, no 4, pp 1593–1636.
Balasundharam, V, O Basdevant, D Benicio, A Ceber, Y Kim, L Mazzone, H Selim and Y Yang (2023): "Fiscal consolidation: taking stock of success factors, impact, and design", IMF Working Papers, no 63, March.
Banerjee, R, V Boctor, A Mehrotra and F Zampolli (2022): "Fiscal deficits and inflation risks: the role of fiscal and monetary policy regimes", BIS Working Papers, no 1028, July.
Banerjee R, J Frost, M Chui and J Vidal Pastor (2025): "Elasticity in the monetary system", BIS Bulletin, no 101, June.
Banerjee, R, A Mehrotra and F Zampolli (2024): "Credit and resource allocation in EMEs: taking stock of two decades of falling interest rates", BIS Bulletin, no 91, September.
Bank for International Settlements (BIS) (2024): "Monetary policy in the 21st century: lessons learned and challenges ahead", Annual Economic Report 2024, June, Chapter II, pp 41–89.
Basel Committee on Banking Supervision (BCBS) (2010): An assessment of the long-term economic impact of stronger capital and liquidity requirements, August.
----- (2023): Report on the 2023 banking turmoil, October.
Bemrose, R, W Brown and J Tweedle (2020): "Going the distance: estimating the effect of provincial borders on trade when geography (and everything else) matters", Canadian Journal of Economics, vol 53, no 3, pp 1098–131.
Boehm, C, A Levchenko and N Pandalai-Nayar (2023): "The long and short (run) of trade elasticities", American Economic Review, vol 113, no 4, pp 861–905.
Borensztein, E, J De Gregorio and J-W Lee (1998): "How does foreign direct investment affect economic growth?", Journal of International Economics, vol 45, no 1, pp 115–35.
Borio, C, S Claessens, A Schrimpf and N Tarashev (2023): "Collateral damage", VoxEU, 10 July.
Borio, C, M Farag and F Zampolli (2023): "Tackling the fiscal policy-financial stability nexus", BIS Working Papers, no 1090, April.
Borio, C and A Filardo (2007): "Globalisation and inflation: new cross-country evidence on the global determinants of domestic inflation", BIS Working Papers, no 227, May.
Borio, C, M J Lombardi, J Yetman and E Zakrajsek (2023): "The two-regime view of inflation", BIS Papers, no 133, March.
Burgert, M, M Chui, D Gorea and F Zampolli (2025): "Investment in an increasingly uncertain global landscape", BIS Bulletin, no 103, June.
Caballero, J, S Doerr, A Mehrotra and F Zampolli (2025): "How far can digital innovation improve credit to small firms in emerging market economies?", BIS Bulletin, no 99, February.
Caldara, D and M Iacoviello (2022): "Measuring geopolitical risk", American Economic Review, vol 112, no 4, pp 1194–225.
Caldara, D, M Iacoviello, P Molligo, A Prestipino and A Raffo (2020): "The economic effects of trade policy uncertainty", Journal of Monetary Economics, vol 109, pp 38–59.
Carstens, A (2023): "Trust and public policies", speech at the High-level seminar on central banking: past and present challenges, São Paulo, 19 May.
----- (2024): "Trust and macroeconomic stability: a virtuous circle", lecture at the Center for Financial Studies, Goethe University, Frankfurt, 18 March.
Cascaldi-Garcia D, C Sarisoy, J Londono, B Sun, D Datta, T Ferreira, O Grishchenko, M Jahan-Parvar, F Loria, S Ma, M Rodriguez, I Zer and J Rogers (2023): "What is certain about uncertainty?", Journal of Economic Literature, vol 61, no 2, pp 624–54.
Cavallo A, G Gopinath, B Neiman and J Tang (2021), "Tariff pass-through at the border and at the store: evidence from US trade policy", American Economic Review: Insights, vol 3, no 1, pp 19–34.
Cecchetti, S and E Kharroubi (2019): "Why does credit growth crowd out real economic growth?", The Manchester School, vol 87, no S1, pp 1–28.
Cecchetti S, M Mohanty and F Zampolli (2011): "The real effects of debt", in Achieving maximum long-run growth, proceedings of the Federal Reserve Bank of Kansas City Jackson Hole Economic Policy Symposium, August, pp 145–96.
Cheng, K, S Rehman, D Seneviratne and S Zhang (2015): "Reaping the benefits from global value chains", IMF Working Papers, no 15/204, September.
Chrysanthakopoulos, C and A Tagkalakis (2024): "The medium-term effects of fiscal policy rules", Journal of International Money and Finance, vol 142, April, 103019.
Ciccarelli, M and B Mojon (2010): "Global inflation", Review of Economic Statistics, vol 92, no 3, pp 524–35.
D'Acunto F, F De Fiore, D Sandri and M Weber (2025): "A global survey of households' perceptions and expectations", BIS Quarterly Review, forthcoming.
De Fiore, F, D Sandri and J Yetman (2025): "Household perceptions and expectations in the wake of the inflation surge: survey evidence", BIS Bulletin, no 104, June.
De Rezende, R and A Ristiniemi (2023): "A shadow rate without a lower bound constraint", Journal of Banking & Finance, vol 146, 106686.
Draghi, M (2024): The future of European competitiveness: report by Mario Draghi, European Commission.
Eren, E, A Schrimpf and V Sushko (2020a): "US dollar funding markets during the Covid-19 crisis – the money market fund turmoil", BIS Bulletin, no 14, May.
----- (2020b): "US dollar funding markets during the Covid-19 crisis – the international dimension", BIS Bulletin, no 15, May.
Eren, E, A Schrimpf and D Xia (2023): "The demand for government debt", BIS Working Papers, no 1105, June.
Fajgelbaum, P, P Goldberg, P Kennedy and A Khandelwal (2020): "The return to protectionism", Quarterly Journal of Economics, vol 135, no 1, pp 1–55.
Feenstra R (1989): "Symmetric pass-through of tariffs and exchange rates under imperfect competition: an empirical test", Journal of International Economics, vol 27, no 1–2, pp 25–45.
Flaaen, A and J Pierce (2024): "Disentangling the effects of the 2018–2019 tariffs on a globally connected US manufacturing sector", Review of Economics and Statistics, pp 1–45.
Fornaro, L and M Wolf (2025): "Fiscal stagnation", CEPR Discussion Papers, no 20149, June.
Furceri, D, S Hannan, J Ostry and A Rose (2019) "Macroeconomic consequences of tariffs", IMF Working Papers, no 9.
Gambacorta L, E Kharroubi and F Zampolli (2025): "Trade and tariffs: facts versus myths", BIS, mimeo.
Gambacorta, L and H S Shin (2018): "Why bank capital matters for monetary policy", Journal of Financial Intermediation, vol 35, part B, pp 17–29.
Giannone, D, M Lenza, G Primiceri (2015): "Prior selection for vector autoregressions", Review of Economics and Statistics, vol 97, no 2, 436–51.
Gomez-Gonzalez, J, O Valencia and G Sánchez (2022): "How fiscal rules can reduce sovereign debt default risk", Emerging Markets Review, vol 50, March, 100839.
Gopinath G, Ş Kalemli-Özcan, L Karabarbounis and C Villegas-Sanchez (2017): "Capital allocation and productivity in South Europe", Quarterly Journal of Economics, vol 132, no 4, pp 1915–67.
Hempel, S, J Kahn, R Mann and M Paddrik (2023): "Why is so much repo not centrally cleared?", The OFR Blog, 12 May.
Hermes, F, M Schmeling and A Schrimpf (2025): The international dimension of repo: five new facts, March.
Hopenhayn, H, J Neira and R Singhania (2022): "From population growth to firm demographics: implications for concentration, entrepreneurship and the labor share", Econometrica, vol 90, no 4, pp 1879–914.
Igan, D, T Rosewall and P Rungcharoenkitkul (2024): "Productivity in the post-pandemic world: old trend or new path?", BIS Bulletin, no 93, October.
International Monetary Fund (IMF) (2023): "Coming down to earth: how to tackle soaring public debt", World Economic Outlook, Chapter 3, April, pp 69–89.
----- (2024): "Europe's declining productivity growth: diagnoses and remedies", Regional Economic Outlook Notes, November.
Javorcik, B (2004): "Does foreign direct investment increase the productivity of domestic firms? In search of spillovers through backward linkages", American Economic Review, vol 94, no 3, pp 605–27.
Karahan F, B Pugsley and A Şahin (2024): "Demographic origins of the start-up deficit", American Economic Review, vol 114, no 7, pp 1986–2023.
Kharroubi, E, C Upper, F Zampolli and C Borio (2023): "Credit booms, labor reallocation, and productivity growth", International Journal of Central Banking, vol 19, no 5, pp 237–86.
Krippner, L (2013): "Measuring the stance of monetary policy in zero lower bound environments", Economics Letters, vol 118, no 1, pp 135–138.
Londono J, S Ma and B Wilson (2025): "Costs of rising uncertainty", FEDS Notes, 24 April.
Lu, L and J Wallen (2025): Negative Treasury haircuts, May.
McKibbin W, M Hogan and M Noland (2024): "The international economic implications of a second Trump presidency", PIIE Working Papers, no 20, September.
Metrick, A and D Tarullo (2021): "Congruent financial regulation", Brookings Papers on Economic Activity, spring, pp 143–81.
Nagel, J (2025): "Economic policy measures to boost growth in Germany", speech at the Berlin School of Economics, Berlin, 10 March.
Poole, J (2013): "Knowledge transfers from multinational to domestic firms: evidence from workers mobility", Review of Economic and Statistics, vol 95, no 2, pp 393–406.
Qiu, H, H S Shin and L Zhang (2023): "Mapping the realignment of global value chains", BIS Bulletin, no 78, October.
Sawadogo, P (2020): "Can fiscal rules improve financial market access for developing countries?", Journal of Macroeconomics, vol 65, September, 103214.
Schrimpf, A, H S Shin and V Sushko (2020): "Leverage and margin spirals in fixed income markets during the Covid-19 crisis", BIS Bulletin, no 2, April.
Steil, B and B Della Rocca (2020): "92 percent of Trump's China tariff proceeds has gone to bail out angry farmers", Council on Foreign Relations, October.