Who borrows from money market funds?

Classifying all borrowers in about two thirds of the $9 trillion global money market fund (MMF) market, we document that MMFs extend funding primarily to banks and governments. Funding to other non-bank financial institutions (NBFIs) and non-financial corporates is a much smaller fraction of MMFs' assets. When monetary policy tightens, MMF assets increase by about 34 cents for every dollar of bank deposit contraction. MMFs allocate most of this increase to either governments or banks, and only a marginal share to other NBFIs, likely funding arbitrage trades by hedge funds. These findings cast doubt on the assumption, prevalent in the literature, that MMF funding enables other NBFIs to offset a material portion of the contraction in banks' credit supply when rates rise. 1
JEL classification: E52, G15, G21, G23.
Money market funds (MMFs) play a key role in short-term funding markets – with over $9 trillion in assets under management (AUM) globally as of end-2021 (FSB (2022)). Recurrent episodes of stress in the sector have underscored liquidity risks of systemic importance. At the same time, the attractive returns offered by MMFs have sparked concerns about the stability of banks' deposit funding when interest rates rise. Addressing risks emanating from MMFs requires a clear understanding of who borrows from them, and how their assets and investments change with policy rates.
This special feature provides a taxonomy of MMF investments and analyses how they respond to monetary policy tightening. We draw on detailed and up-to-date information on around two thirds of the global MMF market. Using entity-level information, we classify borrowers into governments, banks, other non-bank financial institutions (NBFIs) and non-financial corporations (NFCs). We contribute to the literature by clearly identifying the instruments through which specific borrower types obtain funding. Zooming in on the US segment of the market, we then show how MMF investments change with monetary policy. We investigate the common narrative that, when policy rates rise, the funding provided by MMFs to other NBFIs is sufficient to materially dent the transmission of monetary policy to the real economy.
Three findings emerge from our analysis. First, the size of the MMF industry is at record levels and the dollar looms large in AUM. As of September 2023, US MMF – which can only lend in dollars – held $6.1 trillion in AUM. By comparison, total commercial bank assets in the United States stood at $23 trillion. MMFs domiciled outside the United States ("non-US MMFs") held an additional $1.2 trillion in AUM, with 60% in US dollars and the rest mostly in euros and pounds.
Second, besides governments, banks are MMFs' main borrowers by a wide margin. In an average month, over half of all US MMF lending is to the private sector ($1.8 trillion), of which 90% goes to banks, only 7% to other NBFIs and 3% to NFCs. Non-US MMF lending is even more skewed towards banks. In terms of instruments, repurchase agreements (repos) have become the primary means of bank and NBFI borrowing from MMFs. NFCs borrow almost exclusively through commercial paper (CP). Box A explores borrowing by Federal Home Loan Banks (FHLBs), which provide a roundabout way for MMFs to fund other banks when funding conditions are tight. Box B examines the role of the Fixed Income Clearing Corporation (FICC), which does not fund NFCs but supports arbitrage trades by leveraged funds.
Key takeaways
- With more than $9 trillion in assets under management (AUM) globally, money market funds (MMFs) are key players in short-term funding markets, especially in US dollars.
- Other than to governments, MMFs primarily lend to banks, while their lending to other non-bank financial institutions (NBFIs) and non-financial corporates is an order of magnitude smaller.
- When monetary policy tightens, MMFs deploy almost the entire increase in their AUM as funding to governments and banks and do not finance any material credit expansion by other NBFIs.
Third, the AUM of MMFs increase during episodes of monetary policy tightening and banks absorb significantly more of these MMF inflows than NBFIs. Focusing on the United States, we find that when policy rates rise, AUM increases by about 34 cents for every dollar decline in bank deposits. More than half of this increase in AUM is allocated to governments, nearly 40% is absorbed by banks and only 3–4% by other NBFIs. Thus, while NBFIs may counteract some of the contraction in bank lending to the real economy during monetary tightening, our findings imply that the offset is not financed by MMFs, contrary to what is assumed in the literature.2
The rest of the article is structured as follows. The first section provides background on MMFs and their borrowers. The second section discusses patterns in borrowing from MMFs by governments, banks, NBFIs and NFCs. The third section explores the link between policy rates and borrowing from MMFs. The conclusion discusses policy implications.
Background on MMFs and their borrowers
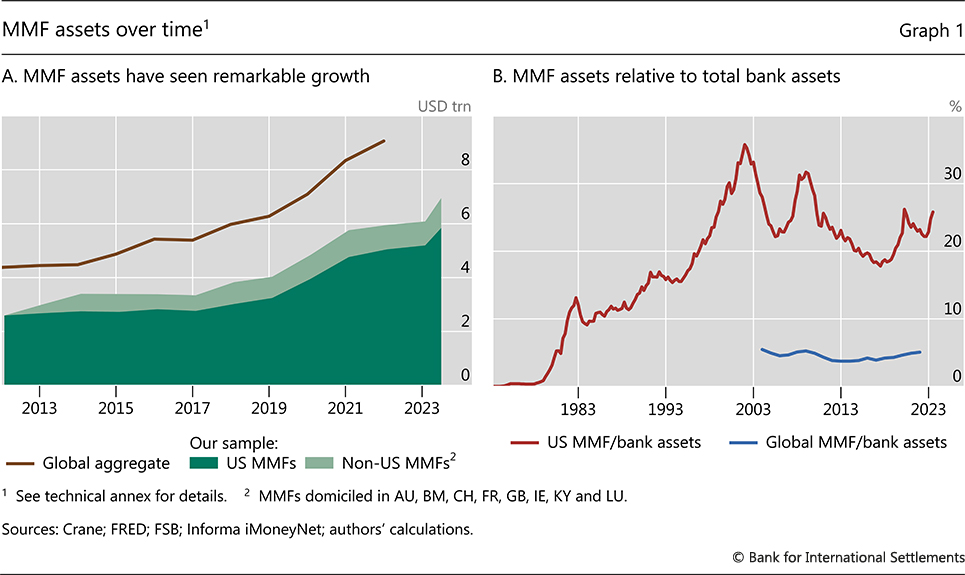
MMFs are open-ended collective investment funds that invest in short-term instruments and seek to maintain stable share prices.3 MMFs provide investors with a money-like asset while offering funding to governments (by purchasing securities) and the private sector (largely through repos, certificates of deposit (CD) and CP). What all borrowers have in common is a high credit standing, as regulation requires MMFs to invest in high-quality and low-risk instruments. Data from the Financial Stability Board (FSB (2022)) show that global MMF AUM stood at around $9 trillion as of end-2021 (Graph 1.A, brown line).
Our analysis draws on two data sets on the portfolio holdings of MMFs, offering up-to-date coverage of around two thirds of the global market.4 The first, Crane, encompasses US MMFs' monthly investments from February 2011 to September 2023 (Graph 1.A, dark green area). The second, iMoneyNet, includes the monthly investments of non-US MMFs from January 2013 to September 2023 (light green area).5 We observe the identity of lending funds and borrowers as well as information on amounts and instruments used. The AUM of US and non-US MMFs amount to $6.1 trillion and $1.2 trillion, respectively, as of September 2023. Together they represent, on average, about 67% of the global total when the series overlap.
Long-run aggregate data help to put MMFs' importance into perspective over the past decades (Graph 1.B). Relative to total US commercial bank assets, US MMFs' AUM increased from less than 10% in the 1980s to about 25% today (red line). Globally, the ratio of MMF to bank assets hovered around 4% (blue line).
The MMF industry played a prominent role in, and was reshaped by, the Great Financial Crisis (Kacperczyk and Schnabl (2013)). In response to the crisis, regulatory reforms were introduced to enhance the stability of MMFs while maintaining funds' flexibility to meet investor needs. In particular, the 2016 US MMF reform reduced the scope of MMFs to provide unsecured funding.6
We use our data on borrower entities to classify all MMF counterparties into four groups: government entities, banks, other NBFIs and NFCs. Government entities are mostly treasury departments (most notably the United States Department of the Treasury). In the United States, the central bank also borrows through its overnight reverse repo facility (ON RRP).7 Banks are mostly large and highly rated bank holding companies. NBFIs include a clearing house (FICC), insurance companies, asset managers and special purpose vehicles that specialise in securitisation and asset-backed commercial paper (ABCP).8 Finally, NFCs are large global companies from various industries.9
Who borrows from MMFs and how?
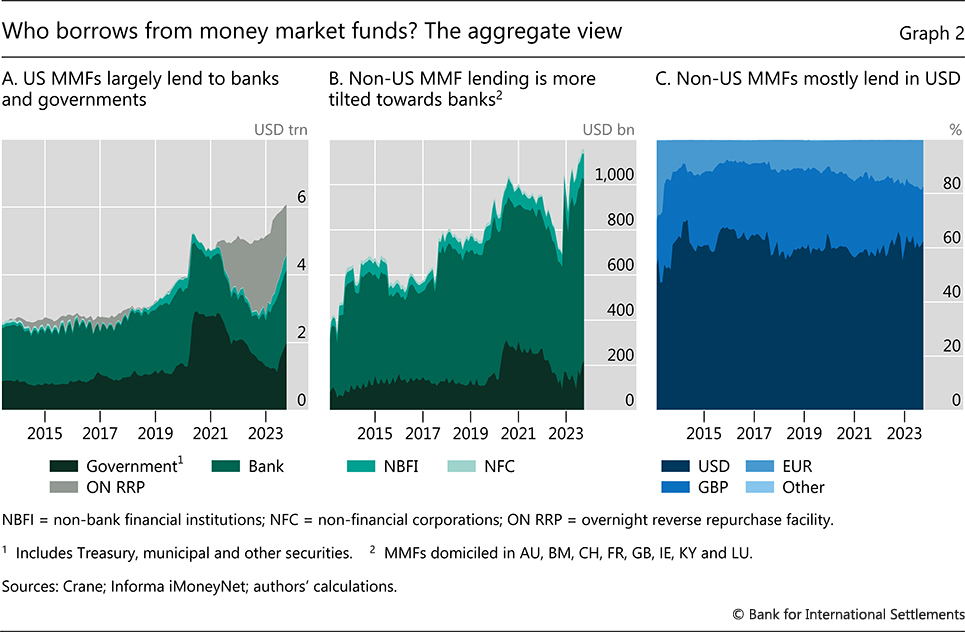
In the United States, MMFs – which hold their AUM only in US dollars – mostly fund banks and governments (Graph 2.A). Banks are the largest borrowers on average – accounting for around two thirds of the total – and the rest goes mostly to governments. Investments in government securities grew sharply with the outbreak of Covid-19 (Eren et al (2020)) and positions at the ON RRP gained prominence starting in 2021 (Morgan et al (2022), Doerr et al (2023)). In turn, borrowing by NBFIs and NFCs together accounted for around 5% on average.
Outside the United States, MMF investments are even more tilted towards banks. Among non-US MMFs, banks account on average for over 70% of total borrowing (Graph 2.B). NBFIs and NFCs again account for only a small share. Virtually all lending by non-US MMFs is done in pounds, euros and dollars, with the latter accounting for 60% on average (Graph 2.C).
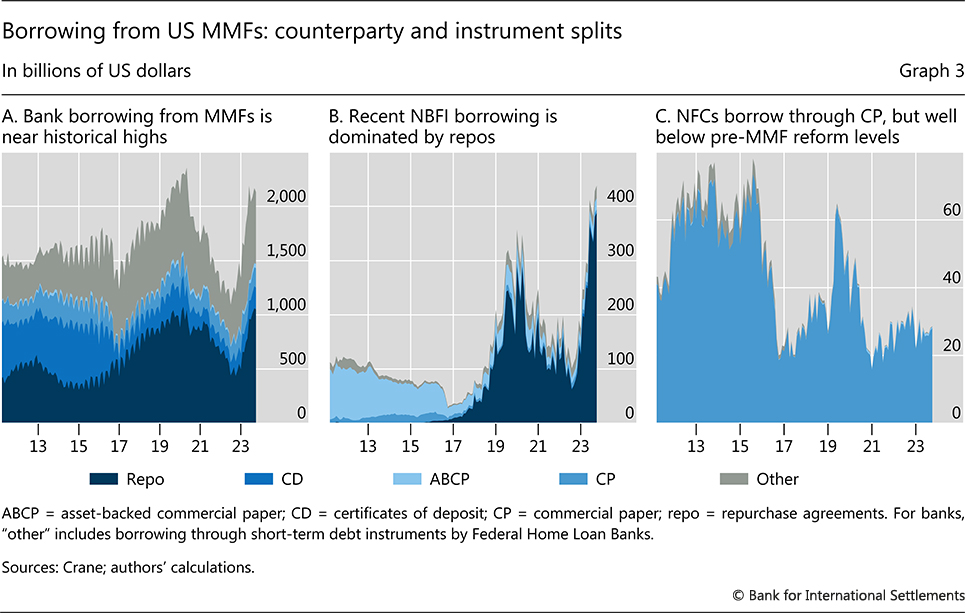
Banks, NBFIs and NFCs differ markedly in the instruments they use to borrow from US MMFs. The composition of bank borrowing has shifted from unsecured (ie CP and CD) borrowing towards repos (Graph 3.A), especially after the October 2016 reform. Borrowing through short-term debt instruments by FHLBs (part of "other" in Graph 3) can at times be substantial (Box A). For NBFIs, ABCP conduits were the main instrument of borrowing up until 2017 but have since been replaced by repo (Graph 3.B). The lion's share of NBFI repo borrowing is explained by the FICC, which likely funds arbitrage trades by leveraged funds (Box B). Finally, NFCs borrow almost exclusively through CP (Graph 3.C).10
Monetary policy transmission through NBFIs revisited
We now explore the link between monetary policy and borrowing from MMFs. Seminal work on the United States shows that monetary policy tightening leads to deposit outflows (in particular of checking and savings account deposits) and a contraction in bank lending to the real economy (Drechsler et al (2017)). Meanwhile, money flows into MMFs (Xiao (2020)). Follow-up work argues that, during tightening cycles, MMFs increase their lending to other NBFIs (such as mortgage companies, fintech lenders, hedge funds or investment companies), which in turn lend more to the real economy. Because of this supposedly increased funding through MMFs, the argument goes, other NBFIs offset the reduction in banks' credit supply to a significant extent when monetary policy tightens. Yet previous work categorised MMF borrowers (ie banks, NBFIs or NFCs) on the basis of the funding instruments, as it drew on data that did not reveal the actual borrowing entity. This left untested the crucial assumption that MMFs finance the credit expansion by other NBFIs during monetary tightening.11
To investigate whether MMFs actually increase lending to other NBFIs when monetary policy tightens, we proceed in two steps. First, we estimate how much bank deposits and MMF AUM change during a typical tightening cycle. Second, we calculate the extent to which different counterparties absorb the overall increase in AUM. The analysis uses aggregate US data provided by FRED and US MMF data by Crane.
Graph 4 provides a first glance at the relationship between policy rates, bank deposits and MMF AUM. It shows a negative correlation between the federal funds rate (FFR) and checking and savings account deposit growth (Graph 4.A) and a positive correlation between the FFR and AUM growth (Graph 4.B). These patterns are consistent with liquid deposits moving out of banks and into MMFs during tightening cycles.12
To estimate the sensitivity of deposits and AUM to changes in the FFR, we follow Xiao (2020) and estimate the following regression at the quarterly frequency:

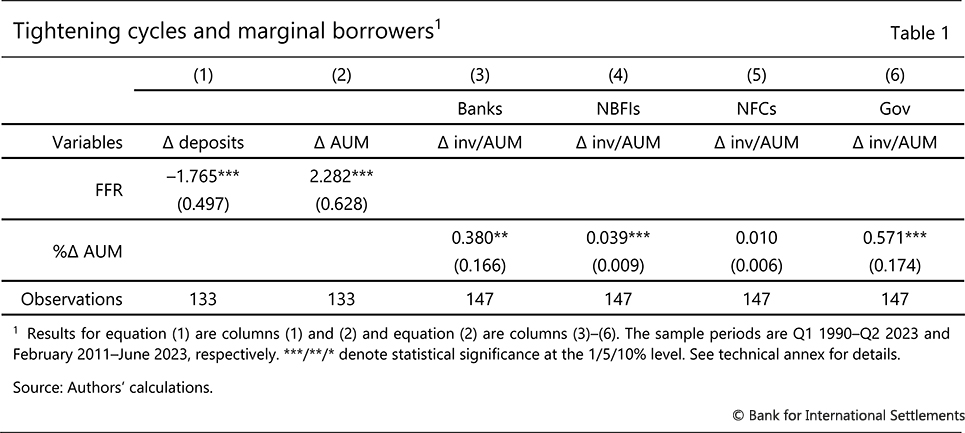
The dependent variable Δyt is the year-on-year growth rate of either total checkable and savings deposits at commercial banks or of total MMF AUM in quarter t. The explanatory variable ΔFFRt is the cumulative three-year change in the federal funds rate. To account for macroeconomic developments, the regression controls for GDP growth, inflation and the growth in corporate cash holdings. The sample period is Q1 1990–Q3 2023. Based on Drechsler et al (2017) and Xiao (2020) we expect βdeposits < 0 and βAUM > 0.
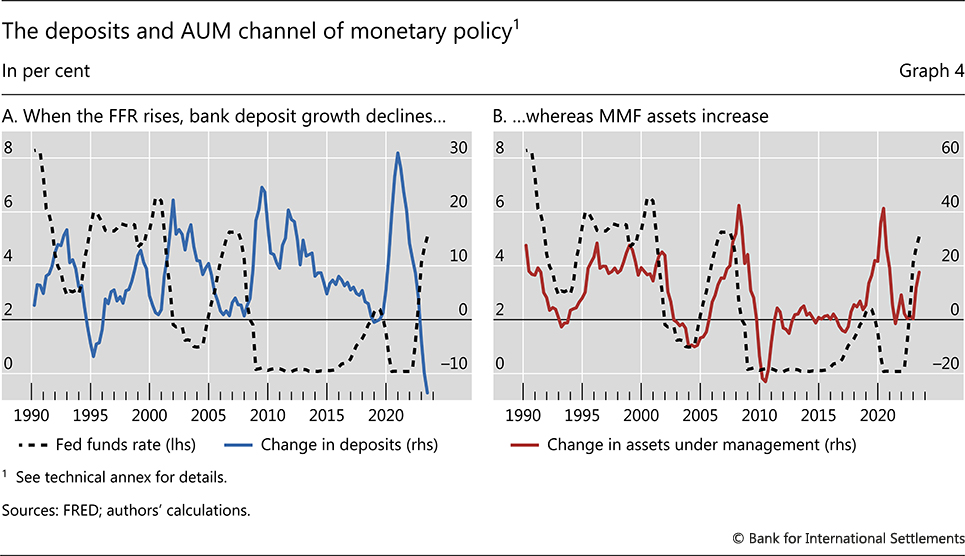
Table 1 reports results in line with expectations. For a 100 basis point (bp) cumulative increase in the FFR, deposits decline by 192 bp (column (1)).13 As shown in Drechsler et al (2017), banks' credit supply declines by about two thirds of the decline in deposits. The link between deposits and loan growth echoes findings in a long-established literature and reflects the unique role of deposits as a cheap source of funding that cannot be easily substituted with wholesale financing (Kashyap et al (2002), Gatev and Strahan (2006), Hanson et al (2015)). Column (2) shows that AUM increase by 187 bp when the FFR increases by 100 bp. As argued by Xiao (2020) among others, MMFs supposedly pass this funding on to other NBFIs.
Further reading
But do MMFs use their additional funds to finance other NBFIs, and if so, at what scale? To understand how MMF funding of different counterparty sectors (banks, NBFIs, NFCs and governments) moves with changes in AUM, we investigate who the marginal borrowers are. We follow Fang et al (2023) and regress a standardised change in MMF funding to sector s on the percentage change in total AUM:

Since total AUM must be absorbed by some counterparty sector, the estimated coefficients as in equation (2) sum to one. Each coefficient hence reflects the allocation of a marginal change in total AUM to counterparty sector s.
Banks are much more important "absorbers" of AUM than NBFIs and NFCs. For every additional dollar of AUM, on average 38 cents are absorbed by banks (Table 1, column (3)). NBFIs and NFCs absorb an order of magnitude less, 3.9 cents and 1 cent, respectively (columns (4) and (5)). For NFCs, the effect is statistically insignificant. The large remainder, or 57 cents of every additional dollar of AUM, is invested in Treasuries or the ON RRP (column (6)).14
We can combine the estimates in Table 1 to obtain aggregate changes in deposits and AUM. First, our estimates imply that a typical 400 bp tightening cycle reduces deposits by about 770 bp. In 2022, checkable and savings (total) deposits stood at $14 ($18) trillion, so our estimates imply a reduction of about $1.1 trillion ($1.4 trillion).15 For MMFs, AUM stood at $5 trillion in 2022. Our estimates imply an increase in AUM of about 750 bp, or $375 billion, of which about $142 billion (38%) goes to banks. In addition, only $15 billion (4%) flows to NBFIs, much less than a typical decline in bank credit supply during a tightening cycle, which averages about two thirds of the $1.1 trillion deposit decline (Drechsler et al (2017)).
These findings have implications for the interpretation of previous studies on how NBFIs affect monetary policy transmission. To the extent that other NBFIs offset some of the reduction in banks' credit supply during monetary tightening (thereby weakening monetary policy transmission), our results suggest that this is not because of increased borrowing from MMFs. Instead, we find that banks partly offset the reduction in relatively cheap deposits with – typically costlier – short-term funding from MMFs, consistent with Choi and Choi (2020). However, as higher funding costs stymie bank lending (Bernanke and Blinder (1988), Gertler and Gilchrist (1994)), the partial substitution in banks' funding mix is unlikely to fully offset the decline in their credit supply during monetary tightening.
Conclusion
This article documents that MMFs, a key player in short-term funding markets, primarily fund banks and governments. Moreover, within the private sector, banks are the main absorbers of increases in MMFs' AUM when policy rates rise. These stylised facts have implications for the academic literature and for policy.
First, recent academic work has studied the role of NBFIs in monetary policy transmission. This work has established that NBFIs other than MMFs offset part of the contraction in bank lending to the real economy when policy rates rise. Our findings reveal one purported underlying channel to be negligible – namely, that these NBFIs finance their credit expansion with credit from MMFs. There is therefore a need to revisit the interpretation of previous results, especially with regard to the role of the MMF sector in affecting the transmission of monetary policy.
Second, the banking turmoil of March 2023 has once again turned attention to the stability of deposit funding in a context of sharp monetary tightening. Our findings suggest that banks with access to MMFs, ie mostly larger banks, would tend to counteract some of the decline in deposits during tightening cycles.
References
Afonso, G, L Logan, A Martin, W Riordan and P Zobel (2022): "How the Fed's overnight reverse repo facility works", Liberty Street Economics, January.
Allen, F and A Walther (2021): "Financial architecture and financial stability", Annual Review of Financial Economics, vol 13, pp 129–51.
Anadu, K and V Baklanova (2017): "The intersection of US money market mutual fund reforms, bank liquidity requirements, and the federal home loan bank system", OFR Working Paper, no 1705.
Ashcraft, A, M Bech and W Frame (2010): "The federal home loan bank system: the lender of next-to-last resort?", Journal of Money, Credit and Banking, vol 42, no 4, pp 551–83.
Avalos, F and V Sushko (2023): "Margin leverage and vulnerabilities in US Treasury futures", BIS Quarterly Review, September.
Avalos, F and D Xia (2021a): "Investor size, liquidity and prime money market fund stress", BIS Quarterly Review, March.
Avalos, F and D Xia (2021b): "Stress in European money market funds at the outbreak of the pandemic", BIS Quarterly Review, September.
Barth, D, R Kahn and R Mann (2023): "Recent developments in hedge funds' Treasury futures and repo positions: is the basis trade "back"?", FEDS Notes, August.
Bernanke, B and A Blinder (1988): "Credit, money, and aggregate demand", American Economic Review, vol 78, pp 435–39.
Bouveret, A, A Martin and P McCabe (2022): "Money market fund vulnerabilities: a global perspective", FEDS Working Papers, no 12.
Choi, DB and HS Choi (2020): "The effect of monetary policy on bank wholesale funding", Management Science, vol 67, no 1, pp 388–16.
Cucic, D and D Gorea (2022): "Nonbank lending and the transmission of monetary policy".
Doerr, S, E Eren and S Malamud (2023): "Money market funds and the pricing of near-money assets", BIS Working Papers, no 1096.
Drechsler, I, A Savov and P Schnabl (2017): "The deposits channel of monetary policy", The Quarterly Journal of Economics, vol 132, no 4, pp 1819–76.
Duguid, K, C Mourselas and O Aliaj (2023): "The debt-fuelled bet on US Treasuries that's scaring regulators", Financial Times, 26 September.
Dunbar, N (2023): "Don't worry about money market funds", Financial Times, 23 October.
Elliott, D, R Meisenzahl, J-L Peydro and B Turner (2022): "Nonbanks, banks, and monetary policy: US loan-level evidence since the 1990s", Federal Reserve Bank of Chicago Working Papers, no 2022-07.
Elliott, D, R Meisenzahl and J-L Peydro (2023): "Nonbank lenders as global shock absorbers: evidence from US monetary policy spillovers", Bank of England Working Paper, no 1012.
Eren, E, A Schrimpf and V Sushko (2020): "US dollar funding markets during the Covid-19 crisis – the money market fund turmoil", BIS Bulletin, no 14, May.
Fang, X, B Hardy and K Lewis (2023): "Who holds sovereign debt and why it matters", BIS Working Papers, no 1099.
Financial Stability Board (FSB) (2022): "Global monitoring report on non-bank financial intermediation 2022", December.
Gatev, E and P Strahan (2006): "Banks' advantage in hedging liquidity risk: theory and evidence from the commercial paper market, The Journal of Finance, no 61, no 2, pp 867–92.
Gertler, M and S Gilchrist (1994): "Monetary policy, business cycles, and the behavior of small manufacturing firms", The Quarterly Journal of Economics, vol 109, no 2, pp 309–40.
Gissler, S and B Narajabad (2017): "The increased role of the Federal Home Loan Bank System in funding markets, part 1: background", FEDS Notes, October.
Gissler, S, B Narajabad and D Tarullo (2023): "Federal Home Loan Banks and financial stability", Journal of Financial Regulation, vol 9, no 1, pp 1–29.
Hanson, S, A Shleifer, J Stein and R Vishny (2015): "Banks as patient fixed-income investors", Journal of Financial Economics, vol 117, no 3, pp 449–69.
Kacperczyk, M and P Schnabl (2013): "How safe are money market funds?", The Quarterly Journal of Economics, vol 128, no 3, pp 1073–122.
Kashyap, A, R Rajan and J Stein (2002): "Banks as liquidity providers: an explanation for the coexistence of lending and deposit-taking", The Journal of Finance, vol 57, no 1, pp 33–73.
Morgan, L, A Sarver, M Tase and A Zlate (2022): "Bank deposit flows to money market funds and ON RRP usage during monetary policy tightening", Finance and Economics Discussion Series, no 60.
Xiao, K (2020): "Monetary transmission through shadow banks", The Review of Financial Studies, vol 33, no 6, pp 2379–420.
Technical annex
Graph 1.A: Global aggregate based on total financial assets of money market funds across a global sample of 29 jurisdictions covering about 90% of global GDP, as collected in FSB (2022).
Graph 1.B: US MMF/bank assets based on aggregate data for US domiciled MMFs and banks, sourced respectively from FRED Table Z1 in Financial Accounts of the United States and Table H8 Assets and Liabilities of Commercial Banks in the United States. Global MMF/bank assets based on the global aggregate of MMF assets provided by the FSB (see the note to Graph 1.A) and the corresponding number for total global bank assets (obtained from the same source).
Graph 4.A: Federal funds rate based on the effective federal funds rate, sourced from FRED Table H15 Selected Interest Rates. Change in deposits based on the sum of total savings and checkable deposits, sourced from FRED Tables H6 and Z1 in the Financial Accounts of the United States.
Graph 4.B: Federal funds rate as in the note to Graph 4.A. Change in assets under management based on aggregate data for US-domiciled MMFs, sourced from FRED Table Z1 in the Financial Accounts of the United States.
Table 1: Estimations in columns (3)-(6) are based on the methodology of Fang et al (2023). Standard errors are robust to arbitrary heteroskedasticity and autocorrelation with a lag structure of 12 months.
1 We thank Douglas Araujo, Claudio Borio, Gaston Gelos, Bryan Hardy, Peter Hoerdahl, Benoit Mojon, Andreas Schrimpf, Hyun Song Shin, Nikola Tarashev and Kevin Tracol for helpful comments and suggestions, and Albert Pierres Tejada and Henry Williams for outstanding research assistance. The views expressed are those of the authors and do not necessarily reflect those of the Bank for International Settlements.
2 For evidence on expanding NBFI lending to the real economy during monetary tightening, see Elliott, Meisenzahl, Peydro and Turner (2022) and Cucic and Gorea (2022). For arguments on MMFs financing other NBFIs' credit expansion, see Xiao (2020), Allen and Walther (2021), Elliott, Meisenzahl, Peydro and Turner (2022) and Elliott, Meisenzahl and Peydro (2023), among others.
3 See Bouveret et al (2022) and Avalos and Xia (2021a,b) for background on MMFs.
4 The remainder is, to a large extent, accounted for by local currency-denominated MMFs located outside the United States, which have grown substantially in recent years (FSB (2022)).
5 Funds in Ireland, Luxembourg and the Cayman Islands have the highest AUM shares (54%, 31% and 14%, respectively).
6 The reform led to the conversion of some prime funds, which can extend unsecured lending to firms, into government funds, which can extend lending to firms only via repos with high-quality collateral (Bouveret et al (2022)).
7 The ON RRP offers money market lenders (primary dealers, banks, MMFs and government sponsored entities) the possibility to invest cash overnight on a collateralised basis (against Treasury collateral). In practice, however, it is mostly used by MMFs (Afonso et al (2022)).
8 Insurance companies include Prudential plc and MetLife, asset managers include Federated and BlackRock, and ABCP conduits include Antalis US Funding Co, among many others.
9 For example conglomerates (eg Procter and Gamble and Unilever), automotive companies (eg Toyota and BMW), energy companies (eg ExxonMobil and Chevron), pharmaceutical companies (eg Novartis and Pfizer) and retailers (eg Walmart).
10 For non-US MMFs patterns differ somewhat. For banks, CP and CD have consistently played a large role, accounting for close to two thirds of the total. For NBFIs, repo borrowing has increased in importance, but ABCP remains the main funding instrument.
11 Using a structural model, Xiao (2020) argues that for every dollar of reduced bank lending when the FFR rises, other NBFIs increase lending by 33 cents because they receive more funding from MMFs. To quantify MMF lending to other NBFIs, the analysis adds up CP, ABCP, repos and short-term notes to argue that 62% of MMFs' portfolio can be attributed to lending to these NBFIs. Elliott, Meisenzahl, Peydro and Turner (2022) and Elliott, Meisenzahl and Peydro (2023) provide US and international evidence that NBFIs expand relative to banks during tightening cycles. To explain their findings they also refer to MMF funding.
12 The decline in checking and savings account deposits can reflect various factors, such as loan repayments, reduced credit demand or a change from retail deposits to other types of wholesale funding.
13 More specifically, we assume that the FFR transitions from an initial period of no change to a cumulative increase of 100 bp.
14 Excluding 2020–23 from the sample, the respective numbers in columns (3)–(6) are 64%, 3%, 2% and 31%. For non-US MMFs' lending in US dollars, the numbers are 72%, 4%, 3% and 21%.
15 Estimates are similar in Xiao (2020) and Drechsler et al (2017)