I. Navigating the disinflation journey

![]() Watch the video (00:02:08)
Watch the video (00:02:08)
with Agustín Carstens, General Manager
Listen to the podcast (00:20:05)
with Agustín Carstens
Key takeaways
- Inflation peaked in most jurisdictions, but remains well above target. The global economy slowed, although it proved more resilient than many had expected. Clear signs of stress appeared in the financial system.
- There are two key risks to the outlook. First, the next phase of disinflation may become more difficult. Second, macro-financial vulnerabilities loom large amid historically high debt levels at the end of the low-for-long interest rate era.
- Returning inflation to target remains a priority. Fiscal policy should play a key supporting role for monetary policy. In addition, prudential policy should strengthen the financial system further. Weaning growth away from excessive reliance on macro-stabilisation policies is crucial to achieving price and financial stability as a basis for robust, sustainable growth.
The global economy withstood strong headwinds better than expected over the past year. Inflation edged down, as disruptions in global supply chains and in commodity markets waned. Growth slowed, although it proved resilient.
At the same time, signs of strain started to emerge. In particular, financial stress rattled the financial system, engulfing both banks and non-bank financial intermediaries (NBFIs) and prompting a forceful policy response to limit contagion. The strains share a common cause: the system is under stress following the era of low-for-long interest rates. Several strategies adopted to take advantage of that era are now proving ill-suited to the new environment. The strains are also a reminder of the tight monetary-fiscal-financial nexus, as the increase in government bond yields played a key role here.
Even stronger headwinds may lie ahead. Despite the most synchronised and intense monetary policy tightening in recent memory, inflation remains far too high. And there is a material risk of further financial stress.
The next phase of disinflation is likely to be more difficult. Mechanically, base effects are fading away. Substantively, inflation is increasingly driven by the more inertial components, particularly services. The longer inflation lasts, the more likely it is that households and firms will adjust their behaviour and reinforce it.
There are widespread macro-financial vulnerabilities in the system. Private and public debt levels are historically high. Asset prices, notably those of real estate, have started softening on the back of rich valuations. Interest rates may need to stay higher and for longer than financial markets are pricing in. The strains that have emerged so far reflect interest rate risk, but credit losses are still to come. This will further test the resilience of the financial system.
Four major policy challenges stand out. First, monetary policy needs to travel the last mile, bringing inflation back to target. Second, fiscal policy needs to support short-term stabilisation and ensure sustainability. Third, prudential and supervisory policies need to safeguard financial stability, thereby supporting the macroeconomic adjustment. Last but not least, policymakers need to wean growth away from excessive reliance on macro-stabilisation policies and bring monetary and fiscal policies firmly back into a "region of stability" (Chapter II takes a closer look at this challenge).
This chapter first describes the key economic and financial developments over the past year. It then discusses the main macroeconomic and financial risks. Finally, it elaborates on the policy challenges.
The year in retrospect
Inflation moderates, but too early to declare victory
After making a remarkable comeback, inflation continued to be a major policy concern in the year under review (Graph 1). Its persistence was systematically underestimated by public and private sector institutions alike. To be sure, headline inflation came down from the peaks reached in 2022, falling quite notably in most cases. But core inflation proved stickier, either stabilising or continuing to rise. Almost everywhere, inflation remained well above inflation targets. And, importantly, its drivers shifted as the year progressed, with the more inertial components gaining ground.
Lower headline inflation reflected, to some extent, both one-off factors and what, in principle, are temporary measures. Strong base effects kicked in, dragging down year-on-year readings. Commodity prices retreated from the highs induced by the war in Ukraine (Graph 2.A). As a result, contributions to inflation from energy and food shrank (yellow bars in Graph 1). In addition, the direct impact of some fiscal measures designed to curb increases in these prices mechanically helped to keep inflation down in the near term.1 The size of the support reached 3% of GDP in some cases. That said, this impact could be reversed should the measures be phased out as planned and, in the case of cap-based measures, if the price of the subsidised commodities were to rise again. And, in the meantime, the support prevented aggregate demand from falling, thereby contributing to tight product and labour markets.
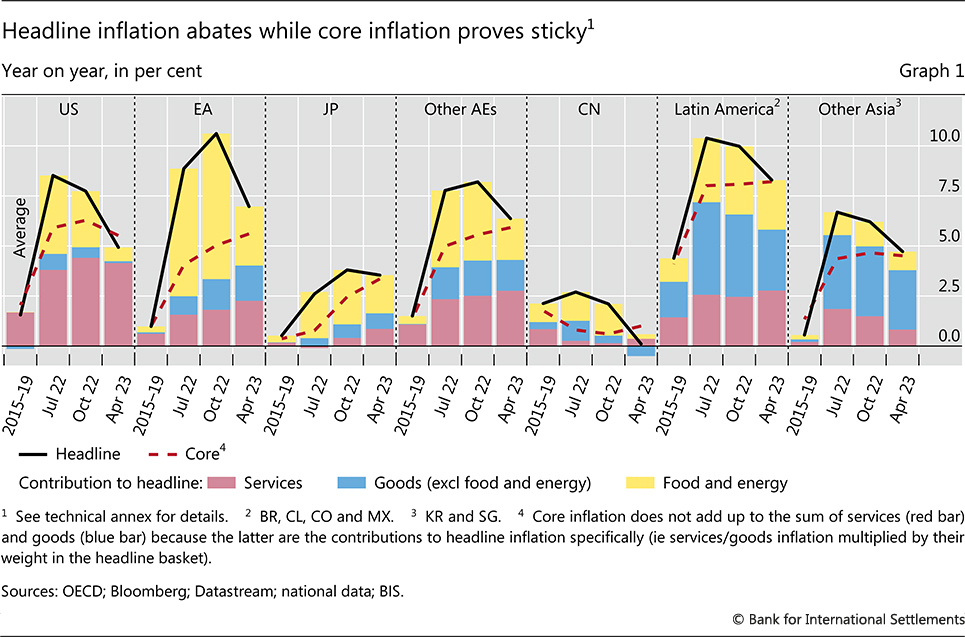
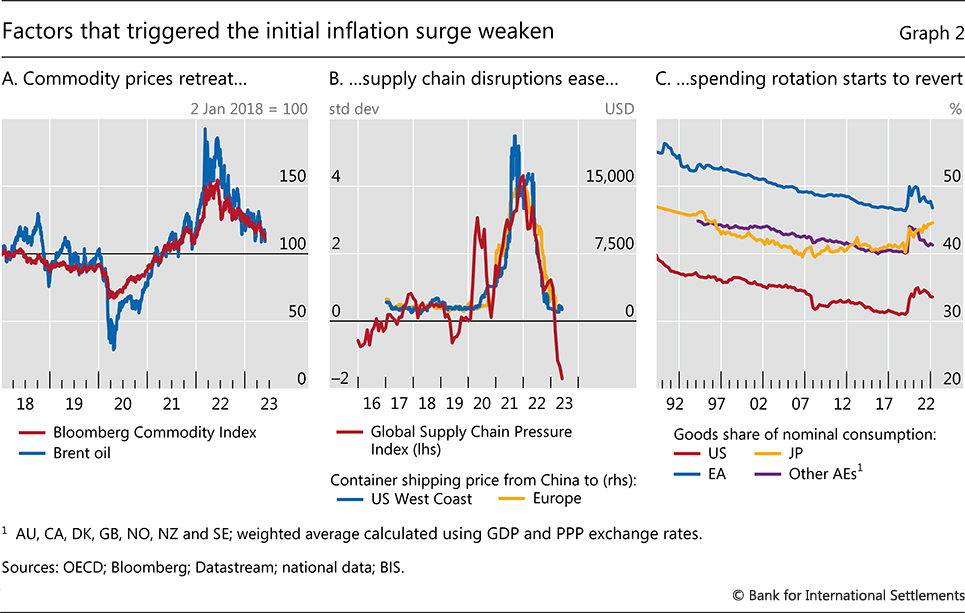
A longer-lasting amelioration came from easing global supply chain pressures, which largely normalised, allowing backlogs to be cleared (Graph 2.B). This affected primarily the prices of goods, which are much more heavily traded than services. These prices tended to rise more slowly and, in some cases, actually fell (blue bars in Graph 1). The pressure on goods prices was also eased by the ongoing reversion of the pandemic-related shift in consumption patterns away from services to goods (Graph 2.C).
That same rotation, however, boosted services price growth, which continued to rise (red bars in Graph 1). In the United States, the services component once again became the main factor behind inflation. Its contribution also slowly rose in other advanced economies (AEs) and in Latin America.
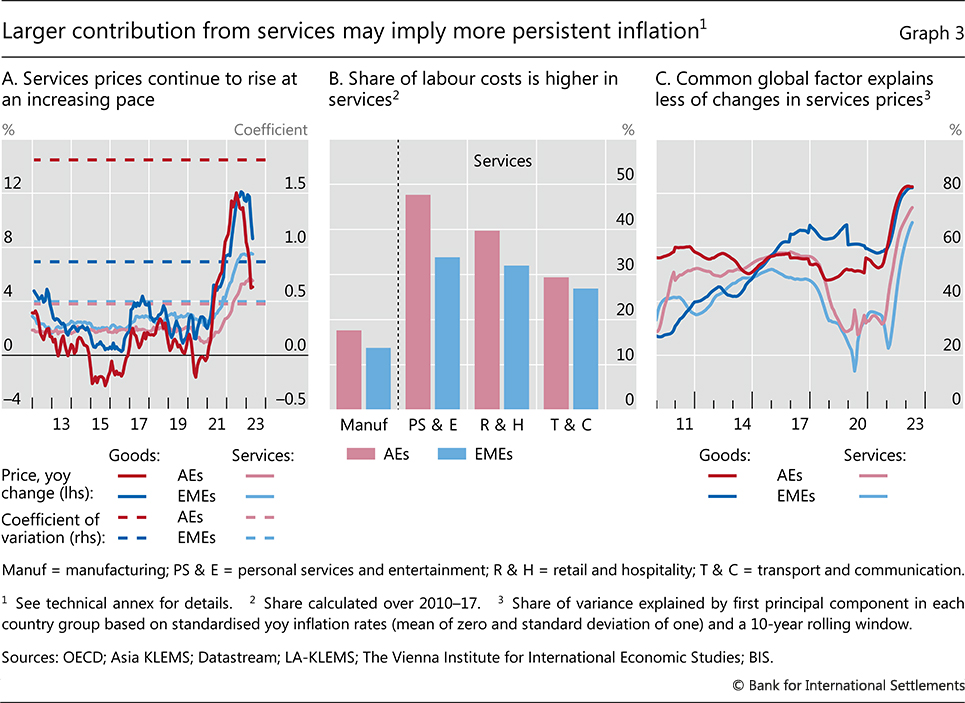
This shift in drivers of inflation towards services is likely to increase its persistence. The rate of change in services prices has historically been much less volatile than that for goods (dotted lines in Graph 3.A). Part of the explanation is that the share of labour in total costs in services is about twice as large as in manufacturing (Graph 3.B). This tightens the link between prices and wages. Not only are wage increases in general more inertial than other cost components, but they also tend to be more domestically driven in services, as the sector is less exposed to international competition. Indeed, the fraction of the variance of price changes explained by a global common factor has generally been lower for services, although it has risen recently owing to the widespread nature of the inflation surge (Graph 3.C).
Synchronised monetary tightening ends low-for-long
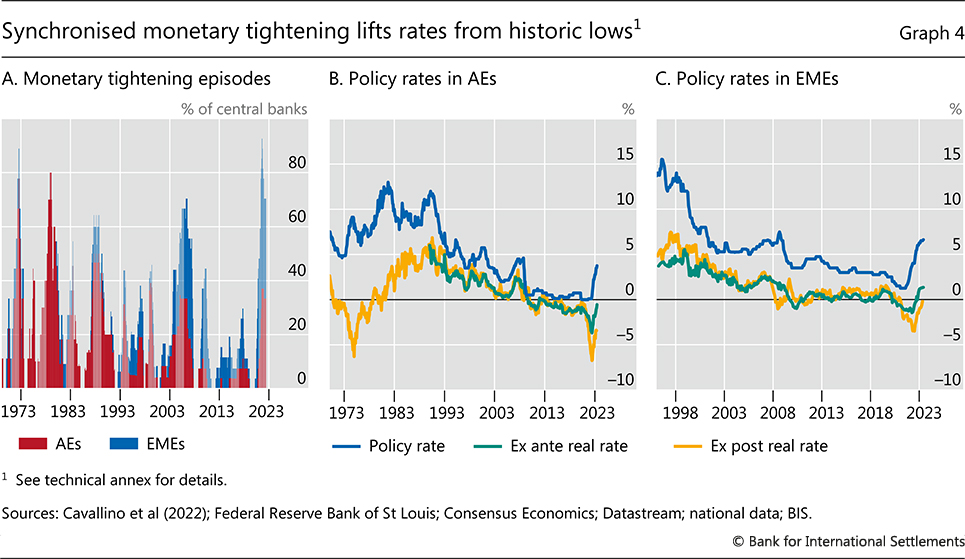
The inflation surge has led to the most synchronised and intense monetary policy tightening in decades.2 Almost 95% of central banks hiked their policy rates between early 2021 and mid-2023 (Graph 4.A). Historically, this share has rarely exceeded 50%, surpassing 80% only during the oil price shocks of the 1970s. Emerging market economy (EME) central banks raised policy rates at twice the historical pace, and AE central banks at a roughly similar one.3 4 Even so, policy rates are still below inflation and, in some AEs below inflation expectations, implying negative real rates (Graph 4.B and 4.C). At the same time, major AE central banks started to gradually shrink their balance sheets, with Japan as the exception. Quantitative easing turned into quantitative tightening.
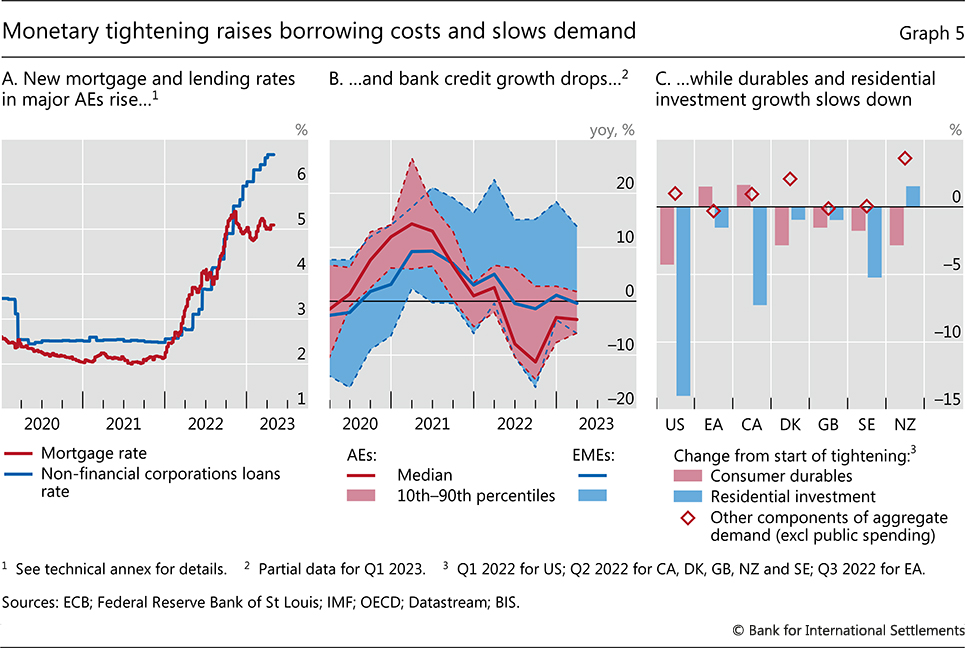
The transmission of monetary tightening to lending rates was mostly swift and began to weigh on aggregate demand. Borrowing costs rose for corporates and households alike (Graph 5.A). Bank lending standards tightened and bank credit contracted, especially in AEs (Graph 5.B). Consequently, spending weakened. The deceleration was led by the most interest rate-sensitive components of expenditure, such as consumer durables, and the housing market cooled in many economies (Graph 5.C).
The economy slows, but manages to avoid recession so far
Overall, global growth slowed from 6.3% in 2021 to 3.4% in 2022, weakening further in the first quarter of 2023 (Graph 6.A). The slowdown was most pronounced in AEs, from 5.7 to 2.8%. EMEs fared better, still growing at 4% in 2022 as a whole compared with 7.3% in the previous year. This was despite China recording a growth rate of only 3%, reflecting setbacks from large Covid-19 outbreaks and the drag from the real estate sector.
Still, activity held up better than expected in a number of key jurisdictions, and the much feared global recession did not materialise. Relative to the forecasts made early in the review year, growth outcomes in 2022 surprised on the upside in the United States, the euro area and most EMEs, with China an exception to the pattern. As high-frequency indicators remained robust in many jurisdictions, growth forecasts for 2023 were revised upwards as the new year started, although the consensus still saw a considerable slowdown for the year as a whole, to 2.6%.
The relative strength of economic activity and the upgrade of expectations for 2023 reflected three main factors.
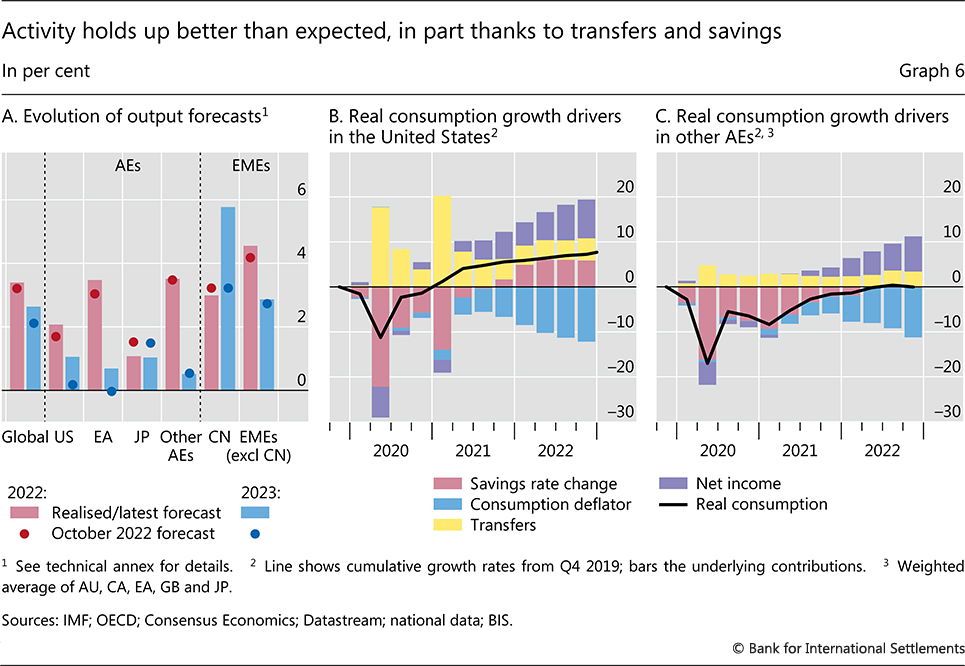
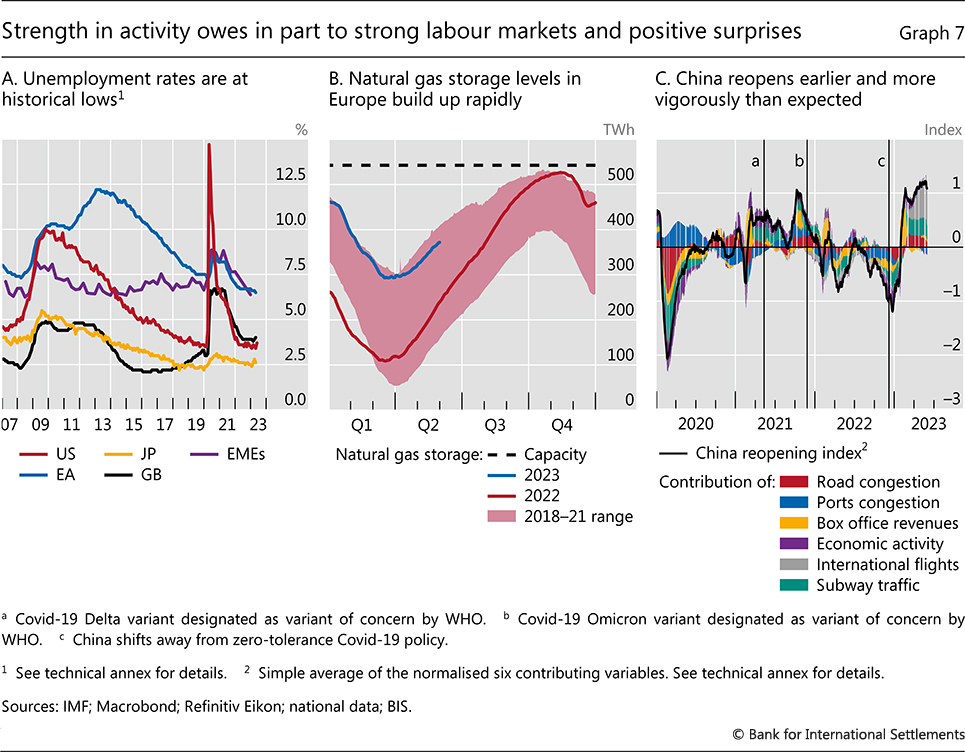
First, consumption remained robust. Excess savings accumulated during the pandemic, not least thanks to higher saving rates and fiscal support (red and yellow bars, respectively, in Graphs 6.B and 6.C). Once Covid-related restrictions were lifted, households drastically cut their saving rates, to pre-Covid levels in most AEs and to even lower ones in the United States. Further, buoyant labour markets bolstered income (purple bars in Graphs 6.B and 6.C). Unemployment rates fell to multidecade lows, especially in AEs (Graph 7.A). Job creation was strong in both AEs and EMEs while job vacancy rates remained high, around record levels in the United States and Europe.
Second, the energy crisis proved far less consequential than expected. A relatively mild winter and the rapid build-up of gas storage helped prevent the deep and widely forecast recession in Europe (Graph 7.B).5 And, in many jurisdictions, fiscal support insulated households and firms from the impact of higher energy prices.
Third, the rapid reopening of the Chinese economy in January, after the country abandoned its zero-Covid strategy in December 2022, boosted domestic activity (Graph 7.C). This also lifted activity abroad, although to a lesser extent than in the past, given the services-driven nature of the rebound (Box A).
Financial system shaken by bank failures
Financial markets and the financial system more generally started to adapt to the abrupt end of low-for-long interest rates but the process was far from smooth. A broad disconnect emerged between financial market pricing and central banks' announced policy path. And rising signs of stress appeared in the financial system.
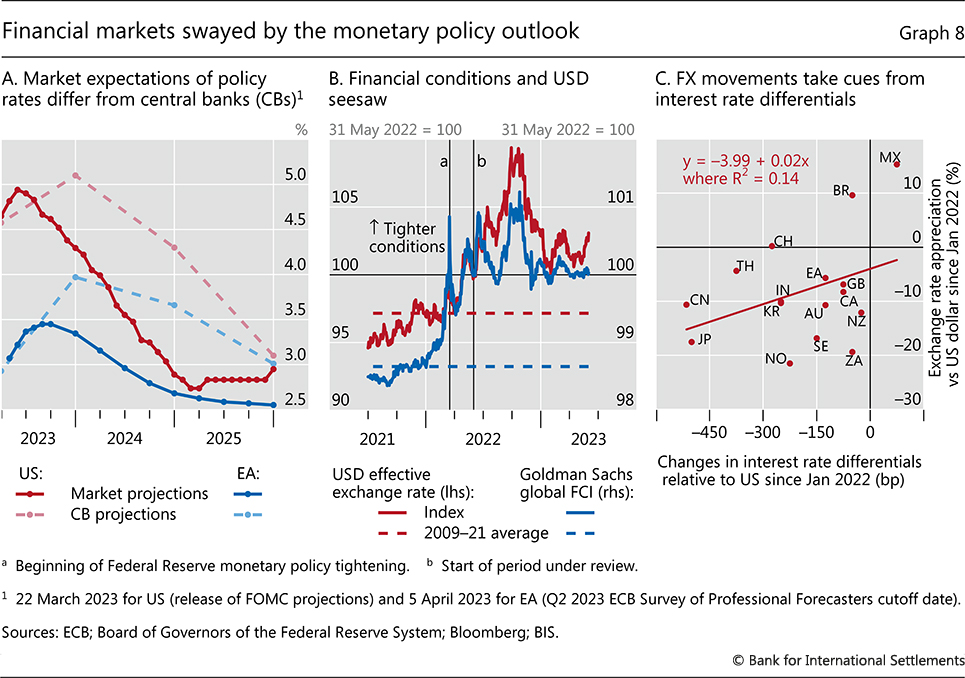
The disconnect between market expectations and central bank plans was evident in the dynamics of financial conditions. As markets were swayed by the shifting odds of inflation staying high and the economy entering a recession, participants continuously re-evaluated how central bank actions would evolve. Expectations of future rates remained lower than central banks' projections, with investors anticipating rate cuts already in 2023 (Graph 8.A). After considerable tightening in 2022, by some measures, financial conditions tightened marginally during the period under review (Graph 8.B). They remained tighter than historical averages.
Foreign exchange movements largely followed those of financial conditions, taking their cue from the relative strength of the economies and the corresponding monetary policy outlooks. The US dollar generally appreciated through the third quarter of 2022, before weakening moderately against most currencies. By and large, the depreciation against the dollar was larger for the currencies of countries where the policy rate increased less than in the United States. The Japanese yen and the euro touched multidecade lows. Countries where monetary tightening had started earlier and interest rates had reached higher levels, such as Mexico and Brazil, actually saw appreciations (Graph 8.C). In general, EMEs absorbed the sharp tightening of global monetary conditions in an orderly way.
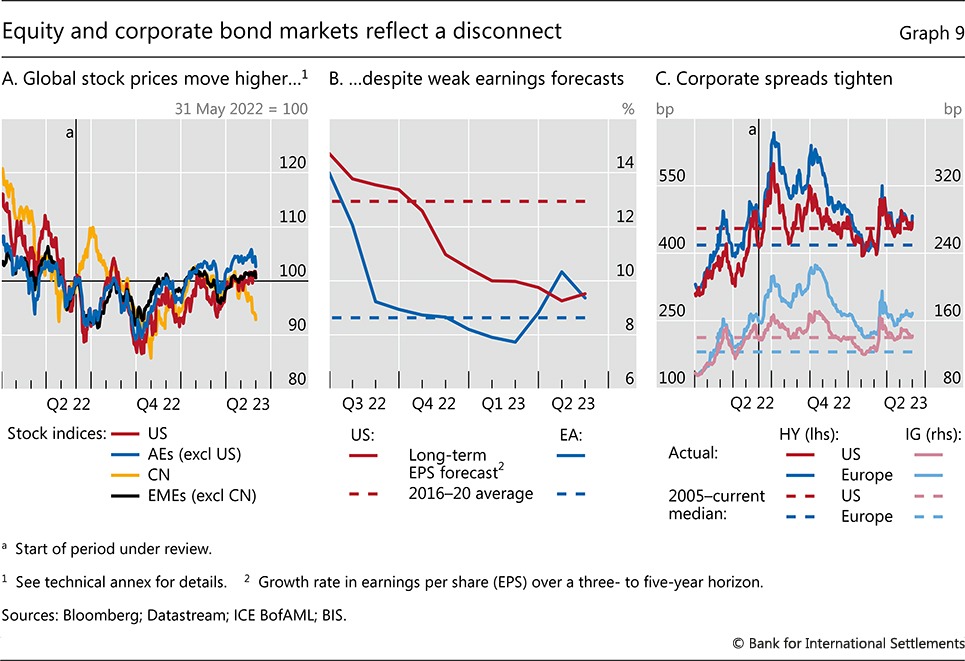
The disconnect between financial market expectations and central bank communications was also evident from the dynamics of risky assets. Equity markets finished the review period marginally higher (Graph 9.A), despite weak earnings forecasts, especially in the United States (Graph 9.B). Measures of implied equity volatility hovered below historical averages for most of 2023. In credit markets, spreads marginally tightened, remaining in line with historical norms in the United States and somewhat above in Europe (Graph 9.C).
Against this backdrop, increasing signs of stress emerged in the financial system in late 2022 and early 2023, in large part due to higher interest rates.
First, leveraged strategies to hedge against drops in interest rates came under pressure. As the UK "mini-budget" announcement in September 2022 sent gilt rates soaring, such strategies generated losses for the so-called liability-driven investment (LDI) funds in which UK pension funds had invested. To meet the ensuing collateral calls, LDI funds needed cash infusions, which pension funds failed to provide promptly enough. As their solvency positions worsened, LDI funds had to deleverage by selling gilts, putting further upward pressure on yields and setting off a full-fledged spiral. The Bank of England intervened forcefully and swiftly through temporary asset purchases to calm the market.
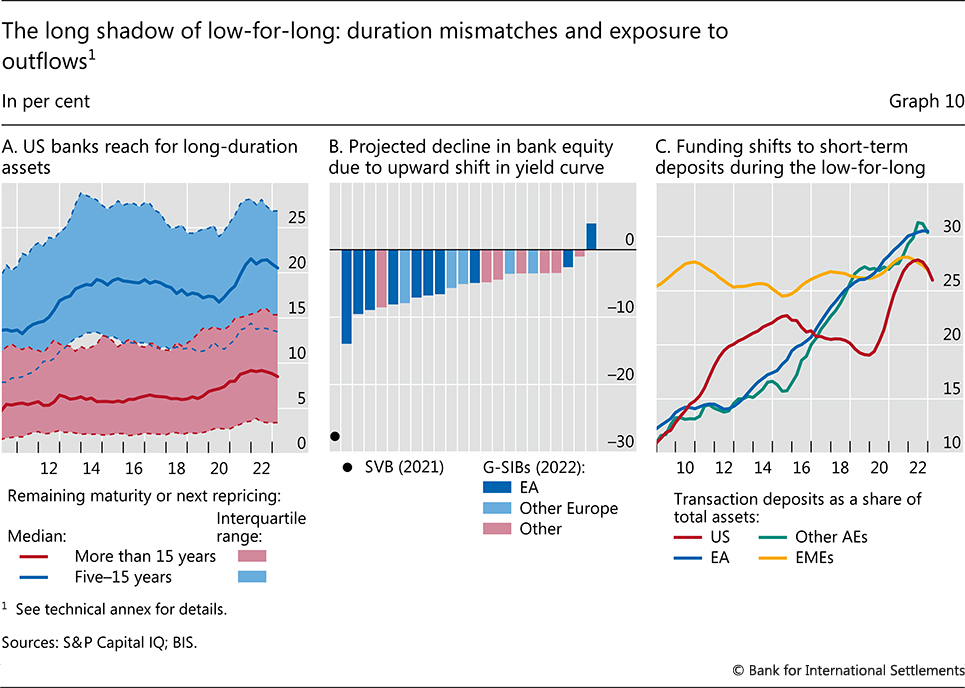
The sharp increase in interest rates also put the spotlight on banks. To the extent that they could reprice their assets, banks benefited from the impact of rising interest rates on net interest margins (Box B). However, during the low-for-long era, many had accumulated fixed rate mortgages and long-term government bonds (Graph 10.A), which declined steeply in market value when interest rates rose. Banks are generally required to assess and manage their exposure to changes in interest rates, including under scenarios of upward shifts in the yield curve (Graph 10.B). In addition to hedging with derivatives, banks often base their interest rate risk management on deposit stickiness. This feature has traditionally allowed banks to keep their funding costs in check by passing only a fraction of policy rate rises to deposit rates. As the share of short-term – and thus potentially flighty – deposits has risen (Graph 10.C),6 an increase in their interest rate sensitivity undermined the risk management strategies of some banks.
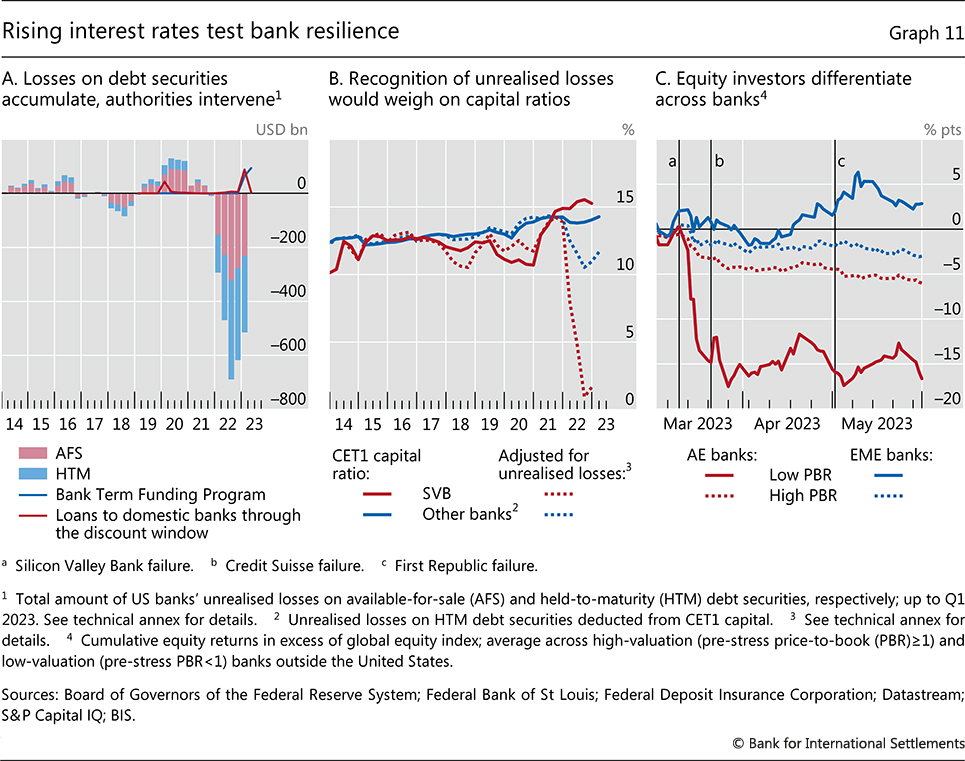
Mismanagement of interest rate risk, among other factors, drove the first major bank failures since the Great Financial Crisis (GFC). Already by late 2022, many US banks had sizeable market value losses on their debt securities holdings (Graph 11.A). More than half of the losses were not reflected on balance sheets, on the accounting assumption that banks would hold the attendant assets to maturity.7 However, as a loss of confidence in some of the smaller and thus more lightly regulated banks triggered a deposit flight, these banks had to liquidate some of their "held-to-maturity" assets and recognise immediate capital losses (Graph 11.B). These intertwined interest rate and run risks materialised forcefully for Silicon Valley Bank (SVB), a regional bank that collapsed in early March (Box C).
The realisation of interest rate risk reverberated through the US banking sector in the first half of 2023. Small and mid-sized banks suffered significant deposit outflows, forcing the closure of first Signature Bank and then First Republic Bank. At the same time, US global systemically important banks (G-SIBs) saw significant inflows from depositors searching for safe havens.
Investors' concerns spread to banking sectors in several other AEs. Banks that had already faced persistent market scepticism, as indicated by a low price-to-book ratio (PBR), were hit particularly hard. Credit Suisse – a G-SIB which had been struggling with large fund outflows and a series of setbacks (see Box C) – failed to rebuild market trust and – after writing down its contingent convertible bonds to absorb losses – was taken over by a competitor. Relative to global equity markets, other AE banks with low PBRs also registered deeply negative stock returns (Graph 11.C). This stood in contrast to the more modest decline for high-PBR banks in AEs and banks in EMEs.
Again, authorities responded forcefully to contain contagion and deployed a number of crisis management tools to curb systemic risks. In the United States, authorities invoked the so-called systemic risk exception – previously used in the GFC – to stem more widespread runs by guaranteeing the uninsured deposits of SVB and Signature Bank. In addition, the Federal Reserve established the Bank Term Funding Program (BTFP), offering loans to banks that pledged qualifying government securities, valued at par and thus above market value. The BTFP complemented lending through the Federal Reserve's discount window, which soared in the immediate aftermath of SVB's failure but has come down since then (Graph 11.A). In Switzerland, the public sector backed the emergency takeover of Credit Suisse, with the central bank pledging significant liquidity support and the government extending guarantees to shield the central bank from potential losses. Furthermore, to facilitate the takeover, the government guaranteed to cover part of future losses in relation to the disposal of the failed bank's legacy assets.
Key risks on a turbulent path
Against this broad macroeconomic and financial backdrop, what is the outlook for the global economy?
Consensus forecasts are rather benign. While forecasters do see lower growth and inflation still above target, the slowdown is rather mild and the fall in inflation substantial. Banking woes are expected to be contained.
Two risks loom large, however – quite apart from those of a more political nature, such as an intensification of geopolitical tensions. First, disinflation could well turn out to be harder than expected – the "last mile" challenge. Second, the end of low-for-long could further test the global financial system, with the crystallisation of macro-financial risks to threaten growth.
This combination of risks is rather unique by post-World War II standards. It is the first time that, across much of the world, a surge in inflation has coexisted with widespread financial vulnerabilities. The longer the inflation persists, the stronger and longer the required policy tightening, and hence the bigger the financial stability risks.
The "last mile" may pose the biggest challenge
Getting back to target is likely to be harder than the first phase of the disinflation journey. There are several reasons why. Beyond fading base effects and the increasing role of inertial components of inflation, households and firms may adjust to persistently higher inflation by trying to recoup previous losses and then seeking to avoid future expected ones through their wage- and price-setting decisions.8 Moreover, as time goes by and higher policy rates propagate through the system, the economy will weaken and further financial stress may arise. This means less pressure on prices but, at the same time, tougher trade-offs involving activity. In some cases, there may be political pressure on central banks to keep interest rates low, requiring them to reiterate the commitment to deliver price stability through both communication and action. Such dynamics may be especially relevant among those EMEs where institutional safeguards are weaker, inflation expectations are less anchored and indexation is more prevalent.
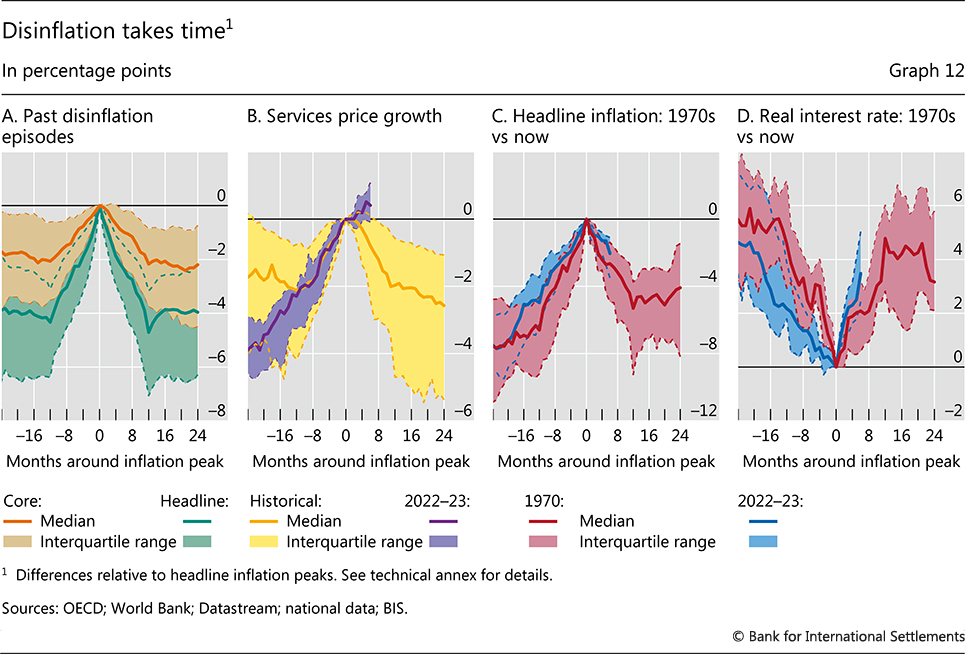
Admittedly, in previous disinflation episodes, headline inflation typically returned to the pre-peak levels (or even lower) in the space of one to two years (Graph 12.A). Core inflation tended to follow a similar path.
However, a number of features set the current episode apart from previous ones and indicate that disinflation may prove difficult. First, services prices have risen much faster and their rate of change has not yet peaked (Chart 12.B). This could mean a potentially longer disinflation journey. Second, rather than the median episode, the current surge more closely resembles the 1970s – when a "first mile" of disinflation was achieved in the space of about one year but inflation thereafter declined only gradually: after two years, it was still generally above its pre-surge level (Graph 12.C). In fact, the pace of disinflation so far has been even slower than in the 1970s – although the tightening has proceeded at a faster pace (Graph 12.D).
Crucially, then, what is the likelihood of a transition to a high-inflation regime, such as the one in the 1970s?
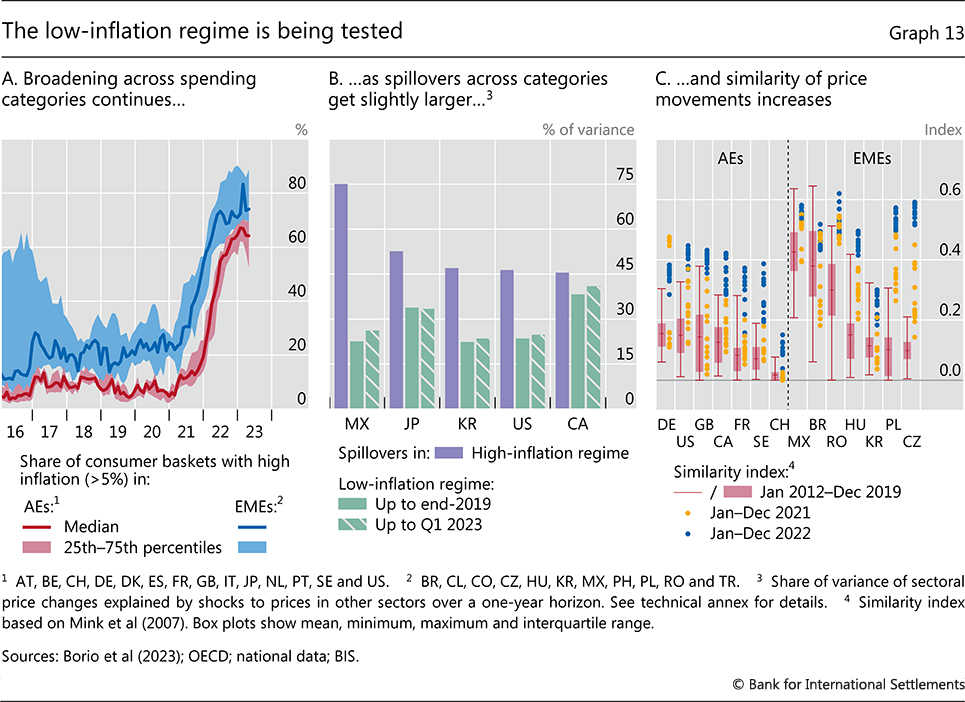
Several indicators point to possible obstacles along the disinflation journey and suggest that the low-inflation regime will continue to be tested. First, after a steep rise, the share of items in the consumer price index whose prices increased at a fast rate has not come down (Graph 13.A). Second, price spillovers across consumption categories are slightly larger than they were in the recent past when inflation was low (Graph 13.B). This means that increases in the price level due to price shocks in one category will propagate to others, raising the likelihood that they will lead to sustained inflation rather than die out. Third, price changes across categories are becoming increasingly similar (Graph 13.C), implying that differences in consumption patterns across consumers and input costs across firms matter relatively less, so that the general price level becomes more relevant for individual decisions. This tends to be a useful indicator of inflation persistence, ie when the similarity index is high, so is the probability that inflation in the next period will be at least as high as in the current one.9 These signals, taken together, suggest that households and firms are responding more strongly to the higher inflation rates.
Looking ahead, two closely related factors could signal a shift in inflation norms and tip the disinflation process off course: self-sustaining wage-price dynamics and a de-anchoring of inflation expectations.
While nominal wage growth has not been exceptionally strong so far, this should not provide too much comfort. Wage adjustments are still influenced by the lingering effects of the norms prevalent in the low-inflation regime, but this could change quickly. The inflation surge has severely eroded the purchasing power of households (Graph 14.A), even more than in past disinflation episodes (Graph 14.B). Some catch-up is on the cards, particularly given the strength of labour markets. While labour's bargaining power declined significantly over the years of low inflation,10 recent strikes and calls for unionisation suggest that the environment is evolving. In the euro area, for instance, negotiated wage growth has been on the rise and is now at its highest level since the inception of the common currency. And while multi-year wage contracts generally make the adjustment lags for wages considerably longer than for prices, contract length may shorten in response to higher and more persistent inflation.11 What's more, the pass-through from prices to wages has been somewhat higher when labour markets have been tight.
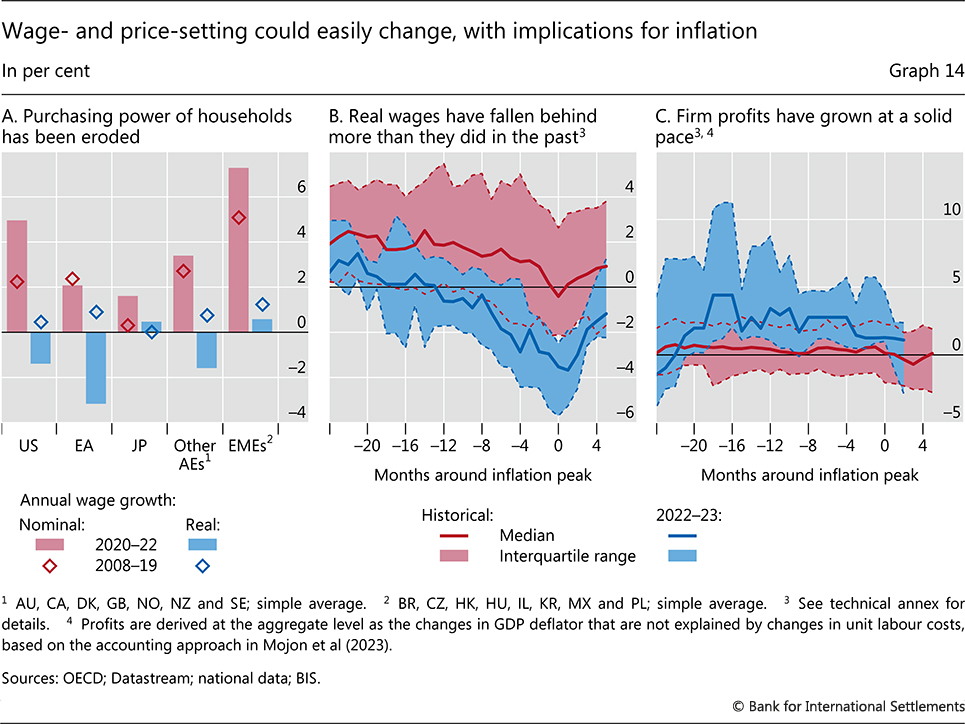
In parallel, there are signs that price-setting behaviour is changing. Firms are adjusting prices more frequently than when inflation was low and stable.12 In addition, corporate profits, which were already on the rise before the inflation surge, have held up remarkably well so far (Graph 14.C). This is a departure from the historical pattern: in past episodes, profit growth tended to fluctuate within a comparatively narrow range around zero. One concern is that, having been able to raise prices more easily than in the low-inflation regime, firms are now more reluctant to accept profit squeezes and will pass on cost pressures to prices more readily.13
In the end, a shift to a high-inflation regime would require self-sustaining wage-price increases – a "wage-price spiral" – as workers and firms try to recoup their losses. The feedback between wages and prices has been quite low in the last two decades, below 10%. However, moving to a high-inflation regime would strengthen it.14
A stylised exercise based on a decomposition of changes in the GDP deflator during disinflations shows that some catch-up in wages would be compatible with inflation returning to target, but only as long as firms accept a reduction in profits.15 16 Back-of-the-envelope calculations suggest that, for inflation to go back to a target of 2%, profits on average would need to decline by about 2.5% per year in 2023–24, should real wages rise fast enough to make up for the loss in purchasing power and return to the pre-inflation surge level by end-2025. For comparison, the cross-country pre-pandemic median for profit growth has been slightly more than 1.5% between 2014 and 2019.17
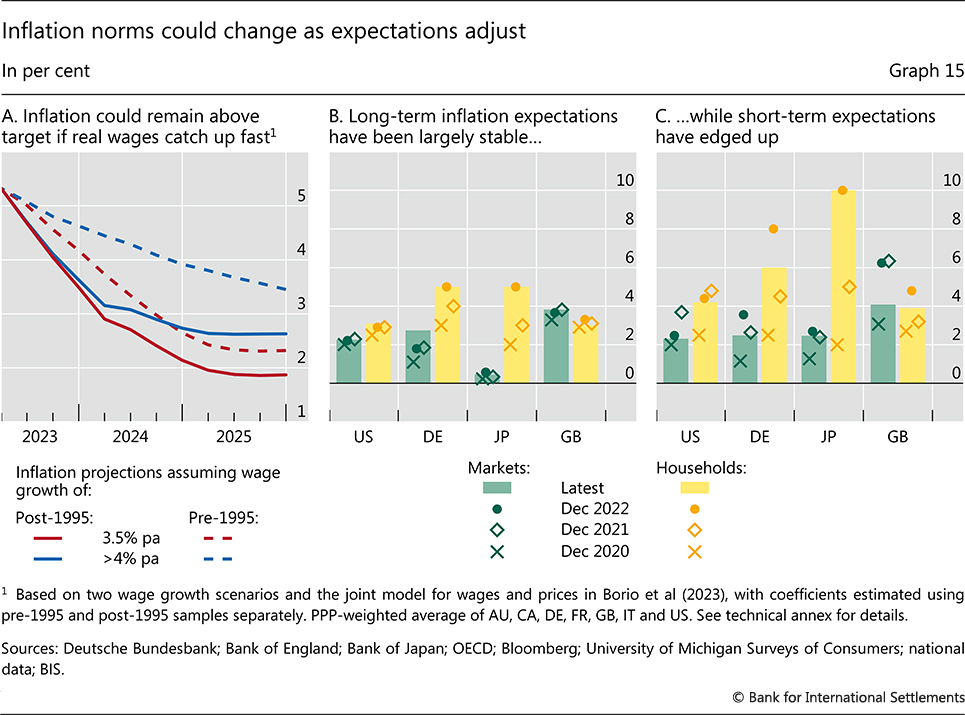
An alternative exercise based on the historical price-wage relationship reinforces the message that the room for adjustment in real wages without jeopardising the inflation target is limited. The exercise is guided by the cointegration between core CPI and hourly compensation and considers the path inflation could take under two different scenarios of purchasing power recovery (Graph 15.A).18 In the first scenario, wages gradually recover, growing at an annual rate of 3.5%, which is consistent with an inflation target of 2% and historical labour productivity growth rate of 1.5% ("gradual catch-up"). Real wages would then largely make up for the losses incurred so far by end-2025. In the second one, the pace of nominal wage growth is faster in 2023 and 2024 at 6%, and settles at 4% by 2025 ("fast catch-up"). In that case, the erosion in real wages is remedied by mid-2024. The gradual catch-up scenario seems conducive to bringing inflation down to or below target (solid red line in Graph 15.A), based on the historical relationship between wages and prices that prevailed in a low-inflation environment – here proxied by post-1995. By contrast, inflation would remain well above target up to the end of 2025 in the fast catch-up scenario (solid blue line in Graph 15.A). Further, if the relationship between wages and prices reverts to the pattern that prevailed before 1995 – capturing a high-inflation environment – the implied inflation trajectory would remain above target also in the gradual catch-up scenario (dashed red line in Graph 15.A). This is because wage-price spillovers were stronger when inflation was higher.
A wage-price spiral would be even more likely should workers and firms seek not just to recoup past losses, but also to be compensated for future ones, ie if expectations became "de-anchored". While a de-anchoring is not yet evident, inflation expectations have edged up visibly in some cases and are generally above target. True, long-term ones – over a five-year horizon – have remained stable. That said, they are higher than before the inflation surge began. This is especially so for German and Japanese households, who had seen inflation being persistently below target before the pandemic (Graph 15.B). Further, short-term inflation expectations – at the one-year horizon – rose much more than their long-term counterparts (Graph 15.C). The longer inflation remains high, the higher the odds that long-term expectations will follow.
Macro-financial vulnerabilities could complicate the inflation fight
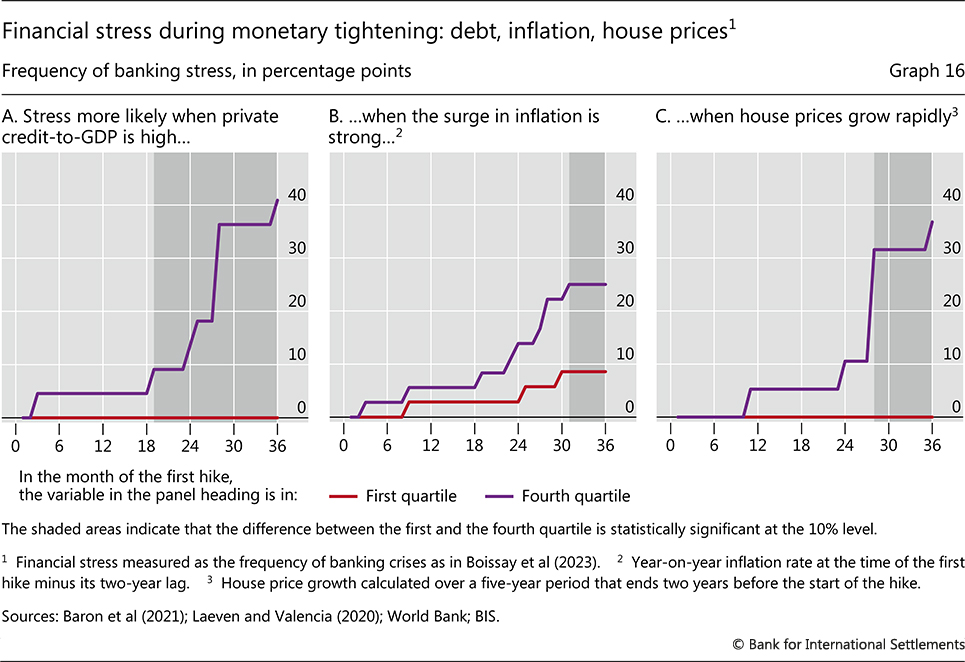
Given the economic background, the risk of further financial stress is material. Historically, about 15% of monetary policy tightening episodes are associated with severe banking stress. The frequency of such stress is higher during tightening episodes that start in an environment of high debt, an abrupt inflation surge or rapid house price growth. If the private debt-to-GDP ratio is in the top quartile of the historical distribution at the time of the first interest rate hike, 40% of the episodes are followed by a banking crisis within three years (Graph 16.A). The odds of a banking crisis are 25% for an inflation surge (Graph 16.B) and about 35% for rapid house price growth (Graph 16.C). Very high debt levels, a remarkable global inflation surge, and the strong pandemic-era increase in house prices19 check all these boxes. Vulnerabilities in the commercial real estate (CRE) sector – historically a common source of stress in the banking sector – raise concerns, too (Box D).
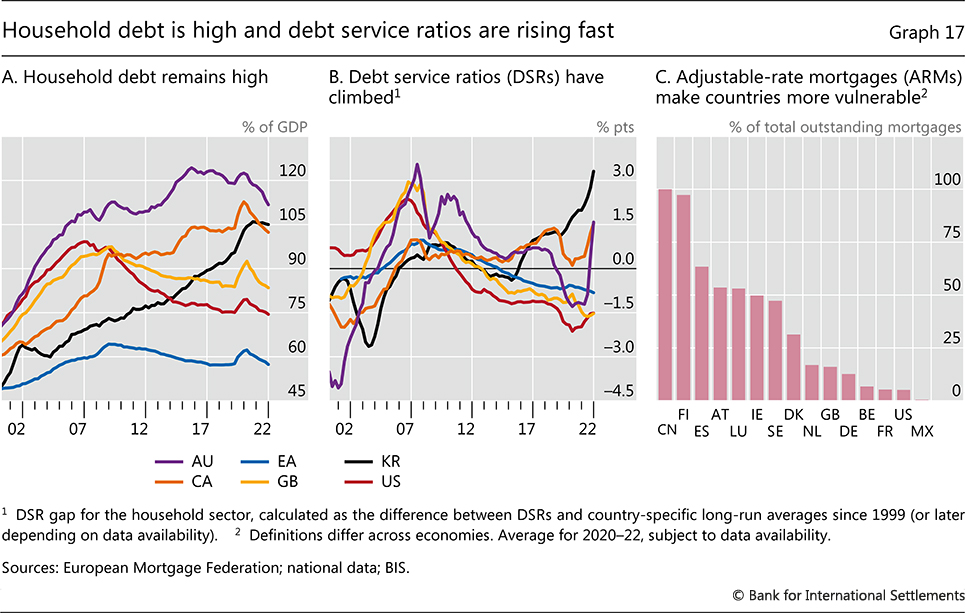
If inflation proves to be more persistent than expected and central banks have to tighten monetary policy by more or for longer, financial stability risks will rise. A key channel is the impact of asset prices and debt burdens on the macroeconomy. Sharply higher mortgage financing costs, coupled with high household debt (Graph 17.A) and falling house prices, translate into lower consumption (see Box D). Evidence shows that, generally speaking, high debt amplifies the impact of monetary tightening20 and that house prices are much more sensitive to a rate hike when debt levels are high.21 Countries with higher household debt have already seen a sharper rise in debt service ratios (DSRs) (Graph 17.B). Economies that rely on adjustable-rate mortgages (ARMs) are especially vulnerable (Graph 17.C).
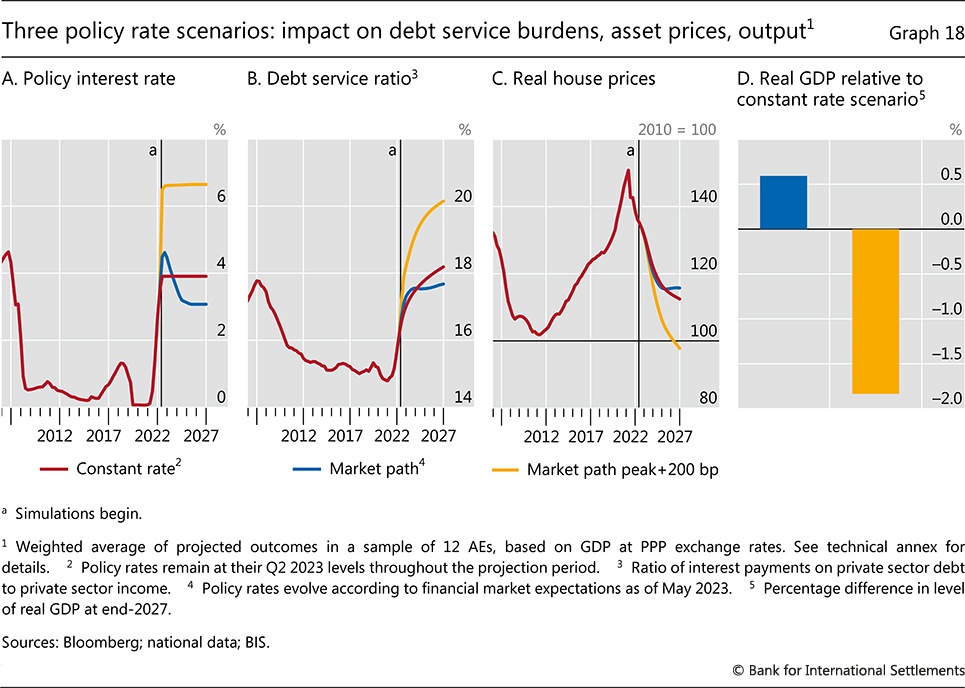
Illustrative simulations, based on historical relationships, shed light on the implications of alternative interest rate paths. For a number of AEs, the simulations trace the behaviour of key variables in three scenarios, assuming that interest rates are constant, follow the "market path" or go "higher-for-longer", ie remain at the market-implied peak plus 200 basis points until the end of 2027 (Graph 18.A). Average AE private sector DSRs could increase by about 1.5 percentage points and reach their pre-GFC peaks by 2027 if central bank policy rates evolve as financial markets currently expect (Graph 18.B). In the "higher-for-longer" scenario, average DSRs could increase by more than 4 percentage points. The decline in house prices in this adverse scenario could be as large as 30%, relative to the 15% drop in the market-implied path (Graph 18.C). The level of GDP in the adverse scenario could be about 2% lower by end-2027 relative to what would be expected were policy rates to follow the market path (comparing the blue to the yellow bar in Graph 18.D).
Bank vulnerabilities
Further illustrative simulations explore the possible implications for banks. Credit losses on the back of rising debt service ratios could undermine the support that banks receive from higher interest income. If macro-financial conditions follow the "market path" scenario, banks' expected credit losses in 2025–27 would be close to the average level in AEs over the past three decades (Graph 19.A). In the "higher-for-longer" scenario, those losses could approach the levels seen during the GFC, subject to a large degree of uncertainty (Graph 19.B).
Losses in banks with large exposures to interest rate-sensitive sectors could be heavier. A prime example is the CRE sector, which faces additional risks from the post-pandemic reduction in demand due to hybrid work arrangements. Smaller and more regionally focused banks in many AEs tend to have a greater concentration of loans in this sector.
Low valuations and weak profitability go hand in hand, heightening banks' vulnerability to losses. A number of GSIBs had persistently low PBRs throughout the low-for-long era. This is a sign of stubbornly sub-par profits and/or persistent investor scepticism about the bank's ability to create value (Box E). Low profits weaken the first line of defence against losses. In addition, low PBRs limit a bank's capacity to generate equity capital internally: shareholders prefer that profits be paid out rather than be reinvested at a lower return. When adjustments are necessary at short notice, however, banks may have to seek external capital. This can trigger adverse market responses, especially when investor confidence is fragile.
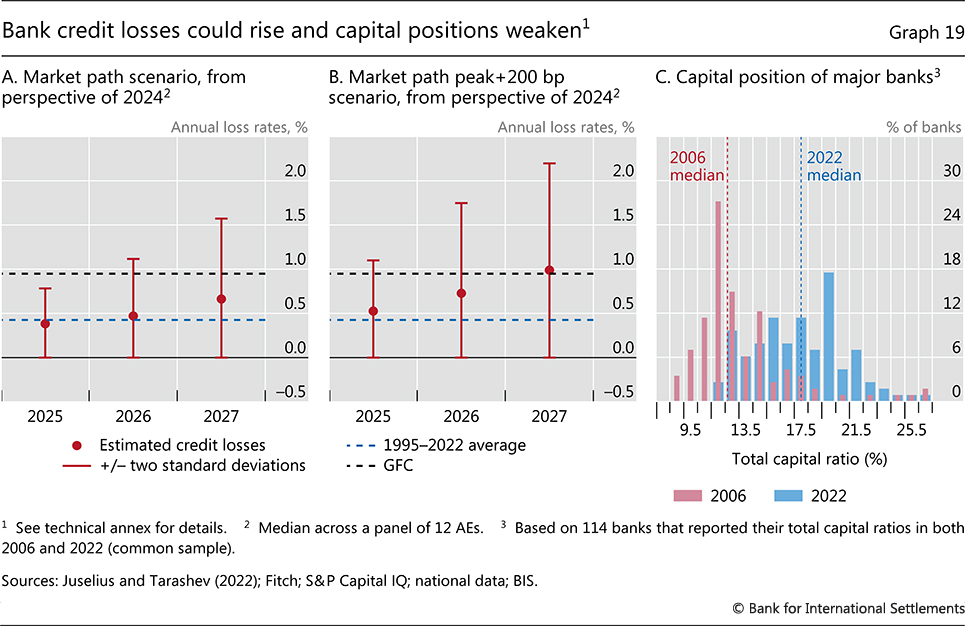
Post-GFC, financial reforms have greatly bolstered the capitalisation of the banking sector (Graph 19.C) and have encouraged more forward-looking loan loss provisioning. Ultimately, the impact on the banking sector will depend on the extent to which its loss-absorbing capacity helps preserve investor confidence.
Vulnerabilities among NBFIs
The long period of unusually low interest rates provided fertile ground for the build-up of widespread vulnerabilities in the NBFI sector. Moreover, post-GFC, this sector has grown in leaps and bounds relative to the banking sector.22 In the process, risks there have increased and some vulnerabilities have attained systemic importance. Not all of these vulnerabilities have been properly identified because large parts of the NBFI sector are quite opaque.
The NBFI sector can be a source or amplifier of systemic stress through several mechanisms. First, among NBFIs, hidden leverage and liquidity mismatches are rife. In addition, duration management by NBFIs – such as life insurance companies – could have adverse spillovers when a sharp rise in interest rates shortens liability duration and prompts sales of long-duration assets in a falling market. Stress could also stem from the interlinkages between NBFIs and banks via funding or hedging activities.
Vulnerabilities in two specific market segments deserve mention.
First, liquidity mismatches at investment funds can exacerbate existing fragilities in the real estate sector and corporate bond markets. An intensified downturn in real estate markets could, in particular, trigger large withdrawals by investors in REITs. In turn, this would require REITs to sell into inherently illiquid markets, setting in motion a downward price spiral. Similar liquidity mismatches could also affect corporate credit – a market segment that has seen a secular deterioration in credit quality, as reflected in the trend decline in ratings. In this case, large redemptions from bond mutual funds and ETFs could trigger fire sales.23
Second, even though private equity and private credit funds take on minimal liquidity risk, their contribution to corporate indebtedness is a cause of concern. Private market deals grew more than fivefold after the GFC and reached a multidecade high of almost $500 billion globally at the end of 2021.24 The funds' highly procyclical risk-taking contributed to the build-up of leverage during the low-for-long era,25 thus sowing the seeds for stress when interest rates rose.26 As borrowing costs increase, the highly leveraged companies that private funds have invested in could face difficulties in refinancing and repaying their debt, a large share of which is estimated to mature in the next three years. A deterioration of these borrowers' ratings would amplify these difficulties. Debt restructuring for distressed companies could buy time but, in the case of flawed business models, default would be inevitable. Banks could then incur losses directly, since some of them reportedly still warehouse significant amounts of the leveraged loans provided during the 2021 boom in private market deals.
Additional considerations in EMEs
While EMEs have so far been spared from significant spillovers from the financial stress in AEs, this could change. EMEs' resilience reflects a range of factors, such as early monetary policy tightening (notably in Latin America), implementation of structural reforms, less foreign currency borrowing and reduced foreign investor participation in local currency bond markets. Nevertheless, beyond the home-grown vulnerabilities in some EMEs, such as in real estate and corporate markets, financial stress in AEs could at some point spill over through several channels. The exchange rate continues to play a particularly important role in this context. Furthermore, while the lengthening of debt duration reduces EME borrowers' rollover risk, it also increases investors' market risk. It can thus be thought of as the duration equivalent of "original sin redux", ie the shift of exchange rate exposures from borrowers to lenders.
Navigating from turbulence to safety
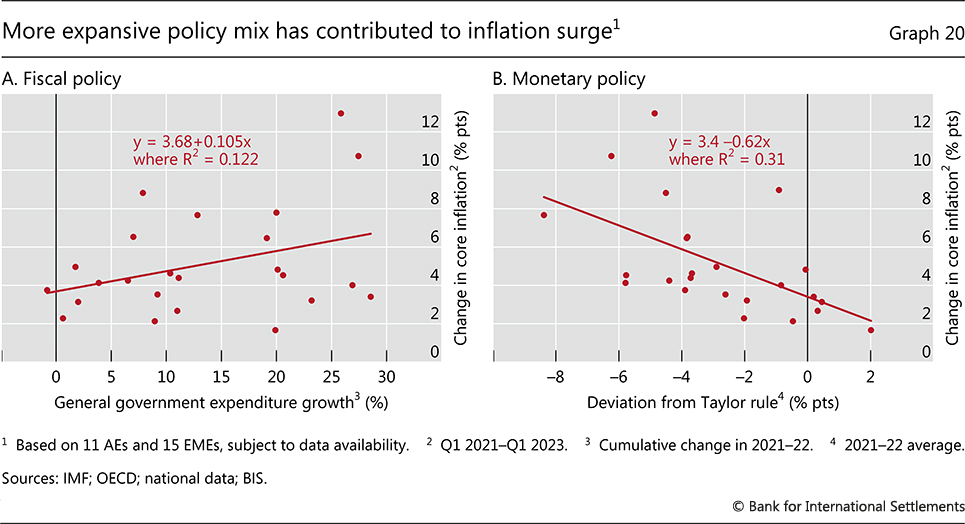
Policymakers are facing tough challenges in the near and longer term. In the near term, the overriding challenge is to bring inflation back to target in the context of heightened financial stability risks. This challenge contrasts with those faced from the 1970s up to the mid-1980s, when inflation generally rose against the backdrop of limited financial strains. Thereafter, financial stress broke out during generally quiescent inflation (Chapter II). The combination makes calibration much harder and requires all policies – monetary, fiscal and prudential – to play their part. With the benefit of hindsight, the extraordinary monetary and fiscal stimulus deployed during the pandemic, while justified at the time as an insurance policy, appears too large, too broad and too long-lasting. It contributed to the inflation surge (Graph 20) and to the current financial vulnerabilities. In the longer term, the challenge is to wean growth away from excessive reliance on macroeconomic policies to set the basis for a robust and sustainable expansion.
Monetary policy
While the central bank response to the inflation surge has been forceful and has clearly started to bear fruit, the job is not yet done. To be sure, tighter financial conditions have begun to weigh on expenditures, with economic activity slowing down most in interest rate-sensitive sectors. Labour markets have started to cool. And inflation expectations appear to have remained generally well behaved so far. That said, inflation is receding only slowly and the repeated forecast errors counsel caution in drawing firm inferences. Further, monetary policy is well known to operate with long and variable lags, making it difficult to pin down how large the impact has been so far. There is no room for complacency; perseverance is the name of the game.
Any assessment of the strength of policy transmission needs to consider the influence of factors that pull in different directions. On the one hand, higher debt levels, elevated asset prices and bursts of financial stress raise the sensitivity of the economy to tighter monetary conditions. Moreover, for the first time central banks are tightening not just through higher rates, but also by trimming their balance sheets. On the other hand, inflation-adjusted interest rates remain low or even negative and households and firms have been able to draw on the extraordinary support provided during the pandemic and on borrowing at longer maturities than in the past.
More fundamentally, the risk of shifting to a high-inflation regime greatly complicates the calibration of policy. Historical relationships no longer constitute reliable signposts.27 This makes the task of central banks much more difficult and can put their credibility on the line.
On balance, the biggest risk is to declare victory too soon. From a risk management perspective, policy rates may need to remain higher for longer to ensure that inflation continues to decline and stays low. Transitions to high-inflation regimes tend to be self-reinforcing and the trade-offs involved in restoring price stability worsen once inflation becomes entrenched. What's more, history highlights the cost of stop-and-go actions, which can introduce unnecessary fluctuations in the economy. The costs of a high-inflation regime are simply too high to take any chances.
Support from other policies will be important for central banks to win the inflation fight, especially against the backdrop of elevated financial stability risks. Central banks can and should address financial stability risks without compromising the price stability objective. In the longer term, the two objectives do not pose a trade-off. But in the near term, the need to bring inflation back to target and the need to stabilise the financial system could pull in different directions. There will be a premium on differentiating central bank actions designed to achieve price stability from those aimed at financial stability – a task complicated by the extensive use of balance sheet policies to set the policy stance in several jurisdictions. If the stress is minor, central banks could address the near-term trade-off on their own, as the gilts market turmoil in the United Kingdom has shown.28 But if the stress is more acute, central banks will need the support of fiscal, prudential and supervisory policies to manage it effectively while retaining sufficient room for manoeuvre.29
Fiscal policy
The role of fiscal policy will be critical. To do its part, fiscal policy needs to consolidate. Consolidation would help tackle both the near-term and the longer-term challenges.
In the near term, consolidation would calm inflation by reducing pressure on productive capacity. And it would contain financial instability risks in several ways. It would reduce the need for monetary policy to tighten further. It would mitigate the risk that the sovereign itself becomes a source of financial instability, such as through the sovereign-bank nexus (Chapter II). And it would create more headroom should public resources be called upon for crisis management in concert with central banks.
In the longer term, consolidation would help rebuild the space necessary to put public sector debt on a firmly sustainable path. This is all the more important given the likelihood of greater demands on public spending, arising from ageing populations, the impact of geopolitical tensions on defence spending, and the green transition (Chapter II).
The recent policy record, however, highlights the risk of a drift in the fiscal stance. The design of the measures deployed to shield households and firms from the fallout of the war in Ukraine on energy and food prices leaves room for improvement. In general, it has not followed the "3T principle", often for practical and political reasons. Support should be targeted to the most vulnerable groups so that the overall size is in line with the fiscal constraints and the needs of society. It should be tailored to ensure that it does not weaken incentives for needed medium-term adjustments. It should be temporary so as not to unduly add to demand after the shocks have passed.30 Moreover, any support boosts aggregate demand unless offset by higher taxes, regardless of how it is designed, thereby complicating the fight against inflation through that channel.
The recent improvement in fiscal positions reflects, to a considerable extent, only temporary factors. Even though fiscal expenditures exceeded original plans, primary deficits in G7 countries declined from 5.7% of GDP in 2021 to 3.4% in 2022. This largely reflected the inflation surge, which boosted both tax revenues and nominal GDP (Graph 21.A). These benign effects tend to be short-lived: they are one-off level adjustments. Further, it can prove politically difficult to withdraw support measures and the perception of a stronger fiscal position can tempt the authorities to spend rather than save the revenue windfalls.
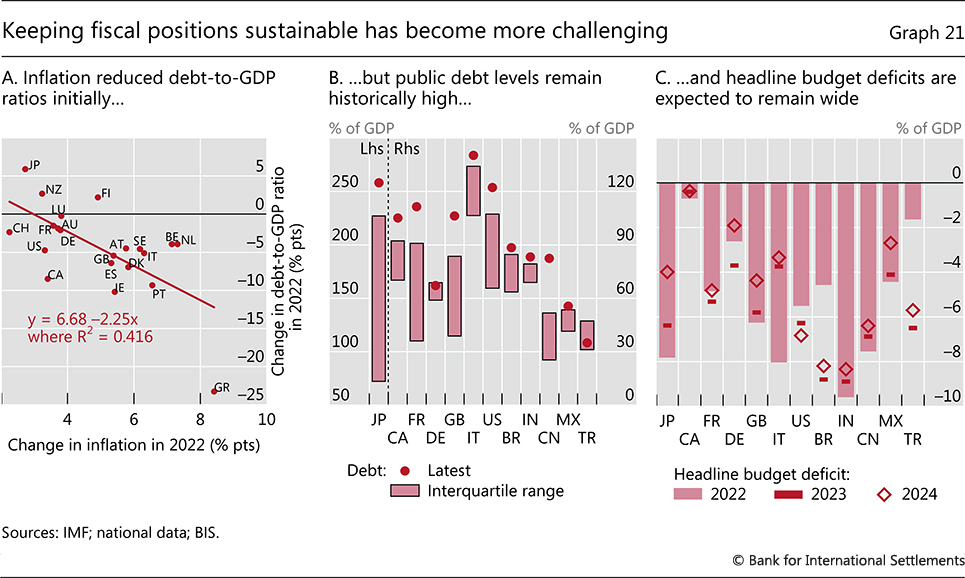
The ephemeral positive impact of inflation on debt ratios should not be exploited to avoid much-needed, credible consolidation plans. These plans should also aim to rationalise expenditures, improve the quality of spending and create space for supply side reforms (see Chapter II). Public-private partnerships should be part of the formula where possible. Absent consolidation, deficits remain too large to put public debt on a sustainable path. Debt levels in some major economies are at historical peaks or near them (Graph 21.B), and rising interest rates have increased the prospective debt service burden.
The challenge is daunting. To give a sense of the magnitudes involved, in 2019 a primary deficit of 2.1% of GDP would have been sufficient to stabilise debt, on average for G7 countries. In 2023, despite the one-off inflation-induced improvements in fiscal positions, higher interest rates mean that the corresponding figure has fallen to 1.6%. Among major EMEs, the debt-stabilising primary deficit has fallen from 1.1% of GDP in 2019 to 0.1%.31 While further shrinking of fiscal deficits is envisaged for most countries in 2023 and 2024 (Graph 21.C), these plans typically fall short of stabilising public debt even if they were meticulously followed. What is more, these figures assume that real long-term interest rates remain lower than real GDP growth rates, which cannot be relied upon. To reduce debt from its historically high levels, primary surpluses must clearly exceed the debt-stabilising ratios. Only this will restore fiscal space.
Prudential policy
Prudential policy, too, has an important role to play, in both the near and the longer term. By focusing on improving the resilience of the financial system, it can provide critical support to monetary and fiscal policies. Actions should address both banks and NBFIs.32 And they will need to be complemented by improvements in elements of the safety net as well as recovery and resolution schemes.
In the near term, the focus should be on actions that can quickly strengthen the loss-absorbing capacity of the financial system. This should be at both the macro- and the microprudential levels.
A premature easing of macroprudential measures should be avoided. Implemented before or during monetary policy tightening, such measures tend to reduce the likelihood of subsequent financial stress.33 It would be imprudent to ease them in anticipation of a slowdown in economic activity. In accordance with their design, they need to be kept in place and, where appropriate, tightened further and released only when clear risks of a disruptive credit crunch emerge.
At the microprudential level, a priority is tighter supervisory oversight. A culture of supervisory scrutiny should go beyond regulatory metrics and enforce timely remedial actions. Enforcement of stronger risk management practices, underpinned by sound governance, will be key. Given the build-up of indebtedness during the low-for-long era and the subsequent exceptional monetary policy tightening, losses could surpass forecasts based on historical data. This calls for conservatism in loan loss provisioning and in stress tests of exposures to interest rate, credit and liquidity risks.
Other adjustments will take more time.
In the banking sector, beyond the consistent and timely implementation of the post-GFC reforms, there is a need to learn from recent strains. In particular, lessons related to interest rate risk call for a reassessment of accounting rules and regulatory requirements. Historical cost accounting contributes to the accumulation of latent vulnerabilities when applied to assets that also serve liquidity management purposes (eg government securities). An overhaul of this practice would make reported capital more accurately reflect banks' loss-absorbing resources. Furthermore, assumptions about the stickiness of various funding sources, most notably uninsured demand deposits, should be reassessed to improve banks' liquidity requirements.
Beyond banking, there is an urgent need to strengthen the regulation of NBFIs from a systemic perspective. Deleveraging spirals and liquidity mismatches have exposed vulnerabilities that, if left unaddressed, could lead to broader systemic repercussions. A system-wide approach to strengthening NBFI resilience would need to build on a balanced mix of activity-based and entity-based regulatory requirements.34 Progress in this area has been disappointingly slow.
Turning to safety nets, an issue that has risen to prominence once again is the design of deposit insurance schemes. These schemes seek to safeguard the savings of retail depositors, who are unable to monitor financial intermediaries, and to facilitate the restructuring of failed banks. Together with central banks' lender of last resort function, they also enhance the stability of banks' funding, thereby supporting their ability to provide liquidity and manage maturity transformation.
Concerns about the rising structural instability of uninsured deposits has prompted calls for an expansion of the insurance coverage. Historically, it has proved very difficult to strike the appropriate balance. Arguably, however, experience indicates that, once confidence in an institution evaporates, deterring runs and preventing the institution from losing market access would require nothing short of insuring 100% of demandable and short-term claims, whether collateralised or not. This would encompass all forms of wholesale funding, including liquidity needs arising from margining practices. The upshot would be much weaker market discipline and, ultimately, a rise in solvency risks to unacceptable levels.
Hence, there is a premium on mechanisms to resolve institutions in an orderly way. Much progress has been made since the GFC in implementing the ambitious agenda concerning recovery and resolution frameworks. That said, further work is needed to equip authorities to manage bank failures more effectively. This entails closing the gap between available tools and the resolution requirements arising from banks' scale, complexity or cross-border footprint. Key focus areas include facilitating the application of bail-in measures on all debt instruments with loss-absorbing features and establishing clear responsibilities and processes for the swift resolution of internationally active banks, especially G-SIBs. In addition, authorities should be in a position to address issues pre-emptively by steering banks towards sustainable business models.
Structural policies to enhance sustainable growth
Looking beyond the immediate challenges of inflation and financial stress, pre-pandemic sluggish growth could well set back in. Indeed, potential output growth estimates are at multidecade lows.35 There will then again be calls for monetary and fiscal policies to boost the economy's prospects.
Experience offers valuable lessons, however, and indicates how misguided such calls can be. Policymakers should resist these calls. In the decades prior to the pandemic and the war in Ukraine, policymakers came to view the economy mainly through the lens of aggregate demand and assumed that aggregate supply adjusted smoothly in the background. The pandemic and the war were a rude awakening: supply side constraints do matter and macroeconomic policies stimulating aggregate demand to smooth the business cycle had largely run out of space.36 One lesson is that, to prevent unintended consequences, it is essential for monetary and fiscal policy to retain sufficient policy space and remain firmly within a region of stability (Chapter II).37 A second lesson is the need to reboot the supply side of the economy as the only possible source of robust, durable growth.
With a renewed focus on the supply side, policymakers need to identify the opportunities that longer-term trends can offer. The green transition, investments in state-of-the-art efficient facilities during the re-configuration of GVCs, digitalisation and the advancement of artificial intelligence could provide a much-needed push to productivity in many countries – provided that the right policies are in place.
A comprehensive approach to reap the potential benefits involves an array of structural policies. First and foremost, targeted investments in education should aim at continuous upskilling and re-skilling of the workforce. Adequate resources will need to be in place to ensure that workers can adapt and make effective use of the new technologies, so that the skills of a large part of the labour force do not become obsolete. In addition to education and training, policymakers should invest in healthcare, not only to mitigate any scarring effects from the pandemic and be prepared for other public health emergencies but also to maximise the productive potential of the workforce. Investments in human capital could be complemented by investments in physical capital. Infrastructure projects to improve connectivity and access to markets and services, when chosen carefully and implemented efficiently, could prop up productivity growth and enhance economies' resilience. These investments may require not only better but also more public spending, further underscoring the need for fiscal consolidation through broadening of the tax base and entitlement reforms.
The other area of focus is maintaining competitive and open markets, both domestically and internationally. Economic structures are evolving rapidly, in response to the pandemic-induced shifts in preferences, geopolitical tensions, technological advances and climate change. Lowering barriers to entry would bring in new, innovative firms and help improve the outcomes of these transformations. Promoting free trade and resisting real and financial fragmentation would deliver better outcomes, given the important role trade has played in underpinning global productivity and growth.
Endnotes
1 For instance, in Brazil energy tax cuts are estimated to have lowered headline inflation by 2.5 percentage points in 2022 (Central Bank of Brazil (2022)). Estimates for France suggest that price caps and rebates have reduced headline inflation by about 3 percentage points between Q2 2021 and Q2 2022 (Bourgeois and Lafrogne-Joussier (2022)).
2 See Cavallino et al (2022).
3 This has given rise to the debate about "front-loading"; see Cavallino et al (2022) for an analysis.
4 These averages mask some variation, especially among EMEs: the tightening cycle of Latin American central banks pre-dated that of the Federal Reserve, while Asian economies typically embarked on tightening later, in part because the rise in inflation there was much more modest. Importantly, in China the official interest rate did not follow the global upward trend.
5 See Avalos et al (2022) for a discussion on the estimates of the growth impact under a natural gas shutdown scenario.
6 US banks seem to hedge little of their interest rate risk with derivatives, such as swaps (McPhail et al (2023)), in part due to reliance on hedges from their deposit franchise and accounting considerations.
7 In contrast to trading assets, changes to the market value of available-for-sale (AFS) and held-to-maturity (HTM) assets do not immediately have to be recognised in earnings. AFS and HTM assets, in turn, differ in how they affect banks' reported equity, as this adjusts only in response to valuation changes on AFS holdings. In the United States, only the largest banks have to reflect such valuation changes in their regulatory capital. Following a change in legislation in 2018, banks with total assets of less than $250 billion, such as SVB before its failure, no longer have to reflect such losses.
8 See BIS (2022) and Borio et al (2023) for a detailed account of the transition mechanisms from a low- to high-inflation regime.
9 See Borio et al (2023).
10 See BIS (2022) for a historical perspective on how labour market institutions relate to low- vs high-inflation regimes.
11 Evidence exists of a negative and significant relationship between contract durations and inflation uncertainty. See Rich and Tracy (2004), Christofides and Peng (2006), Fregert and Jonung (2008).
12 See Cavallo and Kryvtsov (2023).
13 This interpretation comes with caveats. First, tight policy and weakened aggregate demand put a limit on profits. Second, a steady rise in profits and prices does not necessarily mean a steady rise in market power (captured by markups). Other factors, such as stronger demand or a temporary pause in new capital investment, could be behind the rising profits. Third, and related, margins 32 BIS Annual Economic Report 2023 and markups are notoriously difficult to measure accurately in real time and vary greatly among sectors. Last but not least, the link between market power and pass-through of costs to consumer prices is ambiguous. On the one hand, more power could allow firms to pass rising costs to consumers. On the other hand, higher markups could give firms headroom to absorb rising costs and compete on market share.
14 See Graph 9 in Borio et al (2023), which shows the sensitivity of inflation to past wage growth for different time periods. In addition, in Box 2 the authors use a cointegrating model for prices and wages to show that, in a high-inflation regime, changes in prices react in a significant way to changes in wages, and vice versa.
15 See Mojon et al (2023) for more details of the decomposition exercise and for a discussion of burden-sharing under projected disinflation paths in the euro area and the United States. In this simple accounting-based approach, profits are proxied by the ratio of GDP deflator to unit labour costs. Productivity growth is assumed to be in line with historical norms.
16 Of course, another margin of adjustment available to firms is the quantity rather than the price of labour. Typically, during disinflation episodes, unemployment increased about six months before peak headline inflation was reached and was almost 1.5 percentage points higher two years later. This time around, by contrast, unemployment actually fell as inflation rose and, to date, it has not risen much from the historically low levels it reached.
17 The sample covers Canada, Chile, Denmark, the euro area, India, Korea, New Zealand, Peru, Switzerland, Thailand and the United States.
18 The methodology and the underlying assumptions are explained in the technical annex. Notably, there is no explicit treatment of monetary policy. Its impact comes only indirectly: the exercise implicitly captures a successful monetary policy tightening by assuming that the unemployment gap returns to zero by the end of 2023 in all scenarios. Also, the results largely depend on the strength of the wage-price link estimated over a historical sample, and hence need to be taken with a pinch of salt: by considering the average strength of the relationship over a given sample, they may underestimate that, when inflation runs particularly high, the feedback effect may be even stronger.
19 See Igan et al (2022).
20 See Ampudia et al (2023).
21 Economies with relatively low debt levels tend to see house prices level off after the first rate hike, while those where household debt is in the upper third of the distribution typically see a pronounced and prolonged fall in house prices.
22 See FSB (2020).
23 ETFs could be less prone to such risks given their advantageous fund structure, see Shim and Todorov (2023).
24 The leveraged loans market also experienced strong growth, see Aramonte et al (2022).
25 See Aramonte and Avalos (2021).
26 For example, leveraged loan volumes reached multidecade highs in 2022, at more than $1.8 trillion in Europe and the United States. See Aramonte et al (2022).
27 For a discussion of how inflation indicators can become less useful during a regime switch, see De Fiore et al (2022). More generally, similar pitfalls plague the assessment of the current tightening. In a low-inflation regime, it may appear that monetary policy plays a minor role: as measured by standard models, the impact of monetary policy shocks – deviations from a policy rule – on inflation declines (eg Borio et al (2023)). This adds to the calibration challenge. But concluding that monetary policy as such does not matter would be a mistake: policy shocks do not capture the broader rule and the broader rule itself is what secures and maintains the low-inflation regime.
28 See Bailey (2023) for elaboration on a recent example.
29 See Chapter II on possible long-term adjustments to monetary policy frameworks to manage the trade-offs.
30 See OECD (2022) for an assessment of where different support measures stand on these dimensions. Governments often focus on price controls, which are in large part non-targeted, can blur price signals that would facilitate adjustment and tend to support rather than curb demand.
31 Simple averages of Brazil, China, India, Indonesia, Korea, Mexico and Poland.
32 See Carstens (2021).
33 See Boissay et al (2023).
34 See Borio et al (2022).
35 See IMF (2023) and OECD (2023).
36 See Carstens (2022).
37 See also Carstens (2023).
Technical annex
Graph 1: "Other AEs" is an average of AU, CA, CH, DK, GB, NO, NZ and SE, weighted by GDP and PPP exchange rates. "Latin America" is a simple average of BR, CL, CO and MX. "Other Asia" is a simple average of KR and SG. "Food and energy" includes alcoholic beverages.
Graph 3.A: Country groups calculated using GDP and PPP exchange rates. "AEs" is based on data for AU, CA, CH, DK, EA, GB, JP, NO, NZ, SE and US. "EMEs" is based on data for BR, CL, CN, CO, CR, CZ, HU, IL, KR, MX, PL, SA, TR and ZA. The coefficient of variation is calculated using data starting from 2012.
Graph 3.C: Calculation based on the principal component decomposition of the full sample. Nine AEs and eight EMEs.
Graph 4.A: For each country, tightening episodes are identified as months between the trough and peak in the policy rate around periods when the seven-month centred moving average of the policy rate is increasing. Episodes in which the policy rate increases by less than 1 percentage point or more than 20 percentage points, or episodes that last less than six months or more than 48 months, are excluded from the analysis. Based on data for 11 AEs and 16 EMEs from Jan 1970 to Feb 2023 (subject to availability); 154 tightening episodes.
Graph 4.B: Policy rate deflated by the weighted average of the current and next year Consensus forecasts for year-on-year inflation. Median based on monthly data for 11 AEs and 23 EMEs.
Graph 4.C Policy rate deflated by realised year-on-year inflation. Median based on monthly data for 11 AEs and 23 EMEs.
Graph 5.A: GDP-weighted average of EA, GB and US. Mortgage rates = for US, average of 15-year and 30-year fixed rate; for GB, average of two-year and five-year fixed rate with 60 and 90 LTV; for EA, new business mortgage rate. NFC loans rate = for US, bank prime loan rate; for GB, new business NFC fixed rate; for EA, new business NFC narrowly defined effective rate.
Graph 6.A: Country groups calculated as weighted averages using GDP and PPP exchange rates. "Other AEs" is based on data for AU, CA, CH, GB and SE. "EMEs excl CN" is based on data for AR, BR, CL, CO, CZ, HK, HU, ID, IL, IN, KR, MX, MY, PE, PH, PL, RO, RU, SA, SG, TH, TR, VN and ZA.
Graph 7.A: "EMEs" is based on data for AE, AR, BR, CL, CO, CZ, DZ, HU, ID, IL, KR, MA, MY, MX, PE, PH, PL, RO, RU, SA, SG, ZA, TH and TR. Calculated as weighted averages using GDP and PPP exchange rates.
Graph 7.C: For economic activity, Yicai Research Institute's high-frequency economic activity indicator; for box office revenues, one-month rolling average of the Maoyan Entertainment's box office revenues; for port congestion, the average of Kiel Institute's traffic indices for Hong Kong SAR and Guangdong, and for Shanghai and Zhejiang; for road congestion, the one-month rolling average of the average China Ministry of Transport's road congestion index across 101 Chinese regions; for subway traffic, the one-month rolling average of the sum of number of passengers in 10 important Chinese regions; for international flights, the one-month rolling average of the number of operated international flights.
Graph 9.A: S&P 500 index for the United States; Shanghai Shenzhen CSI 300 Equity Index for China. AEs (excl US): weighted average of S&P/ASX 200, S&P/TSX Composite Index, Swiss Market Index, OMX Copenhagen Index, EURO STOXX 600 Index, FTSE 100 Index, Nikkei 225, OBX Stock Index, S&P/NZX 50 Index and OMX Stockholm Benchmark for AEs. EMEs (excl CN): weighted average of Brazil Ibovespa Index, S&P/CLZ IPSA, MSCI Colcap Index, Prague Stock Exchange Index, Hang Seng Index, Budapest Stock Exchange Index, S&P BSE Sensez Index, Jakarta Composite Index, Kospi Index, S&P/BMV IPC Index, FTSE Bursa Malaysia KLCI, S&P/BVL PeruGeneral TRPEN, PSEi Philippine SE Index, WSE WIG Index, Straits Times Index, Stock Exchange of Thailand Index and FTSE/JSE Africa ALL SHR Index for EMEs.
Graph 10.A: Long-duration loans, mortgages and debt securities as a percentage share of total loans, mortgages and debt securities; based on a sample of more than 230 large and mid-size US banks.
Graph 10.B: Estimated impact of a +200 basis point parallel shift in the yield curve on banks' Tier 1 capital; "Other" comprises G-SIBs from Canada, China and Japan; based on available G-SIB disclosures at end-2022 and end-2021 data for Silicon Valley Bank (SVB).
Graph 10.C: Regional aggregates based on a balanced sample of 341 major banks from 42 countries; four-quarter rolling averages.
Graph 11.A: Outstanding loans through the Federal Reserve's Bank Term Funding Program and discount window (primary credit) up to latest available.
Graph 11.B: Asset-weighted average based on a sample of 233 US banks.
Graph 12: Each disinflation episode is captured when the 13-month moving average is at its peak, under the conditions that (i) there are no other peaks in the preceding and the following 12 months; (ii) the peak is between 3% to 25%; and (iii) the peak is at least 3 percentage points higher than the lowest troughs in the preceding and the following 12 months. Month = 0 is when the actual headline inflation value is at the highest during that particular episode. Panel of 30 AEs and 28 EMEs, subject to data availability. In Graph 12.D, real interest rate is computed as an ex post rate using the policy rate and the headline inflation.
Graph 13.B: High-inflation regime samples: CA, Q4 1971–Q4 1990; JP, Q4 1970–Q4 1979; KR, Q4 1985–Q4 1997; MX, Q1 1983–Q4 2002; US, Jan 1965–Dec 1985. Low-inflation regime samples: CA, Q1 1991–Q4 2019; JP, Q1 1980–Q4 2019; KR, Q1 1998–Q4 2019; MX, Q1 2003–Q4 2019; US, Jan 1986–Dec 2019.
Graph 14.B–C: See technical annex for Graph 12 for the definition of disinflation episodes. Real wages are computed by deflating nominal wages by headline CPI. Profits are proxied by the ratio of GDP deflator to unit labour costs.
Graph 15.A: Projections are based on country-specific macroeconomic models, the results of which are then aggregated using GDP weights. The models estimate a long-run relationship between the (log-)level of prices (core CPI), wages (average hourly compensation for total economy) and labour productivity, as well as short-run adjustment equations in which deviations from the long-run relationship contribute to the dynamics; the models and the estimates are described in detail in Borio et al (2023), Box B. Conditional projections of inflation are constructed by letting labour productivity grow at the average rate observed over the last 10 years, and assuming a wage growth rate as specified under each of the two scenarios. For the projections in 2023, average residuals of inflation in 2022 are also included, decaying by a factor of 0.25 every quarter. Note that, since core CPI is used as the metric for prices, import prices drive a wedge relative to an exercise where the GDP deflator is used.
Graph 18: Projections are based on country-specific macroeconomic models. The models consist of a VAR linking the behaviour of private sector debt-to-income ratios, real house prices, real equity prices, real income, effective private sector interest rates and real GDP. The coefficients in some VAR equations (eg equity prices) are restricted to reflect realistic information lags. VARs are estimated over the sample Q1 1985–Q4 2019. Policy interest rates are included as an exogenous variable in the model. In each scenario, all variables other than the policy rate evolve according to their estimated relationships in the model.
Graph 19.A–B: Credit losses calculated based on the private sector debt-to-income and credit growth projections shown in Graph 17 using the approach described in Juselius and Tarashev (2022).
Graph 19.C: Total capital ratio is the total capital adequacy ratio under the Basel III framework. It measures Tier 1 plus Tier 2 capital, which includes subordinated debt, hybrid capital, loan loss reserves and the valuation reserves as a percentage of risk-weighted assets and off-balance sheet risks.
References
Ampudia, M, F De Fiore, E Kharroubi and C Manea (2023): "Private debt, monetary policy tightening and aggregate demand", BIS Bulletin, no 70, February.
Aramonte, S and F Avalos (2021): "The rise of private markets", BIS Quarterly Review, December, pp 69–82.
Aramonte, S, K Todorov and K Detering (2022): "Are CLO investors underestimating tail risk in European markets?", BIS Quarterly Review, September, pp 13–14.
Avalos, F, A Cap, D Igan, E Kharroubi and G Nodari (2022): "Energy markets: shock, economic fallout and policy response", BIS Bulletin, no 64, December.
Bailey, A (2023): "Monetary and financial stability: lessons from recent times", speech at the Institute of International Finance, 12 April.
Bank for International Settlements (BIS) (2022): "Inflation: a look under the hood", Annual Economic Report 2022, June, Chapter II.
Baron, M, E Verner and W Xiong (2021): "Banking crises without panics", Quarterly Journal of Economics, vol 136, no 1, pp 51–113.
Boissay, F, C Borio, C Leonte and I Shim (2023): "Prudential policy and financial dominance: exploring the link", BIS Quarterly Review, March, pp 15–31.
Borio, C, S Claessens and N Tarashev (2022): "Entity-based vs activity-based regulation: a framework and applications to traditional financial firms and big techs", FSI Occasional Papers, no 19.
Borio, C, M Lombardi, J Yetman and E Zakrajšek (2023): "The two-regime view of inflation", BIS Papers, no 133, March.
Bourgeois, A and R Lafrogne-Joussier (2022): "La flambée des prix de l'énergie: un effet sur l'inflation réduit de moitié par le «bouclier tarifaire»", Insee Analyses, no 75, September.
Caparusso, J, Y Chen, P Dattels, R Goel and P Hiebert (2019): "Post-crisis changes in global bank business models: a new taxonomy", IMF Working Papers, WP/19/295.
Caparusso J, U Lewrick and N Tarashev (2023): "The long-run profitability and resilience of globally systemic banks", BIS Bulletin, forthcoming.
Carstens, A (2021): "Non-bank financial sector: systemic regulation needed", Foreword, BIS Quarterly Review, December, pp 1–6.
--- (2022): "A story of tailwinds and headwinds: aggregate supply and macroeconomic stabilisation", speech at the Federal Reserve Bank of Kansas City Jackson Hole symposium, 26 August.
--- (2023): "Monetary and fiscal policies as anchors of trust and stability", speech at Columbia University, New York, 17 April.
Cavallino, P, G Cornelli, P Hördahl and E Zakrajšek (2022): "'Front-loading' monetary tightening: pros and cons", BIS Bulletin, no 63, December.
Cavallo, A and O Kryvtsov (2023): "What can stockouts tell us about inflation? Evidence from online micro data", Journal of International Economics, https://doi.org/10.1016/j.jinteco.2023.103769.
Central Bank of Brazil (2022): Inflation Report – September 2022.
Christofides, L and A Peng (2006): "Contract duration and indexation in a period of real and nominal uncertainty", Labour Economics, vol 13, issue 1, pp 61–86.
De Fiore, F, M Lombardi and D Rees (2022): "Inflation indicators amid high uncertainty", BIS Bulletin, no 60, September.
Financial Stability Board (FSB) (2020): "Global Monitoring Report on Non-Bank Financial Intermediation", Financial Stability Board Report, 16 December.
Fregert, K and L Jonung (2008): "Inflation targeting is a success, so far: 100 years of evidence from Swedish wage contracts", Economics Discussion Paper, no 2008-24.
Goel, T, U Lewrick and A Mathur (2021): "Does regulation only bite the less profitable? Evidence from the too-big-to-fail reforms", BIS Working Papers, no 922.
Hofmann, B, T Park and A Tejada (2023): "Commodity prices, the dollar and stagflation risk", BIS Quarterly Review, March, pp 33–45.
Igan, D, E Kohlscheen and P Rungcharoenkitkul (2022): "Housing market risks in the wake of the pandemic", BIS Bulletin, no 50, March.
International Monetary Fund (IMF) (2023): World Economic Outlook, April.
Juselius, M and N Tarashev (2022): "When uncertainty decouples expected and unexpected losses", BIS Working Papers, no 995, January.
Laeven, L and F Valencia (2020): "Systemic banking crises database II", IMF Economic Review, vol 68, January, pp 307–61.
McCauley, R and C Shu (2019): "Recent renminbi policy and currency co-movements", Journal of International Money and Finance, vol 95(C), July, pp 444–56.
McPhail, L, P Schnabl and B Tuckman (2023): "Do banks hedge using interest rate swaps?" NBER Working Papers, no 31166.
Mink, M, J Jacobs and J De Haan (2007): "Measuring synchronicity and co-movement of business cycles with an application to the euro area", Cesifo Working Papers, no 2112, October.
Mojon B, G Nodari and S Siviero (2023): "Disinflation milestones", BIS Bulletin, no 75, May.
Organisation for Economic Co-operation and Development (OECD) (2022): "Special feature: policy responses to rising energy prices", Tax Policy Reforms 2022: OECD and Selected Partner Economies.
--- (2023): Economic Policy Committee report, May.
Rich, R and J Tracy (2004): "Uncertainty and labor contract durations", The Review of Economics and Statistics, vol 86, no 1, pp 270–87.
Shim, J and K Todorov (2023): "ETFs, illiquid assets, and fire sales", BIS Working Papers, forthcoming.