This website requires javascript for proper use
Annual Economic Report 2023 - underlying data behind the graphs
Full data set
(zip)
Chapter I: Navigating the disinflation journey -
read the chapter
Data set
Chapter I data set
(xlsx)
Images
Link in document
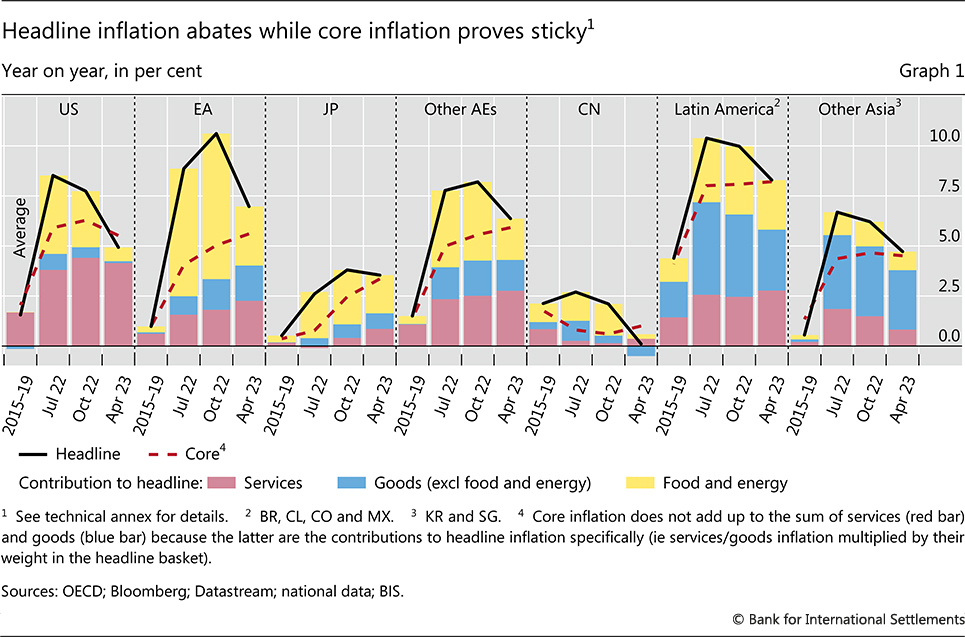
Graph 1
Headline inflation abates while core inflation proves sticky
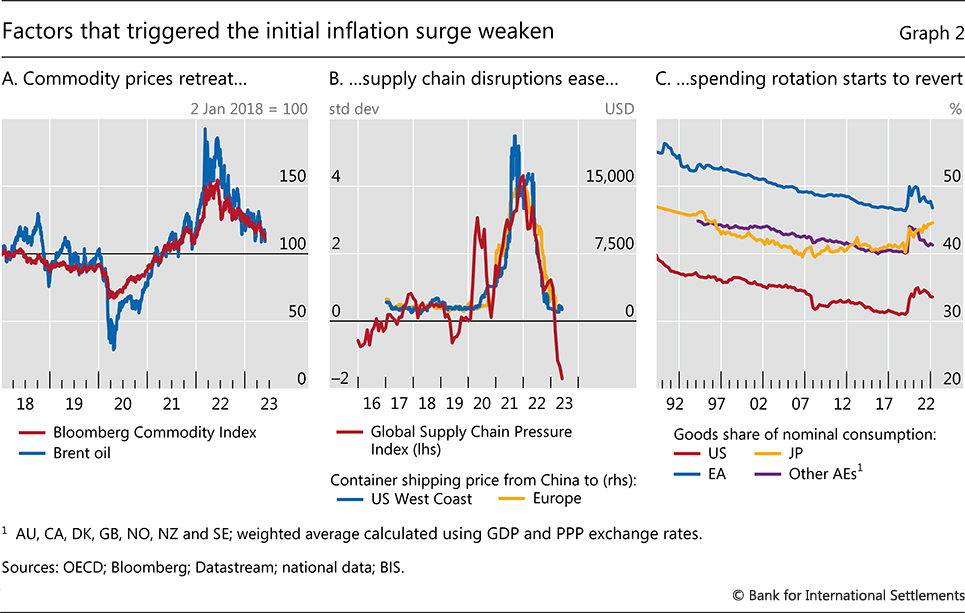
Graph 2
Factors that triggered the initial inflation surge weaken
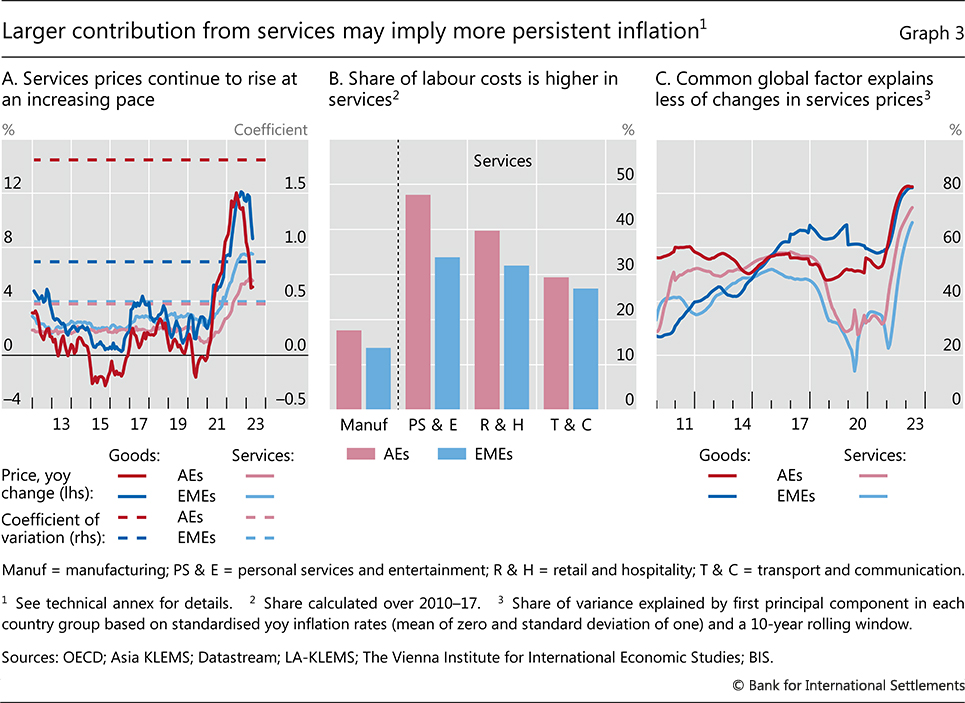
Graph 3
Larger contribution from services may imply more persistent inflation
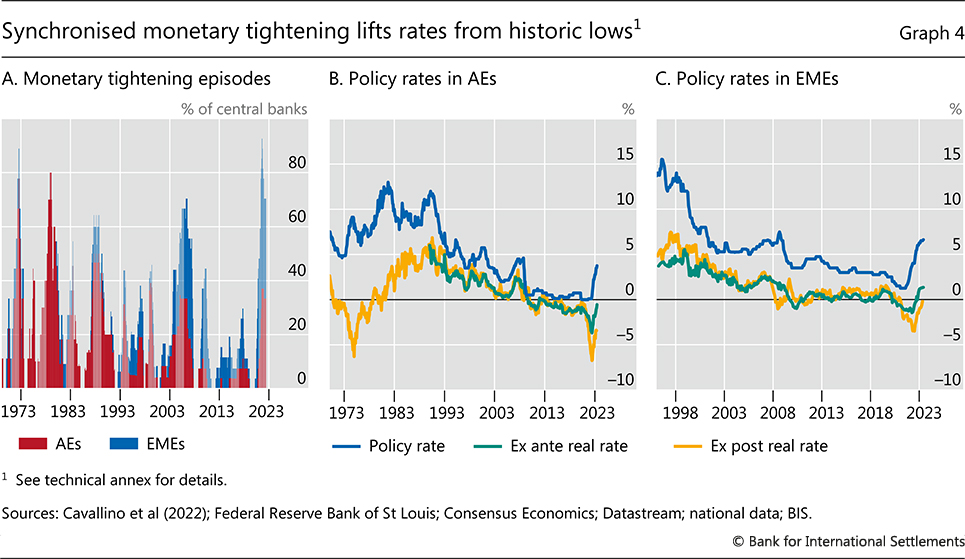
Graph 4
Synchronised monetary tightening lifts rates from historic lows
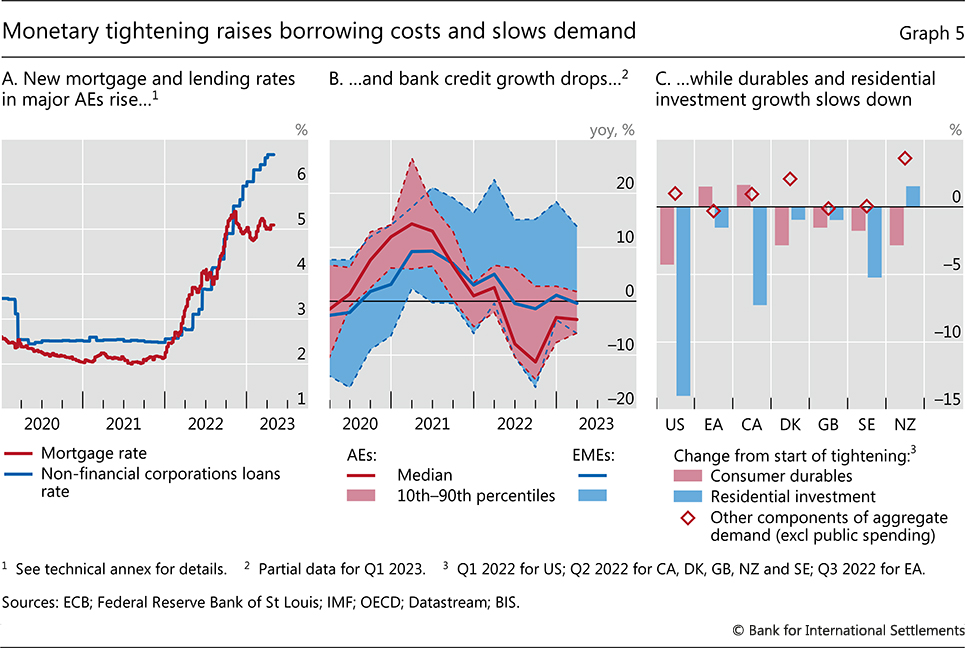
Graph 5
Monetary tightening raises borrowing costs and slows demand
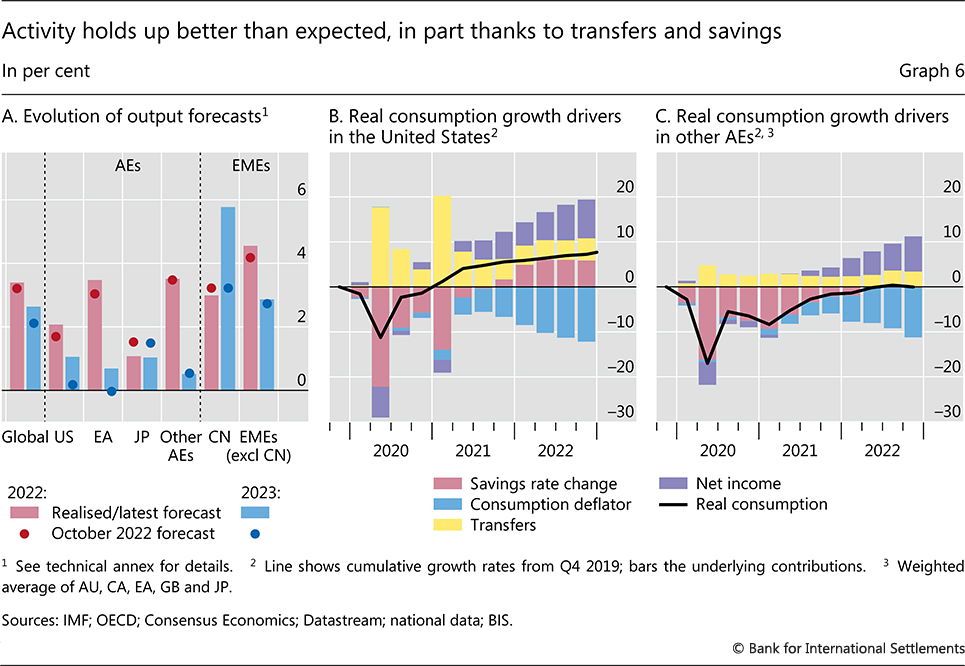
Graph 6
Activity holds up better than expected, in part thanks to transfers and savings
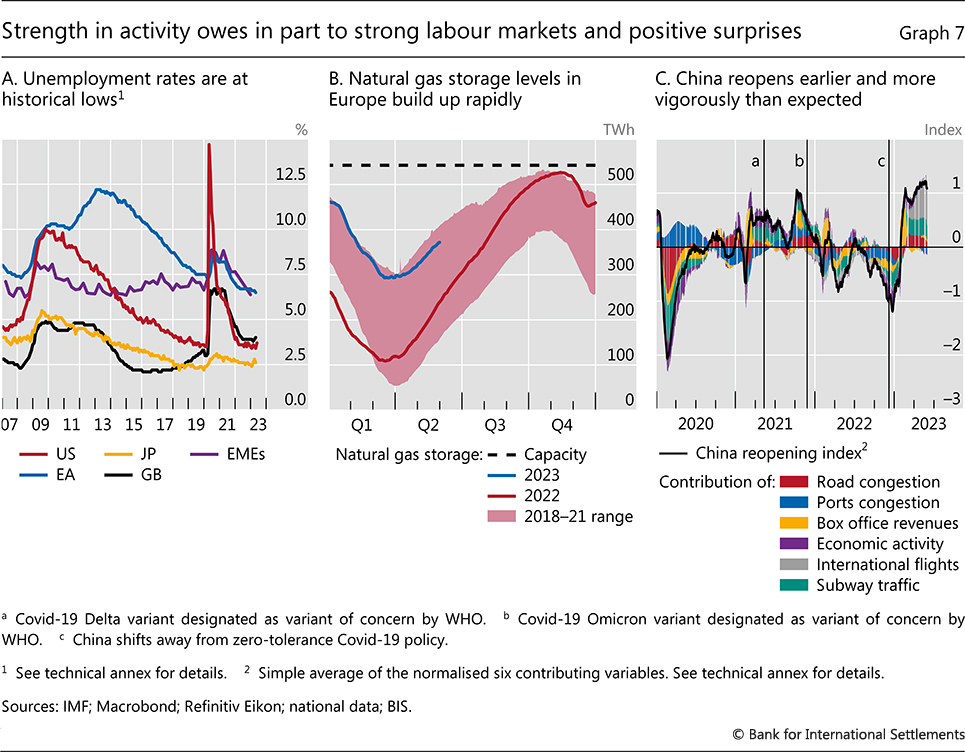
Graph 7
Strength in activity owes in part to strong labour markets and positive surprises
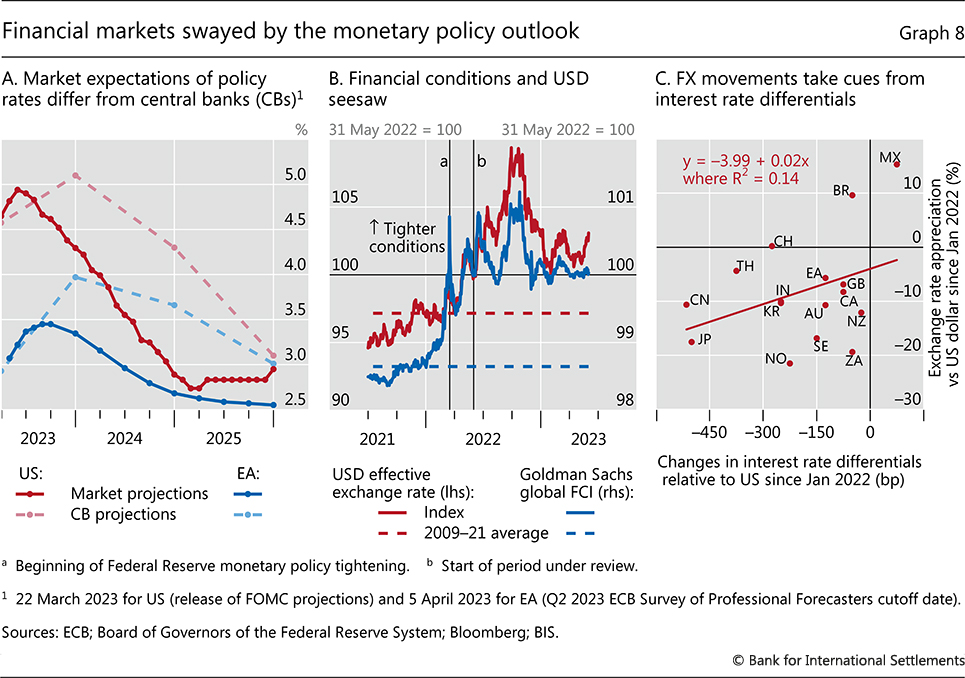
Graph 8
Financial markets swayed by the monetary policy outlook
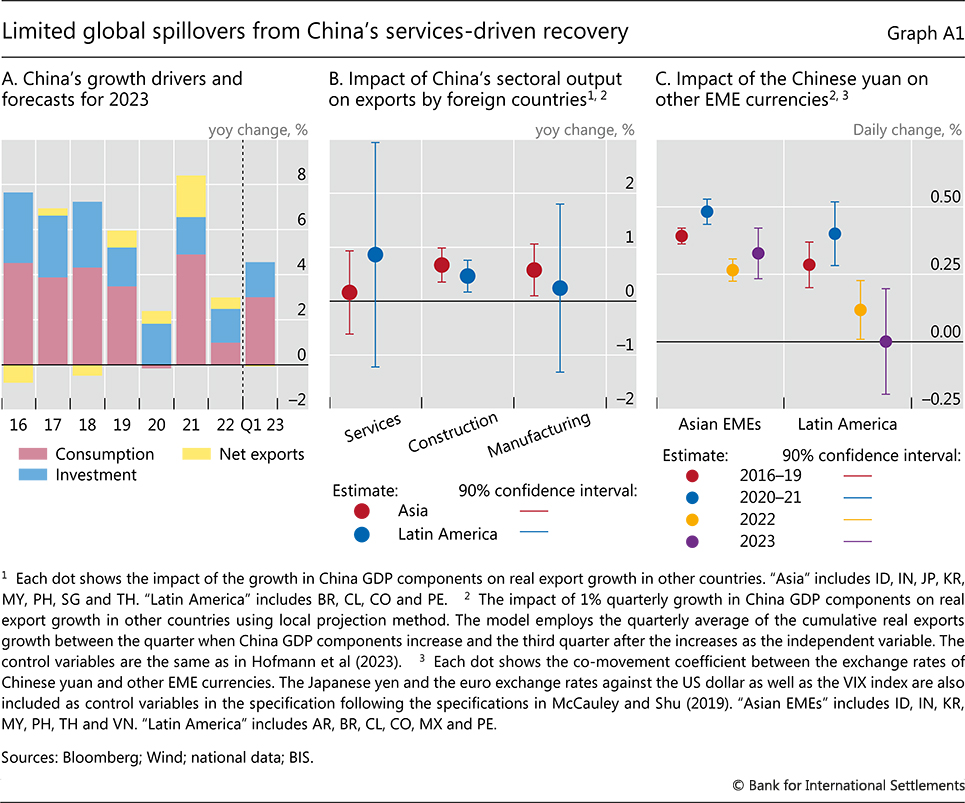
Graph A1
Limited global spillovers from China's services-driven recovery
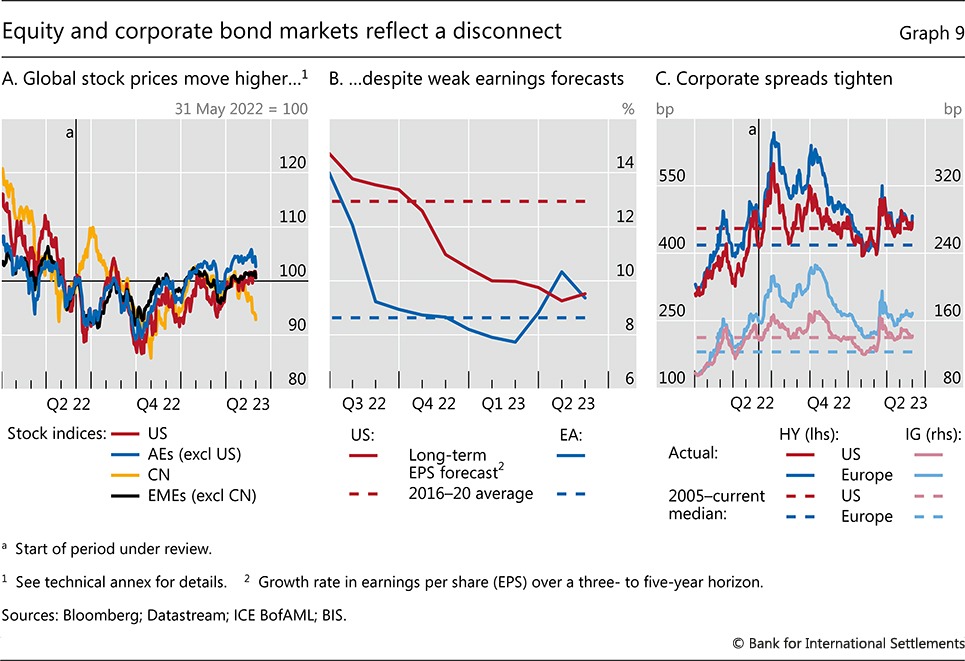
Graph 9
Equity and corporate bond markets reflect a disconnect
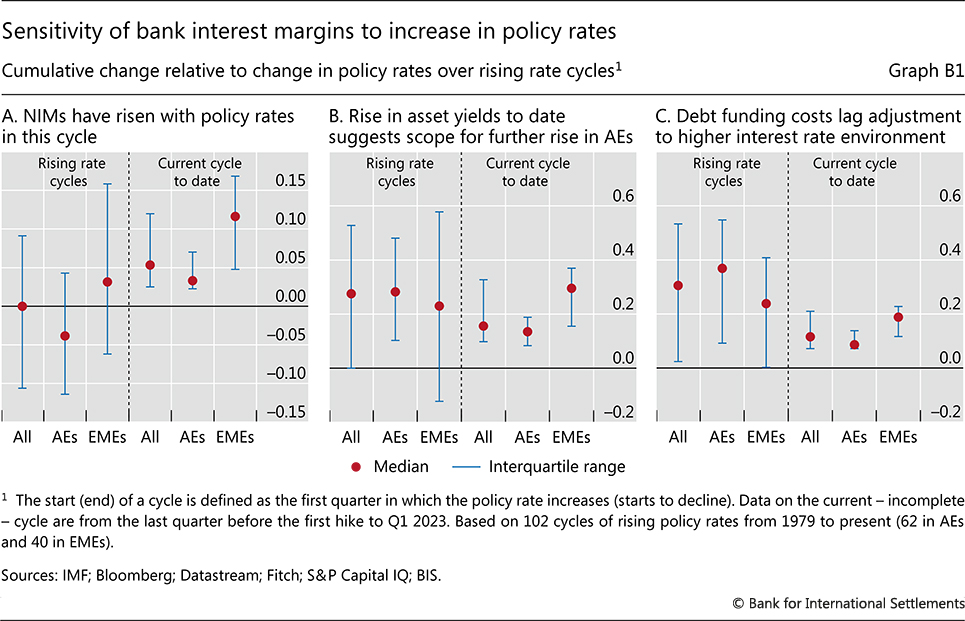
Graph B1
Sensitivity of bank interest margins to increase in policy rates
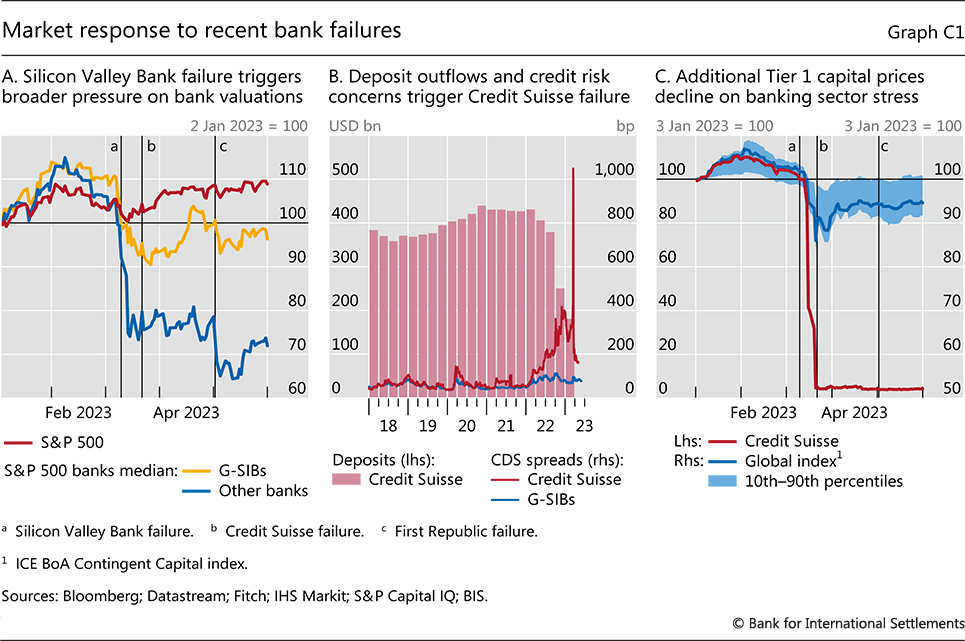
Graph C1
Market response to recent bank failures
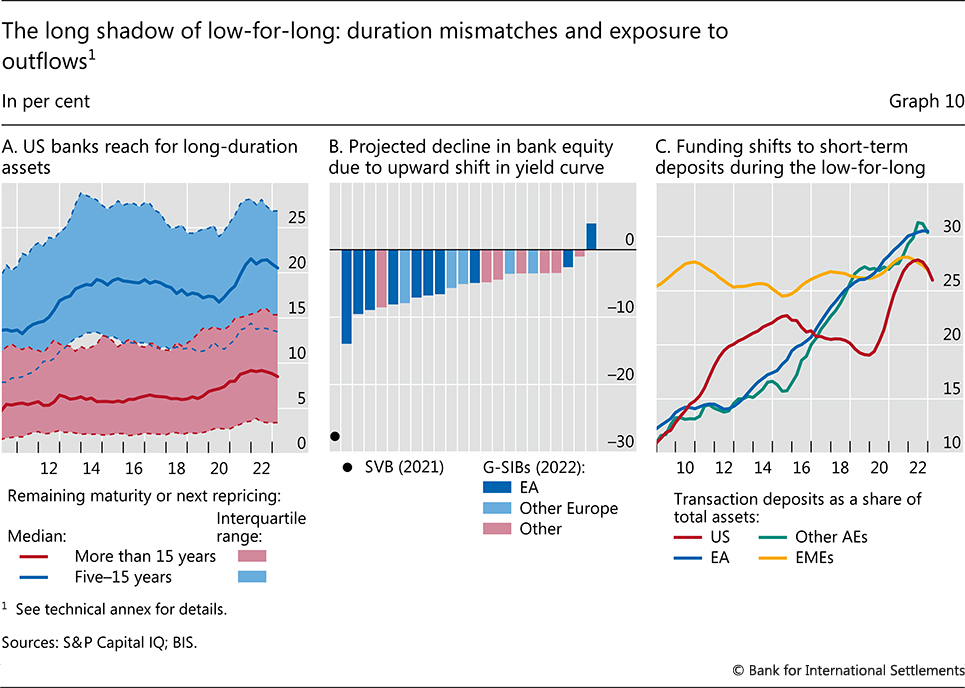
Graph 10
The long shadow of low-for-long: duration mismatches and exposure to outflows
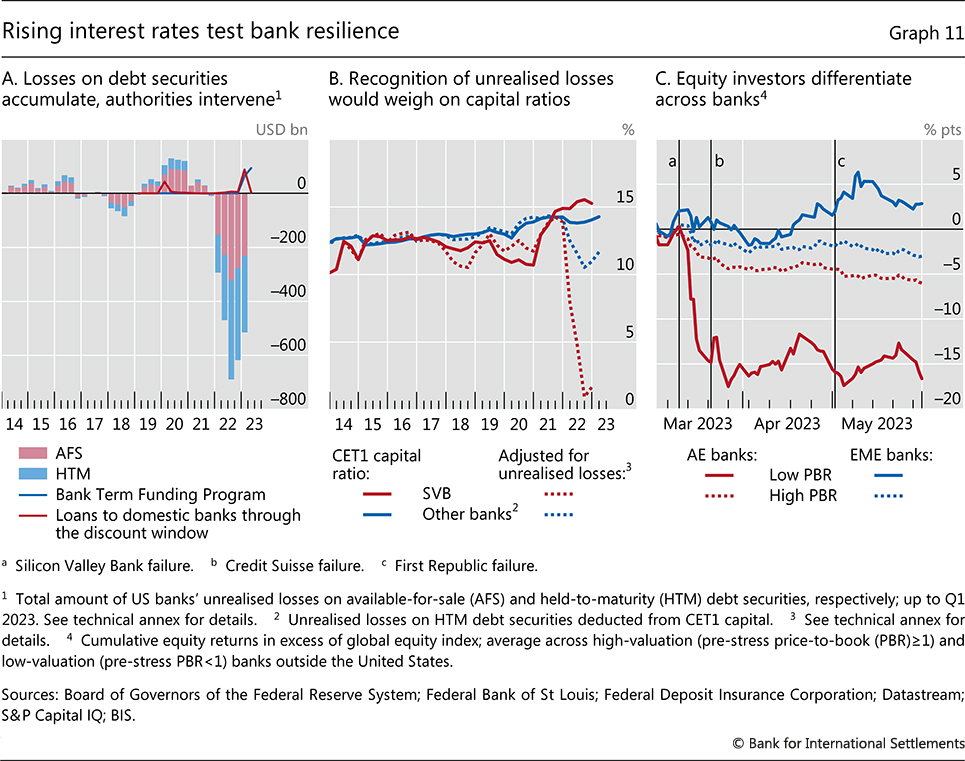
Graph 11
Rising interest rates test bank resilience
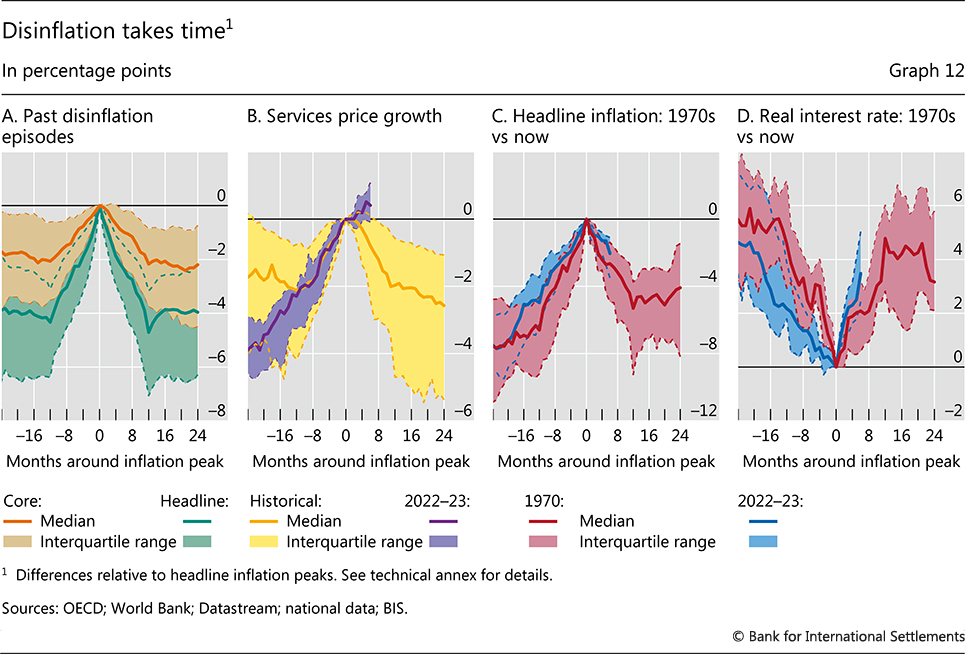
Graph 12
Disinflation takes time
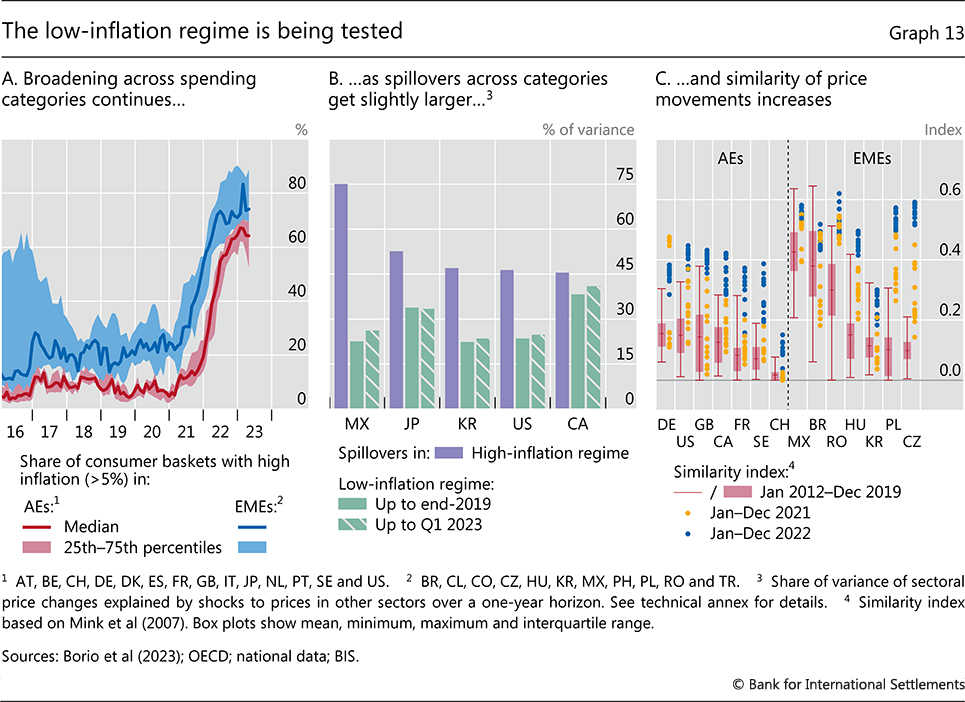
Graph 13
The low-inflation regime is being tested
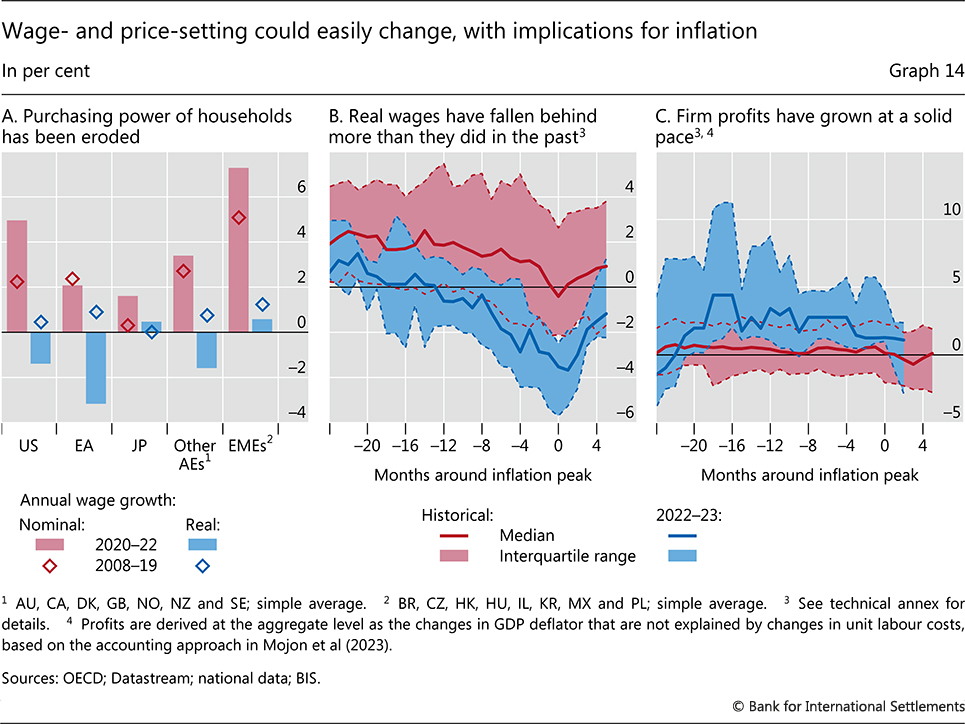
Graph 14
Wage- and price-setting could easily change, with implications for inflation
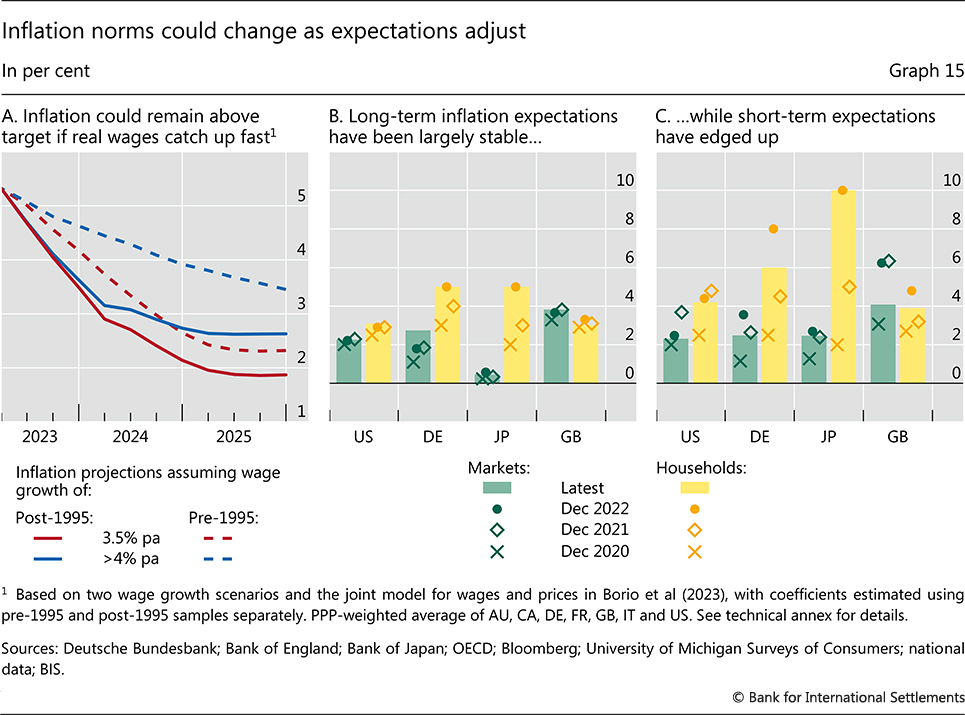
Graph 15
Inflation norms could change as expectations adjust
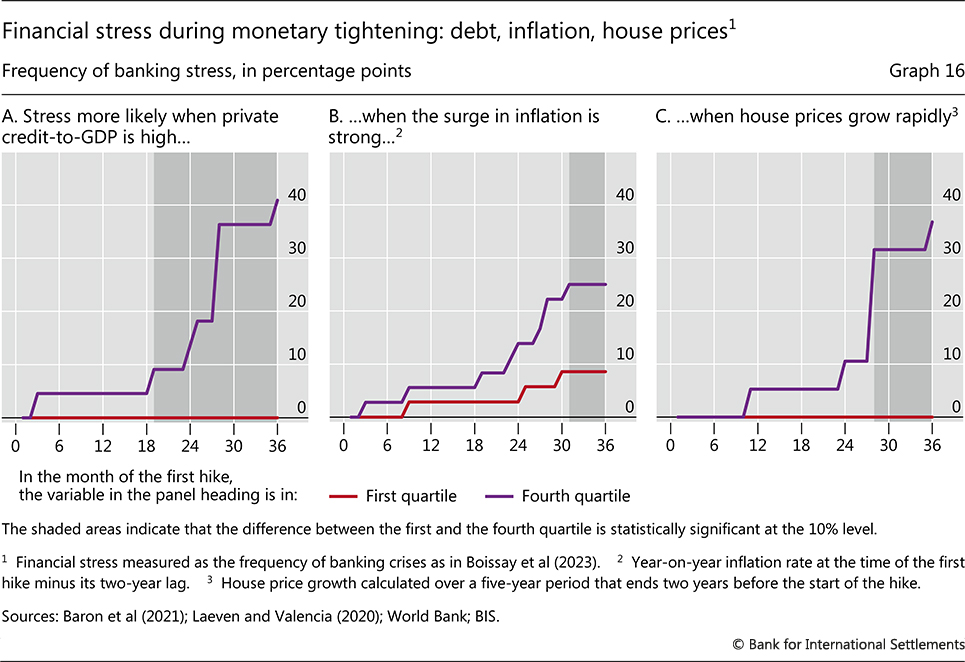
Graph 16
Financial stress during monetary tightening: debt, inflation, house prices
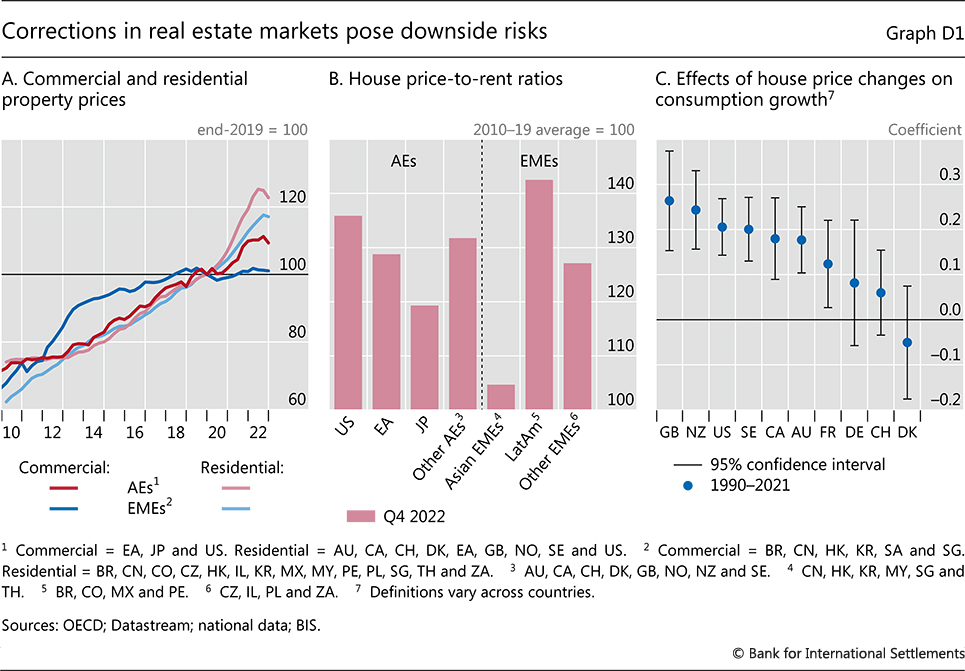
Graph D1
Corrections in real estate markets pose downside risks
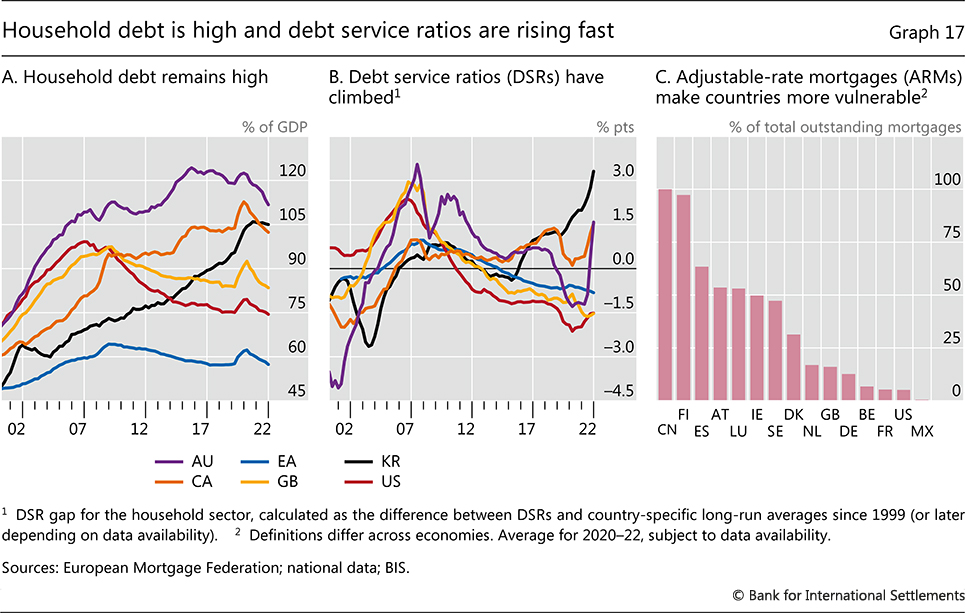
Graph 17
Household debt is high and debt service ratios are rising fast
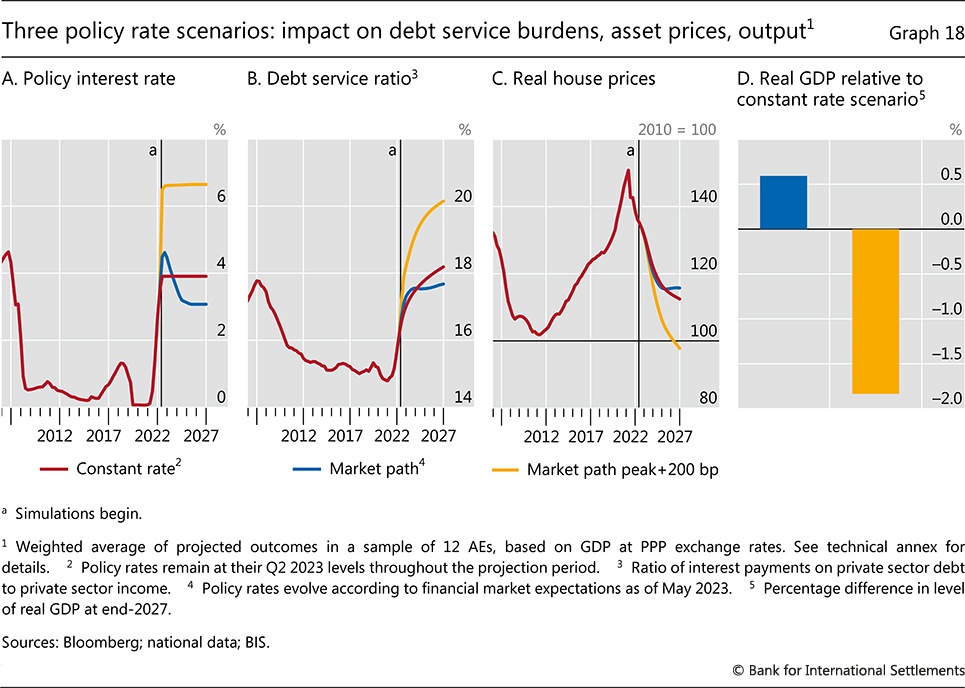
Graph 18
Three policy rate scenarios: impact on debt service burdens, asset prices, output
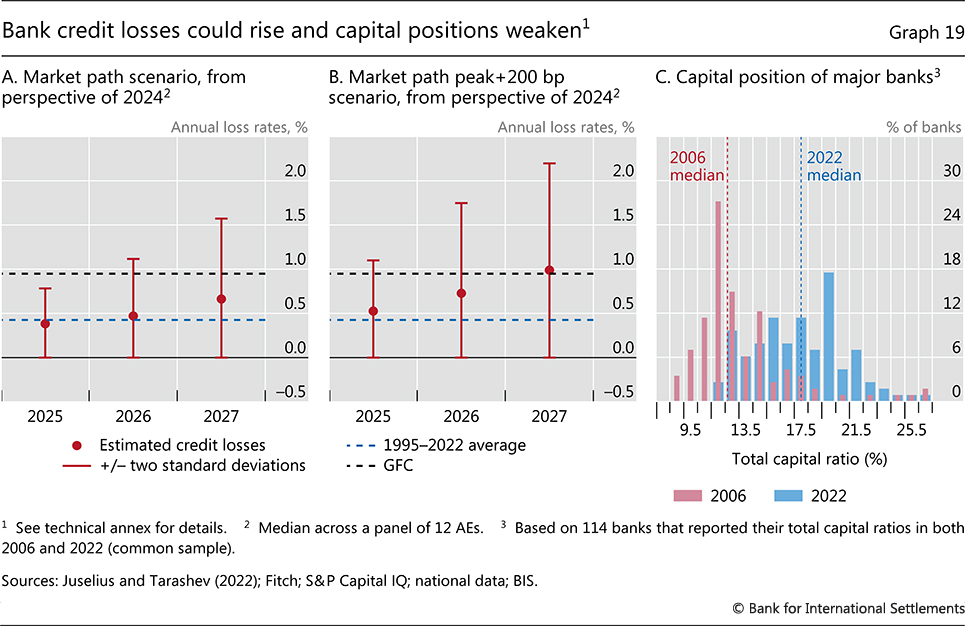
Graph 19
Bank credit losses could rise and capital positions weaken
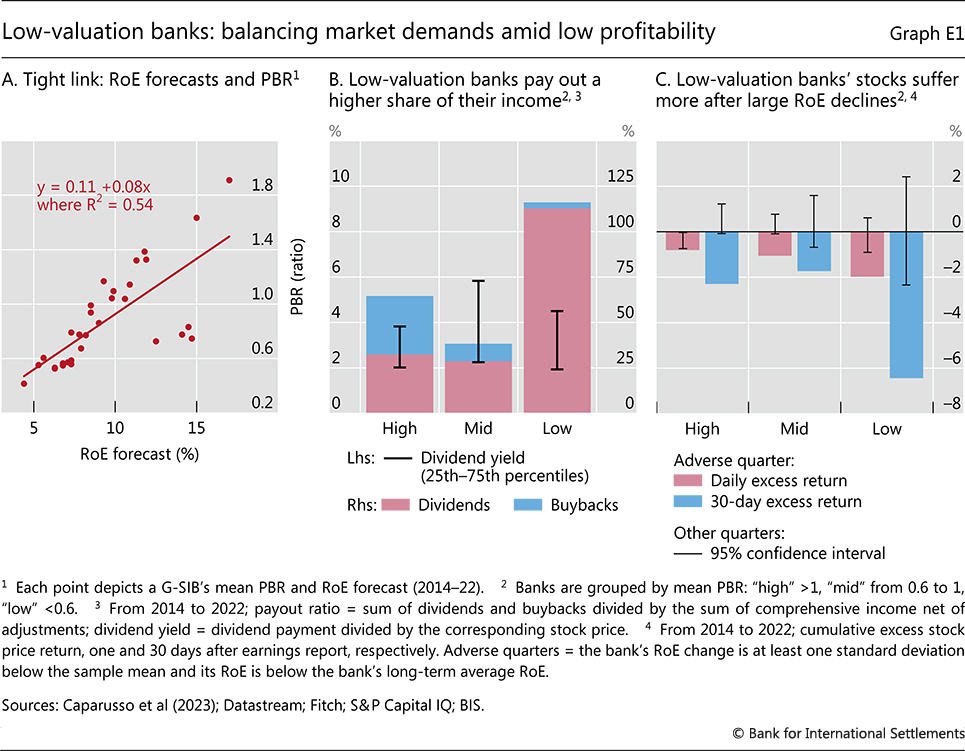
Graph E1
Low-valuation banks: balancing market demands amid low profitability
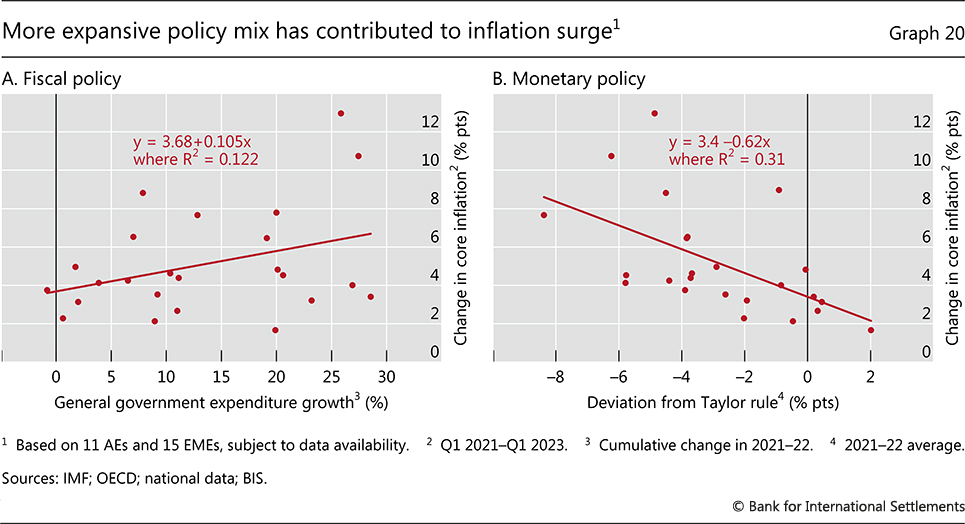
Graph 20
More expansive policy mix has contributed to inflation surge
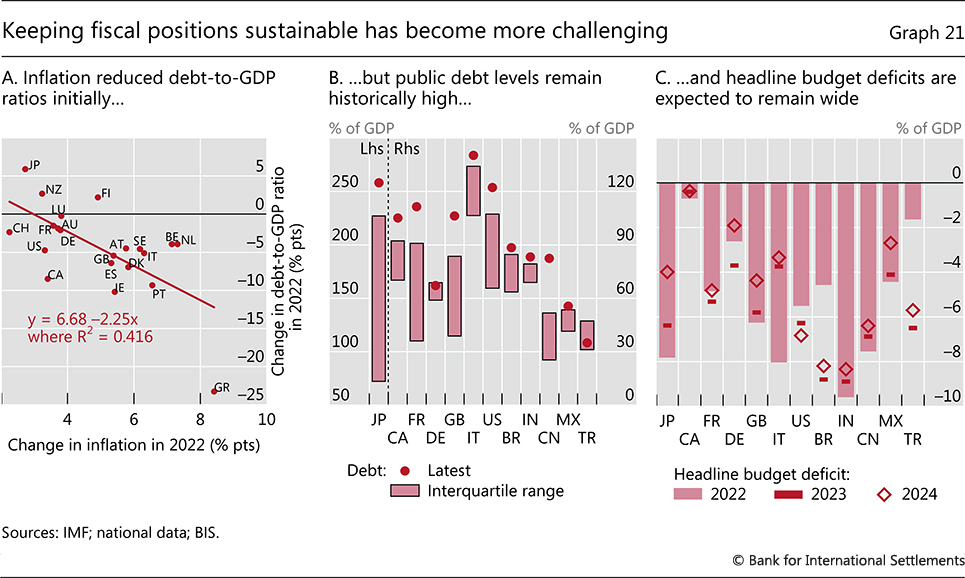
Graph 21
Keeping fiscal positions sustainable has become more challenging
Chapter II: Monetary and fiscal policy: safeguarding stability and trust -
read the chapter
Data set
Chapter II data set
(xlsx)
Images
Link in document
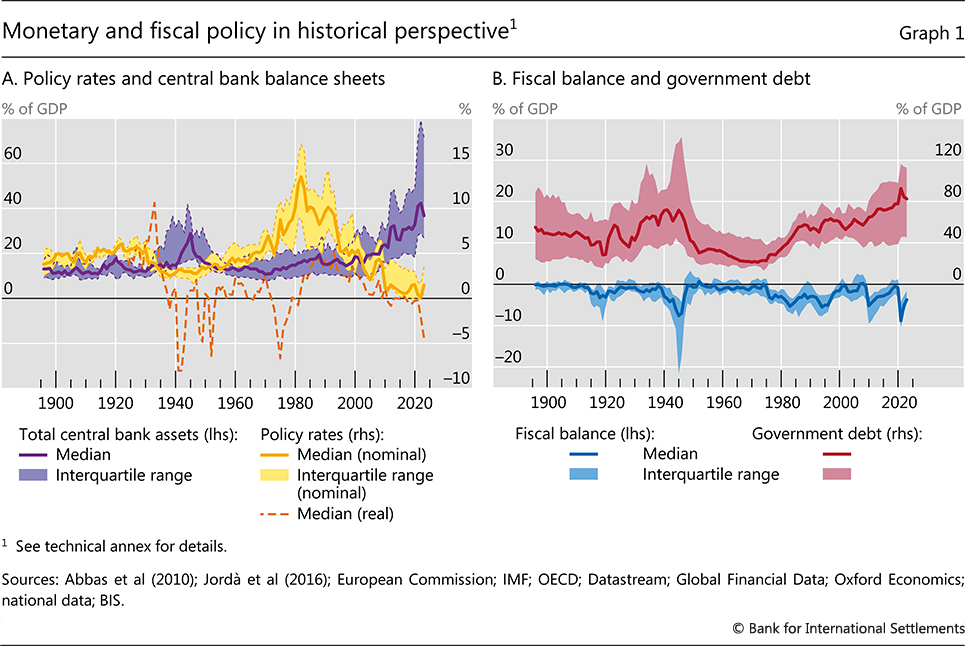
Graph 1
Monetary and fiscal policy in historical perspective
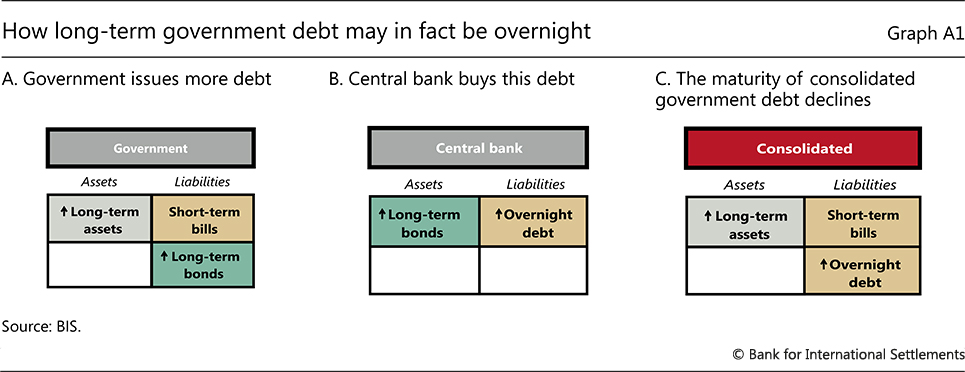
Graph A1
How long-term government debt may in fact be overnight
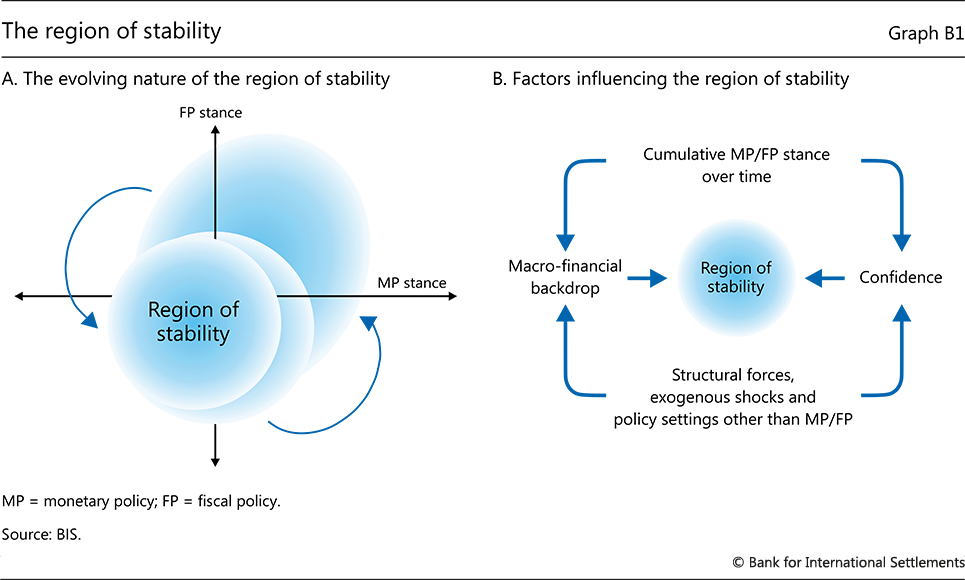
Graph B1
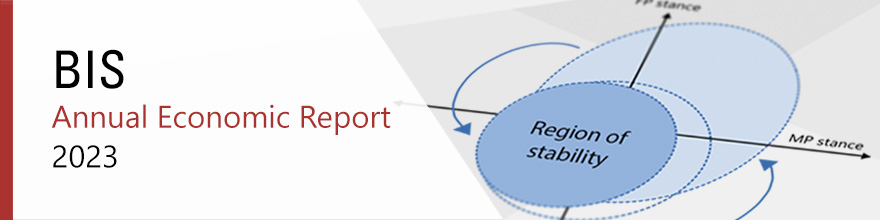
The region of stability
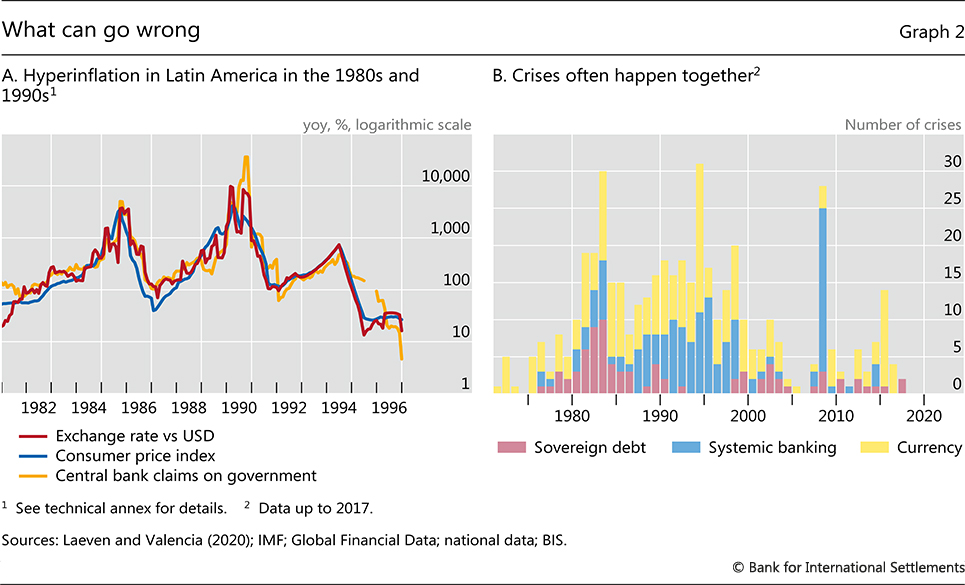
Graph 2
What can go wrong
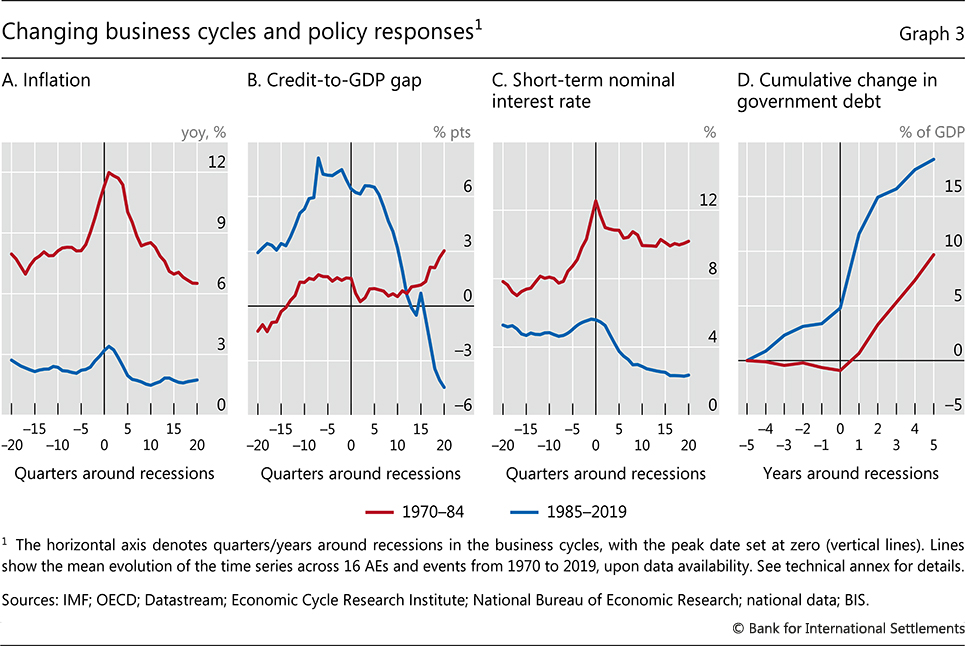
Graph 3
Changing business cycles and policy responses
Graph 4
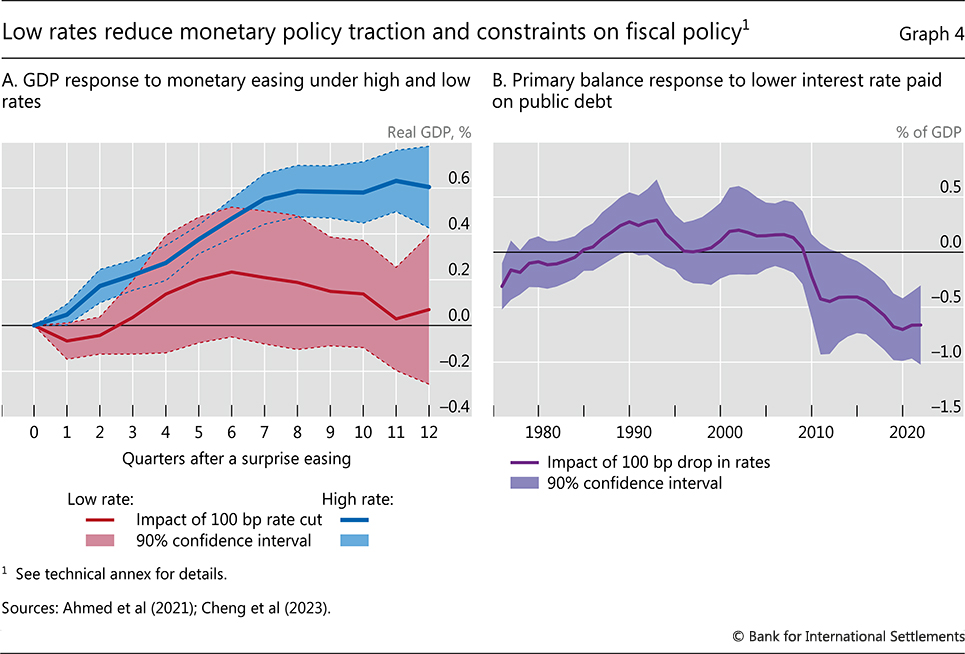
Low rates reduce monetary policy traction and constraints on fiscal policy
Graph 5
Central bank holdings of government debt
Graph 6
Monetary and fiscal policy in advanced and emerging market economies
Graph 7
Inflation and crises
Graph 8
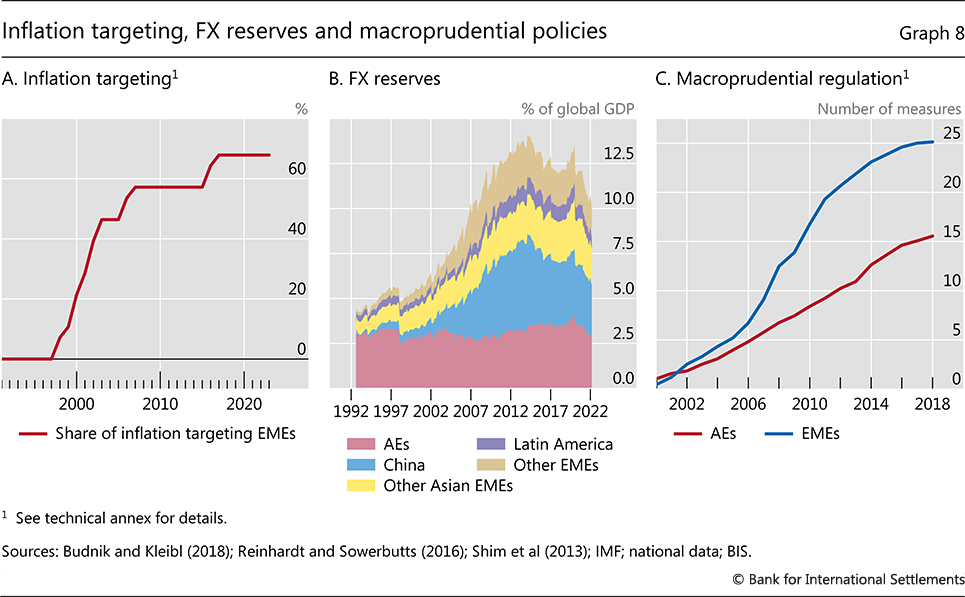
Inflation targeting, FX reserves and macroprudential policies
Graph 9
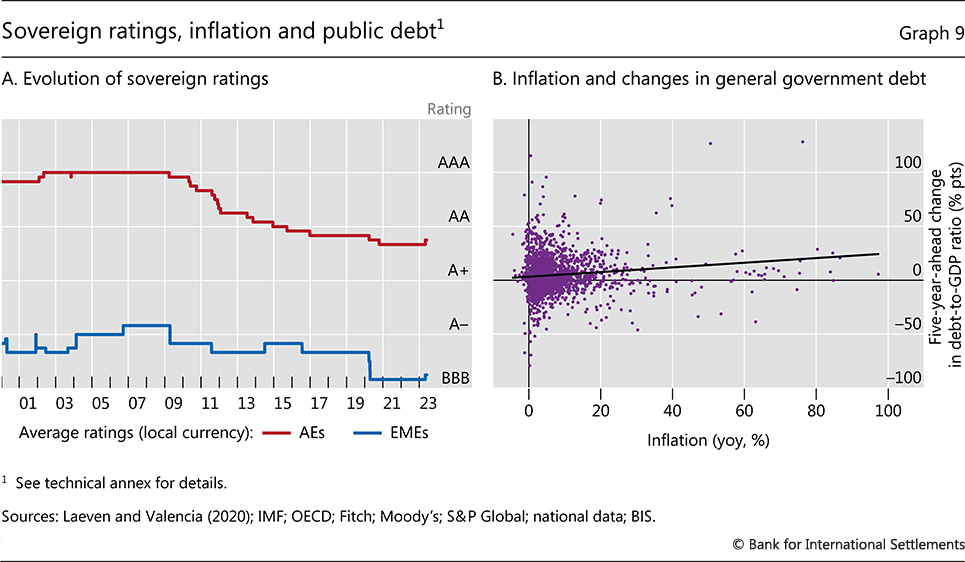
Sovereign ratings, inflation and public debt
Graph C1
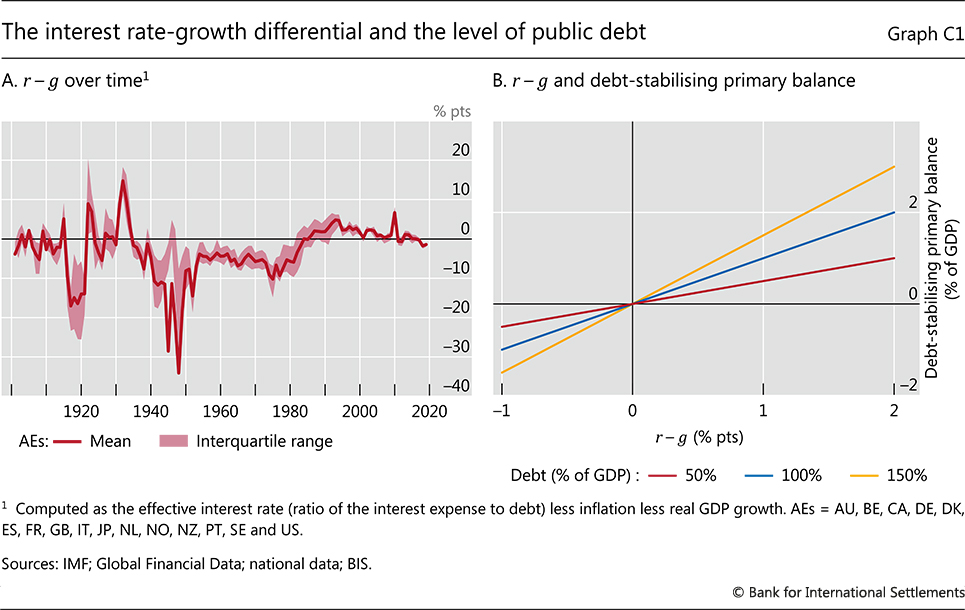
The interest rate-growth differential and the level of public debt
Graph 10
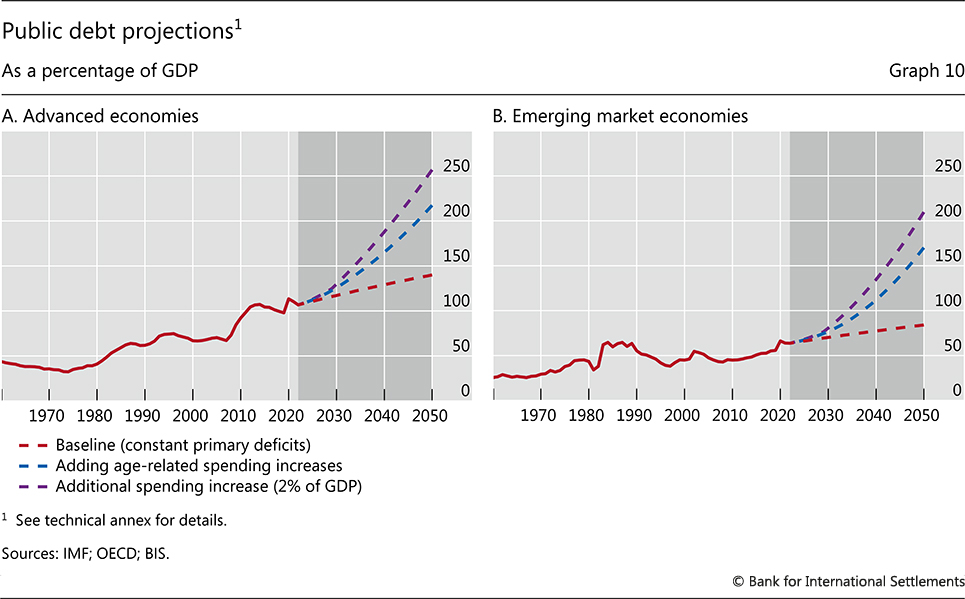
Public debt projections
Graph 11
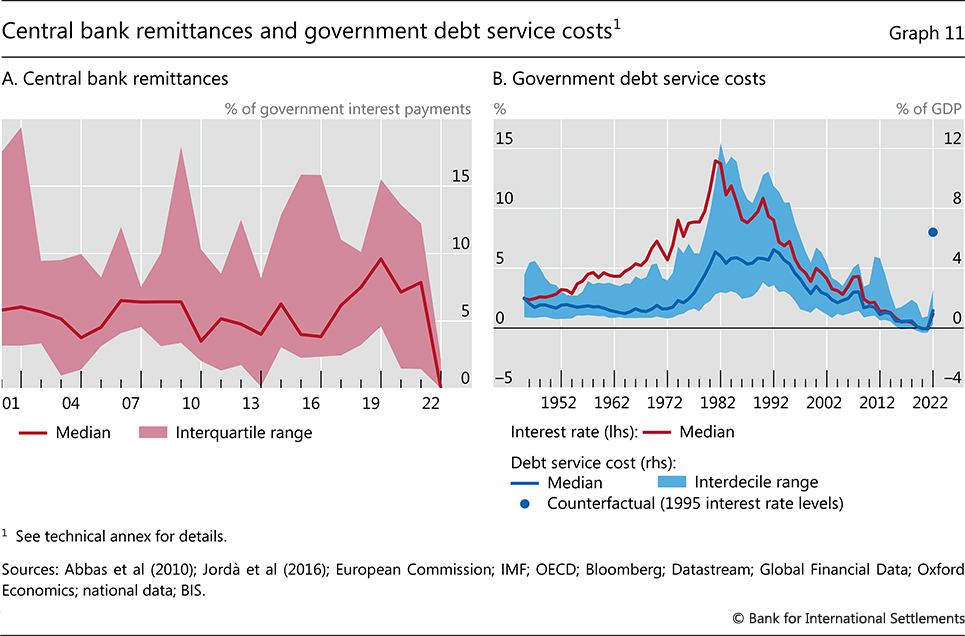
Central bank remittances and government debt service costs
Graph 12
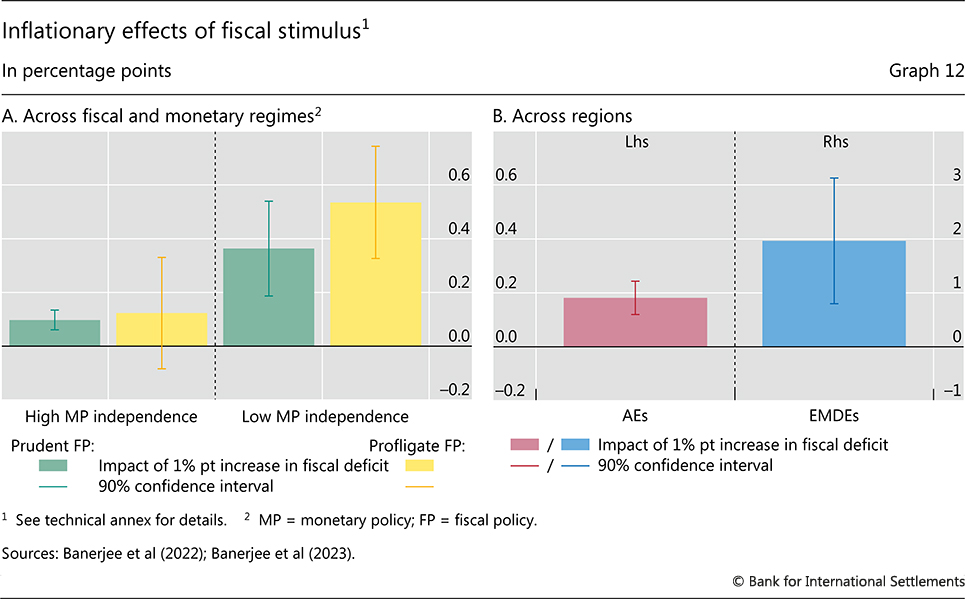
Inflationary effects of fiscal stimulus
Graph 13
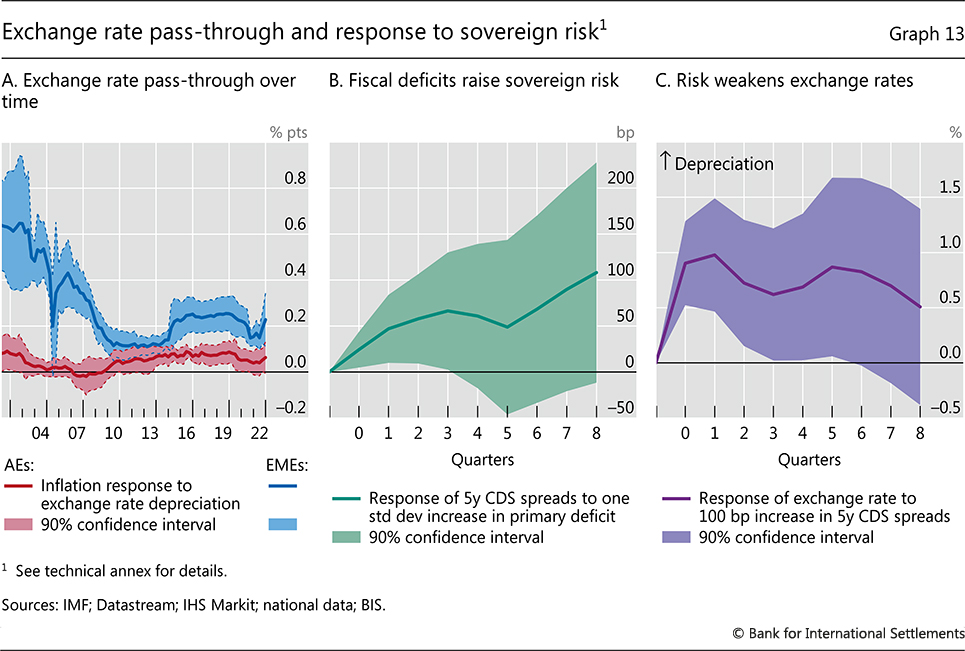
Exchange rate pass-through and response to sovereign risk
Graph 14
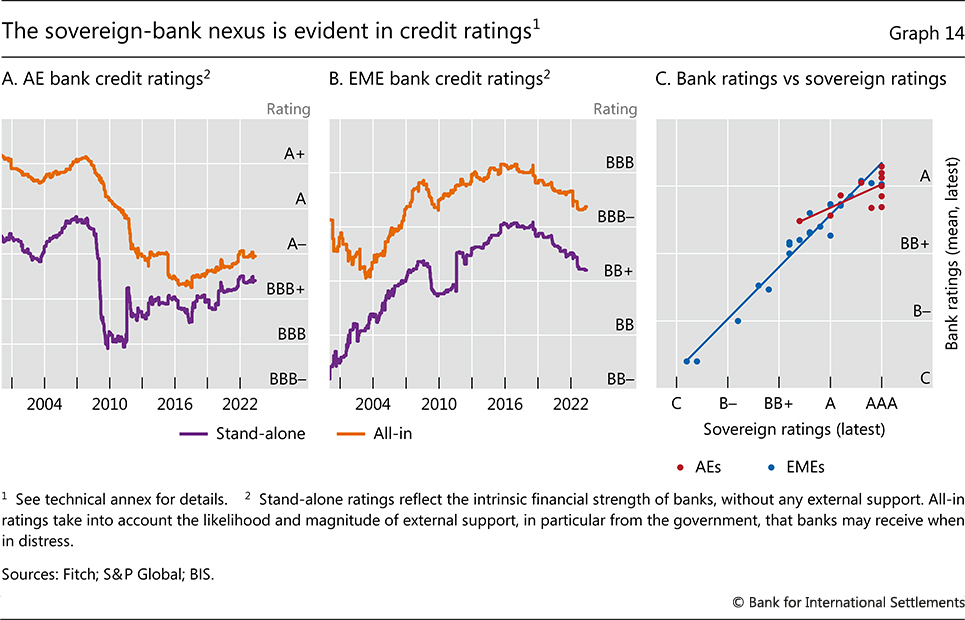
The sovereign-bank nexus is evident in credit ratings
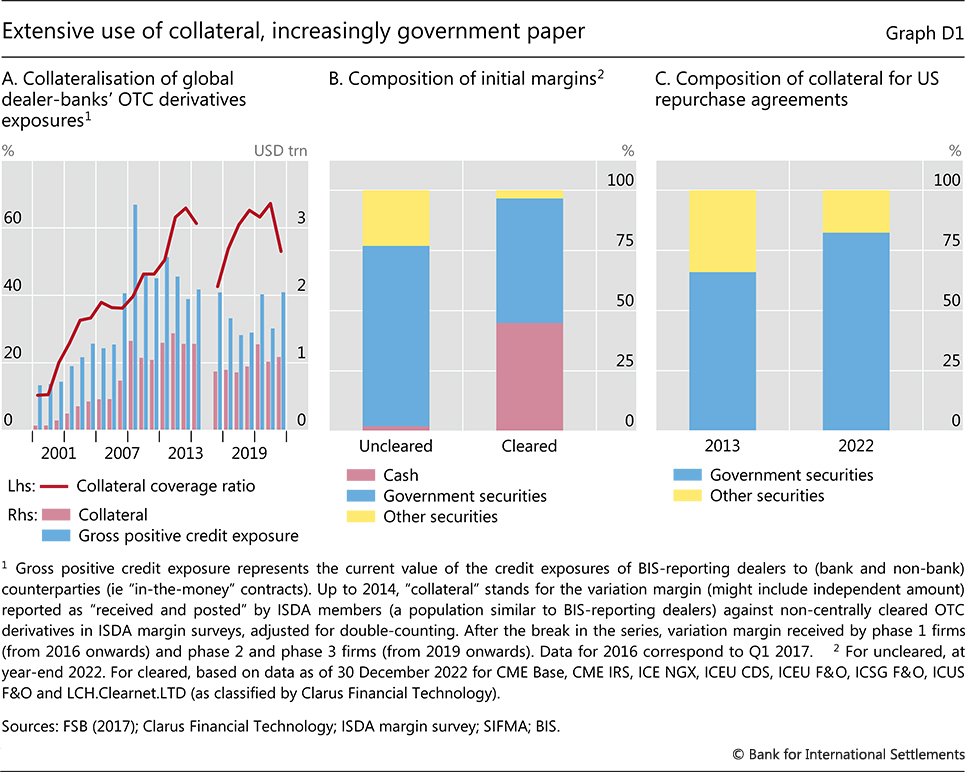
Graph D1
Extensive use of collateral, increasingly government paper
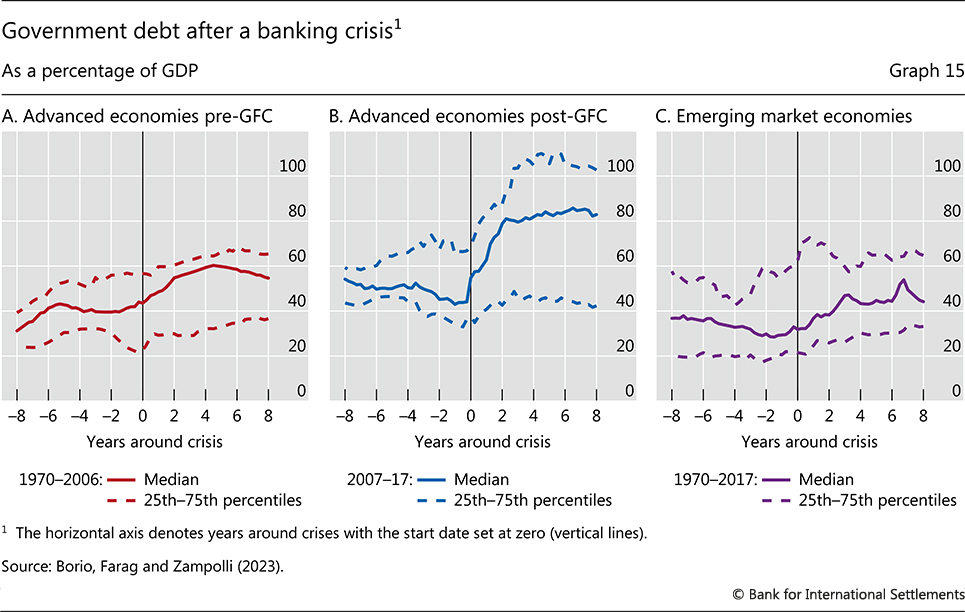
Graph 15
Government debt after a banking crisis
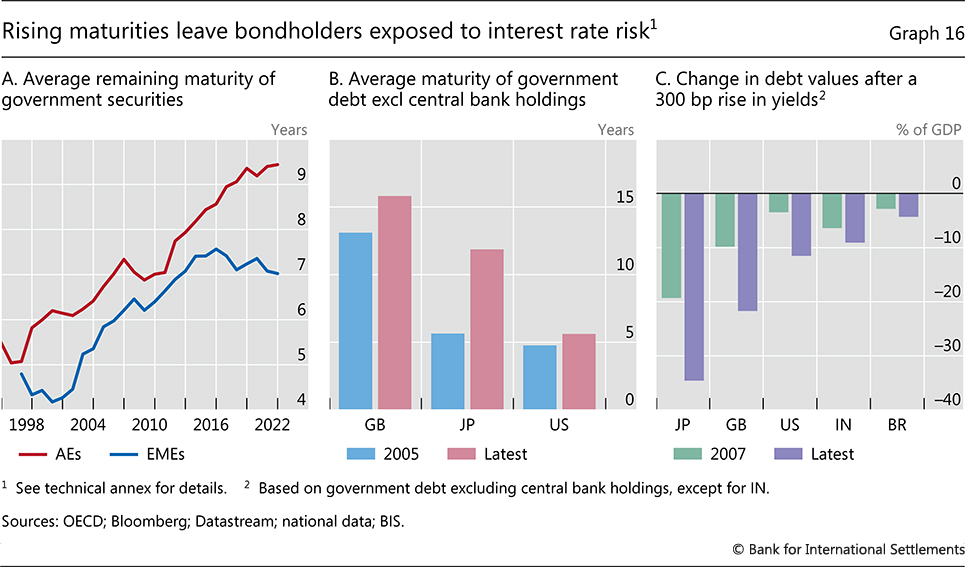
Graph 16
Rising maturities leave bondholders exposed to interest rate risk
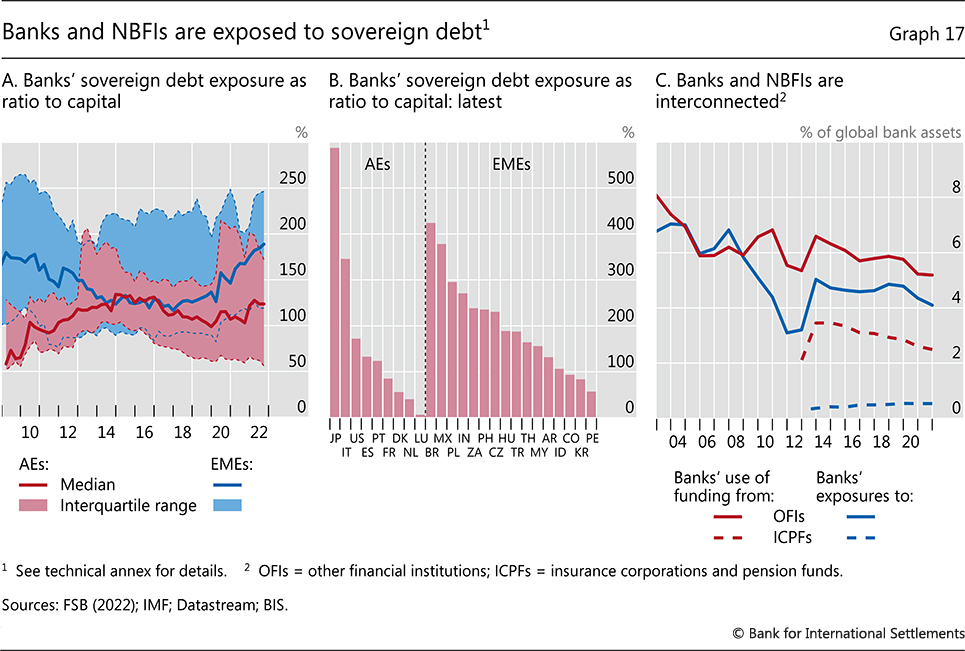
Graph 17
Banks and NBFIs are exposed to sovereign debt
Graph 18
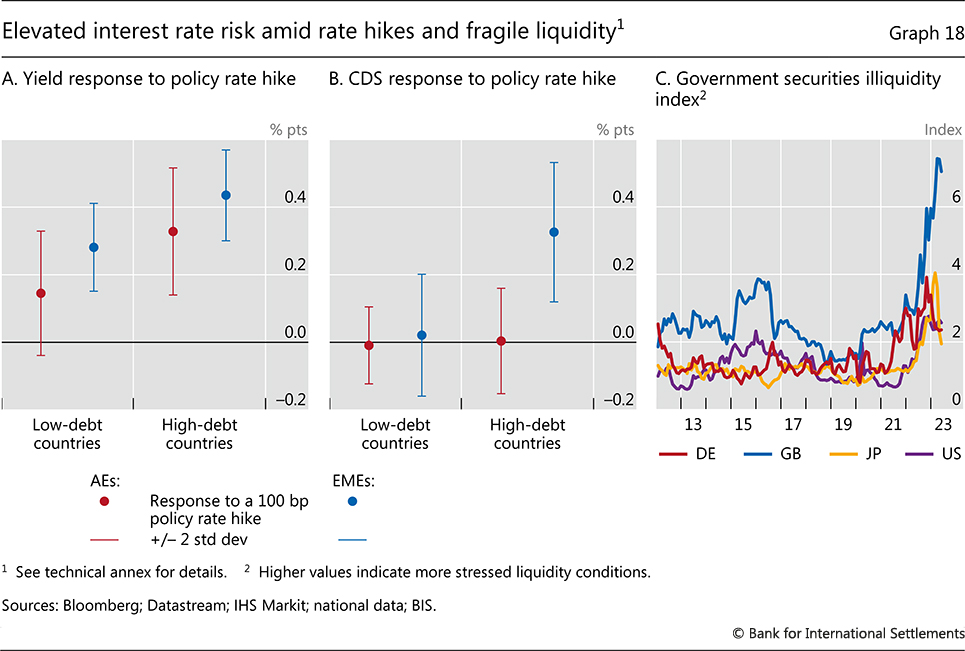
Elevated interest rate risk amid rate hikes and fragile liquidity
Chapter III: Blueprint for the future monetary system: improving the old, enabling the new -
read the chapter
Data set
Chapter III data set
(xlsx)
Images
Link in document
Graph 1
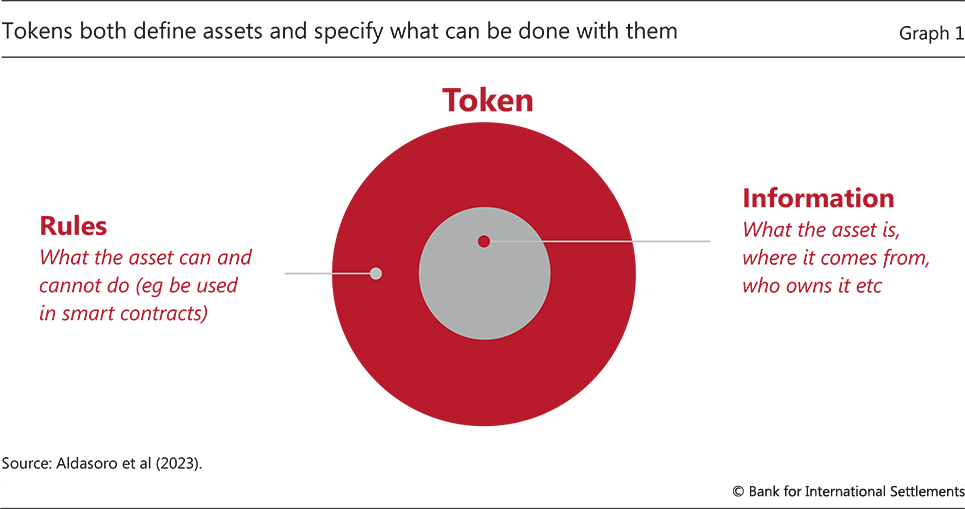
Tokens both define assets and specify what can be done with them
Graph 2
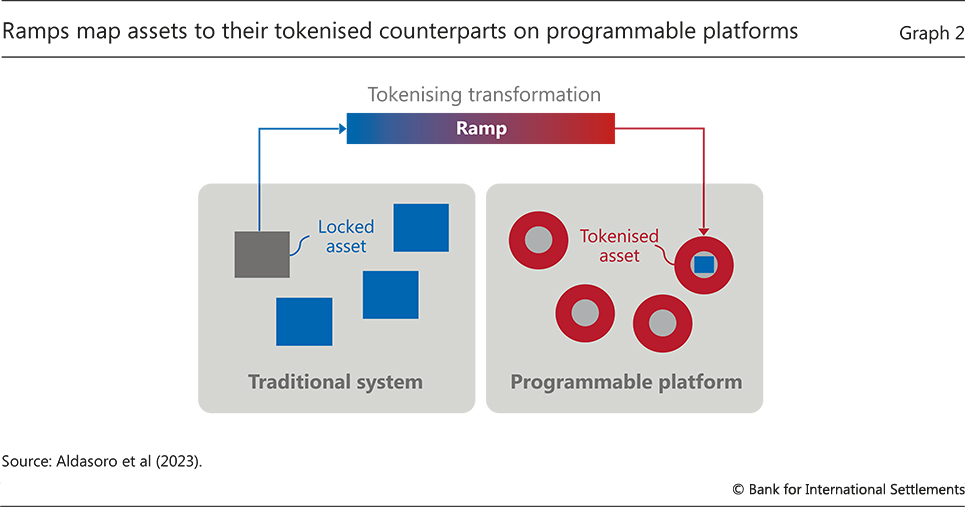
Ramps map assets to their tokenised counterparts on programmable platforms
Graph 3
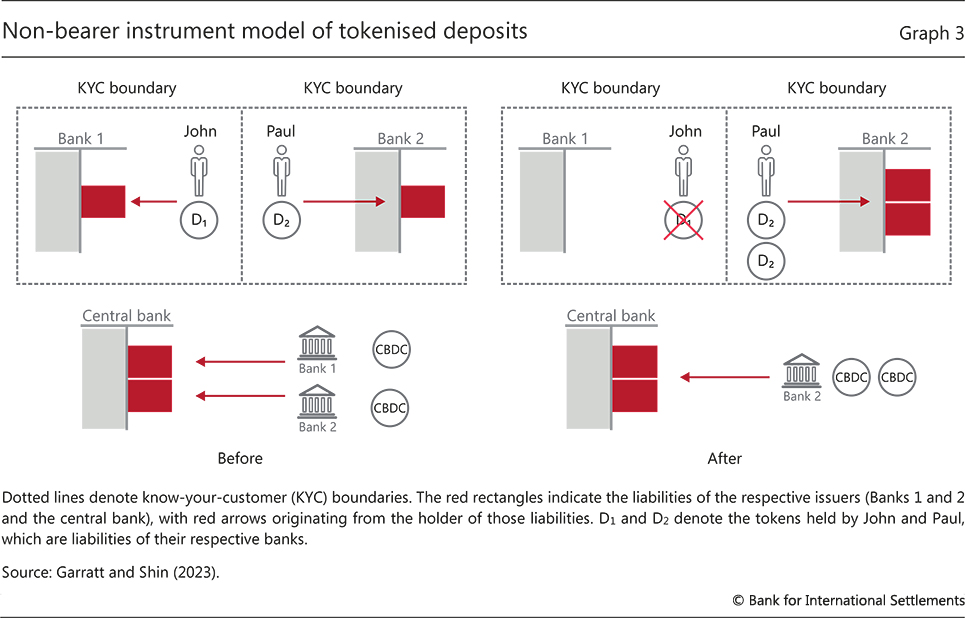
Non-bearer instrument model of tokenised deposits
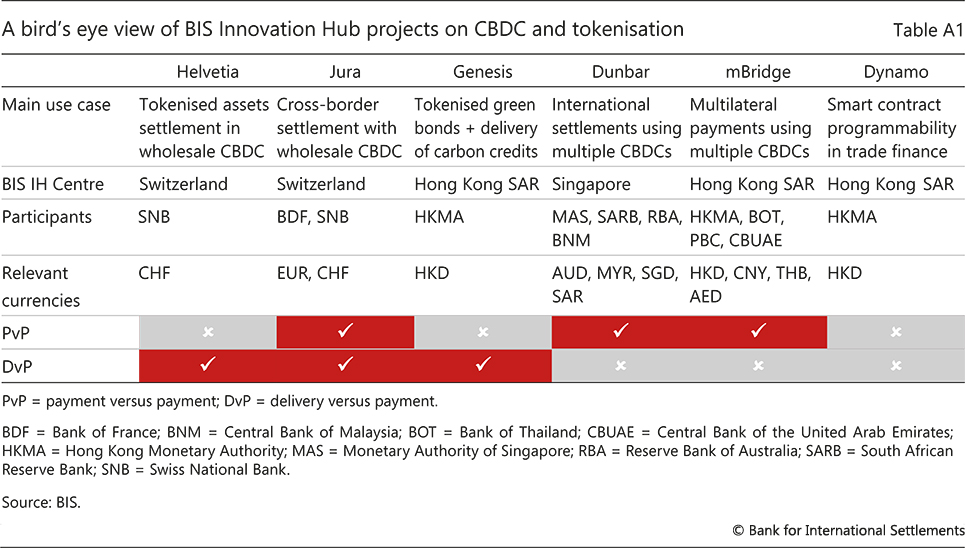
Table A1
A bird's eye view of BIS Innovation Hub projects on CBDC and tokenisation
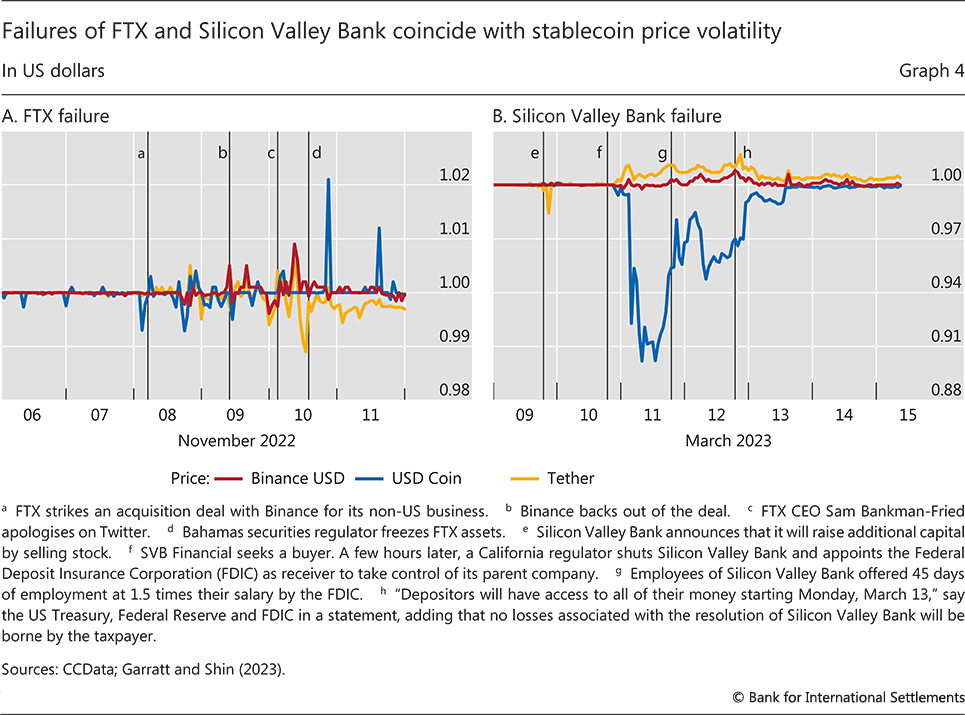
Graph 4
Failures of FTX and Silicon Valley Bank coincide with stablecoin price volatility
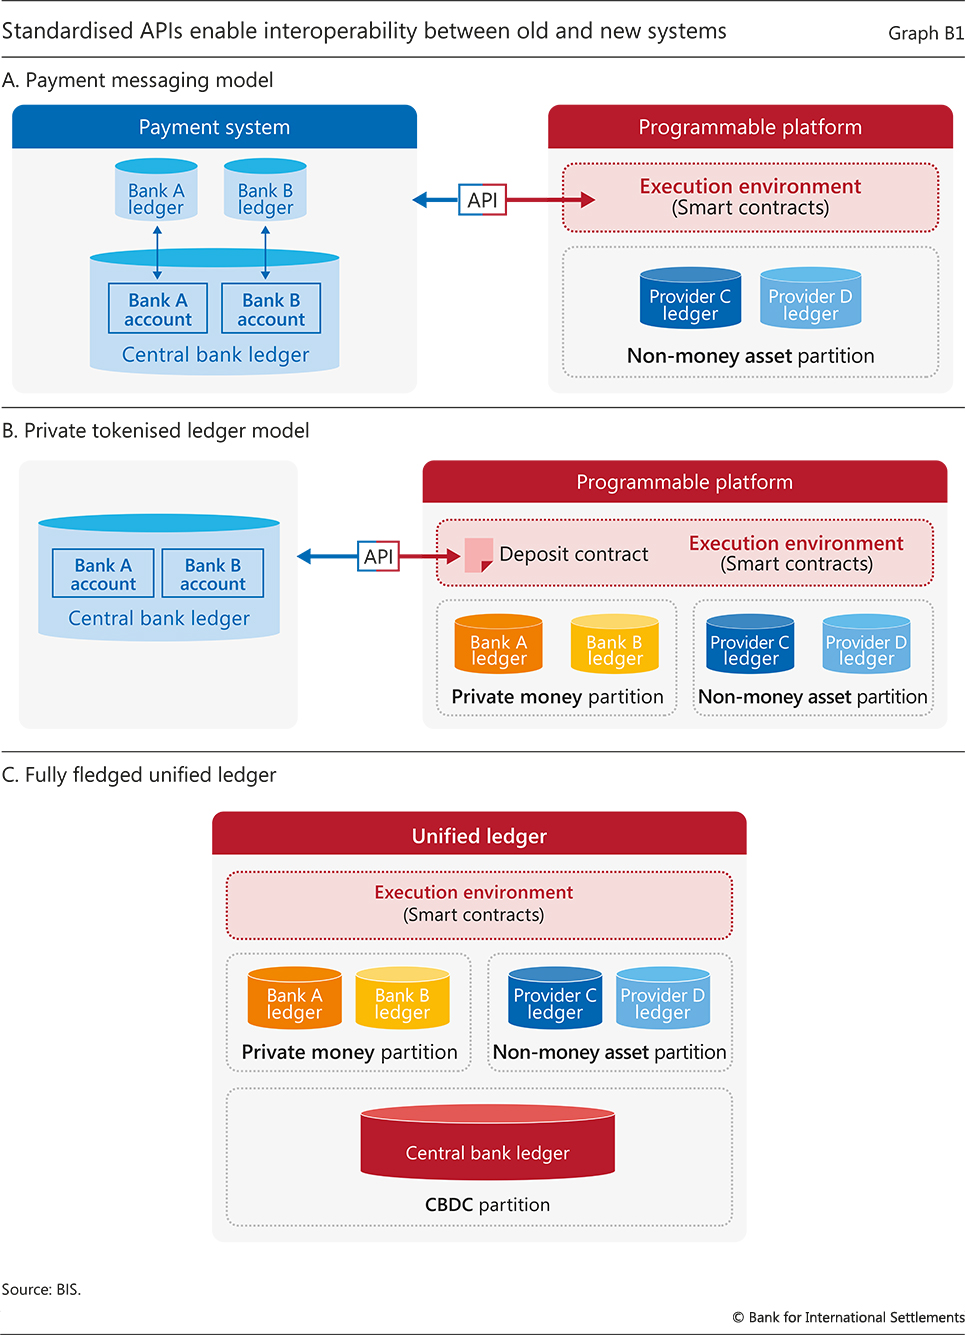
Graph B1
Standardised APIs enable interoperability between old and new systems
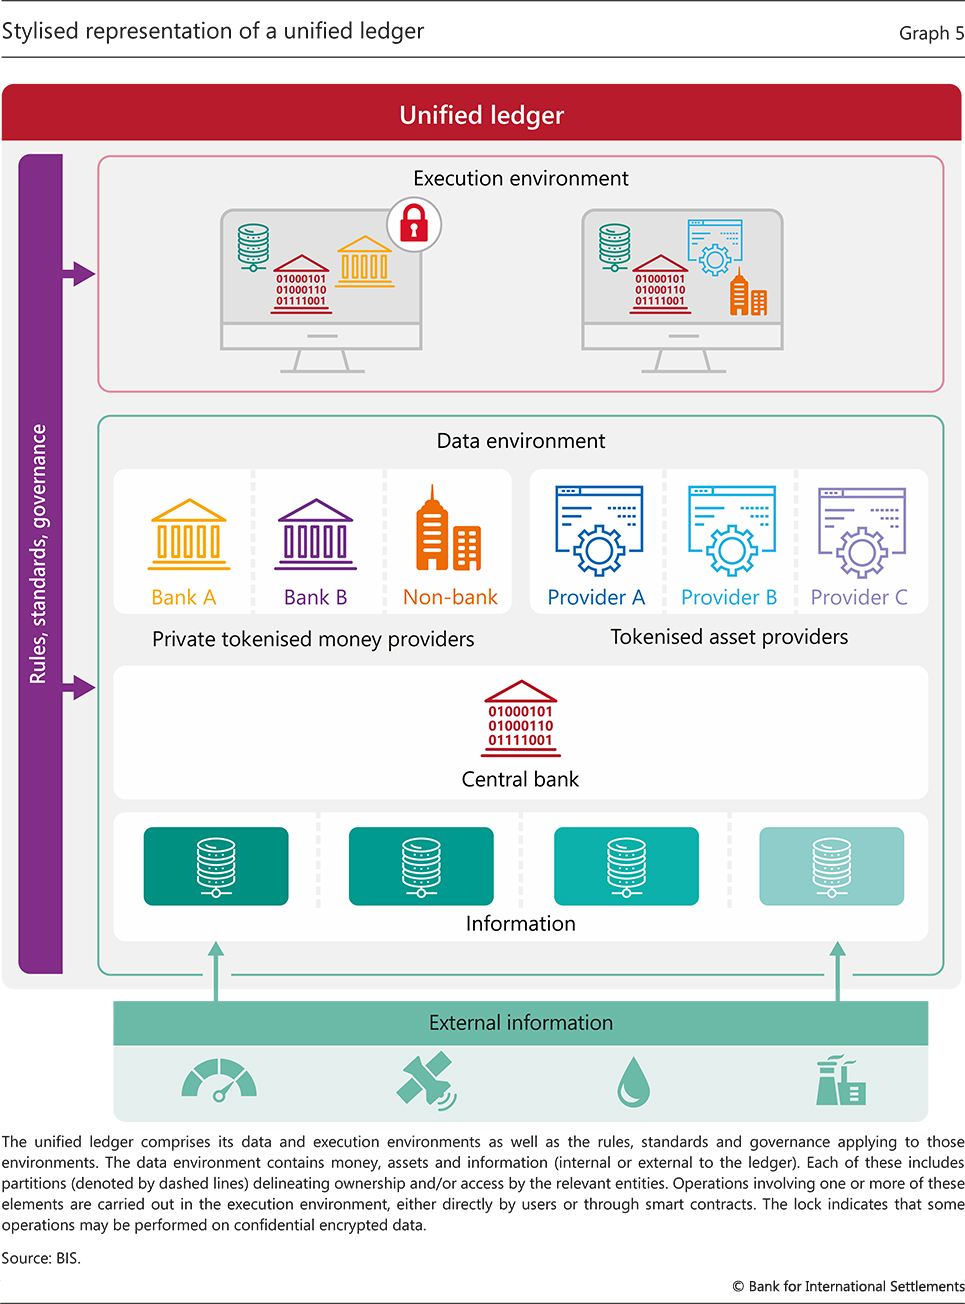
Graph 5
Stylised representation of a unified ledger
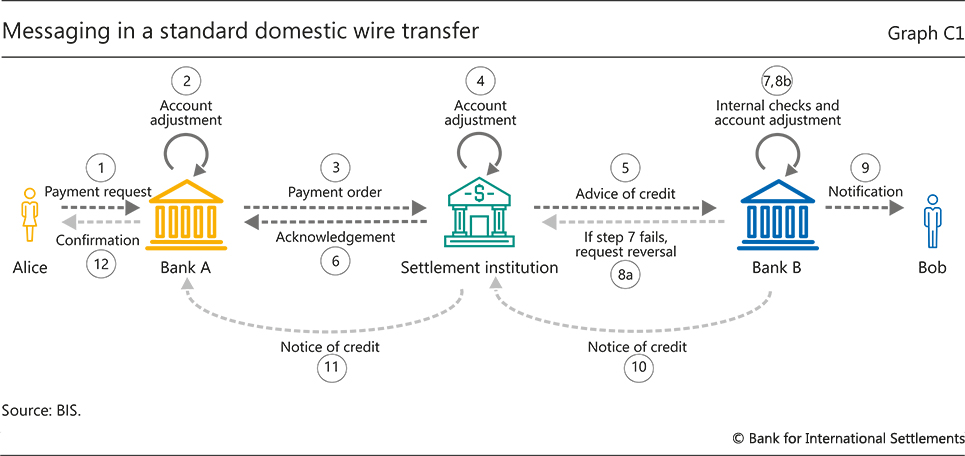
Graph C1
Messaging in a standard person-to-person wire transfer
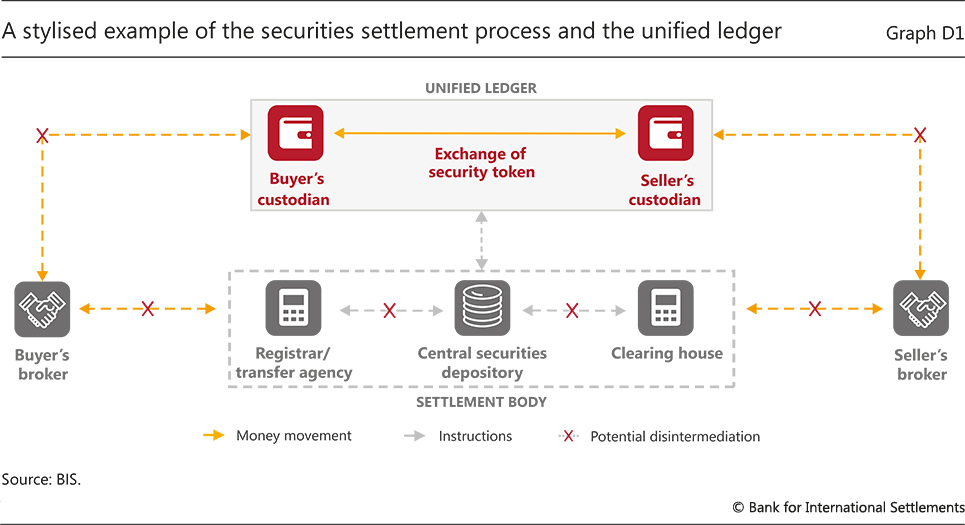
Graph D1
Streamlining securities settlement through a unified ledger
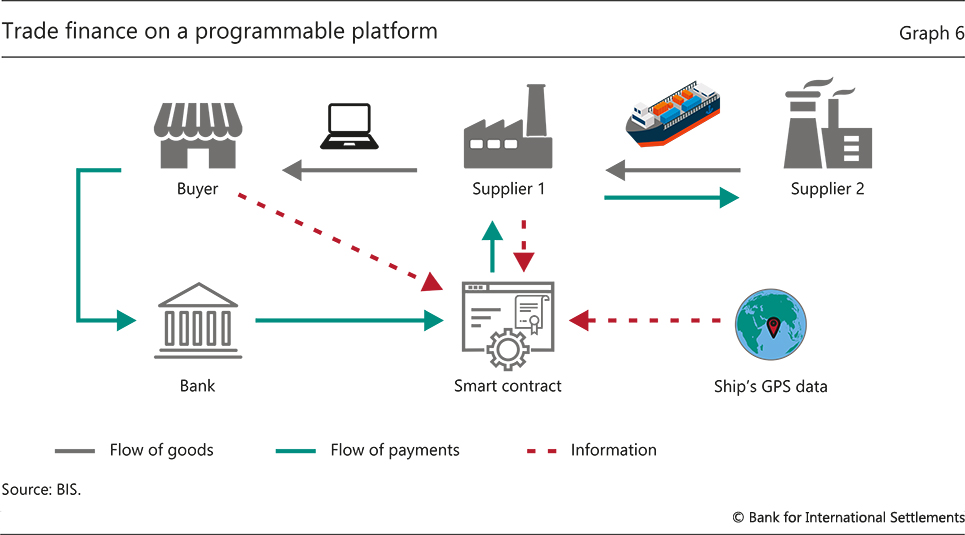
Graph 6
Trade finance on a programmable platform
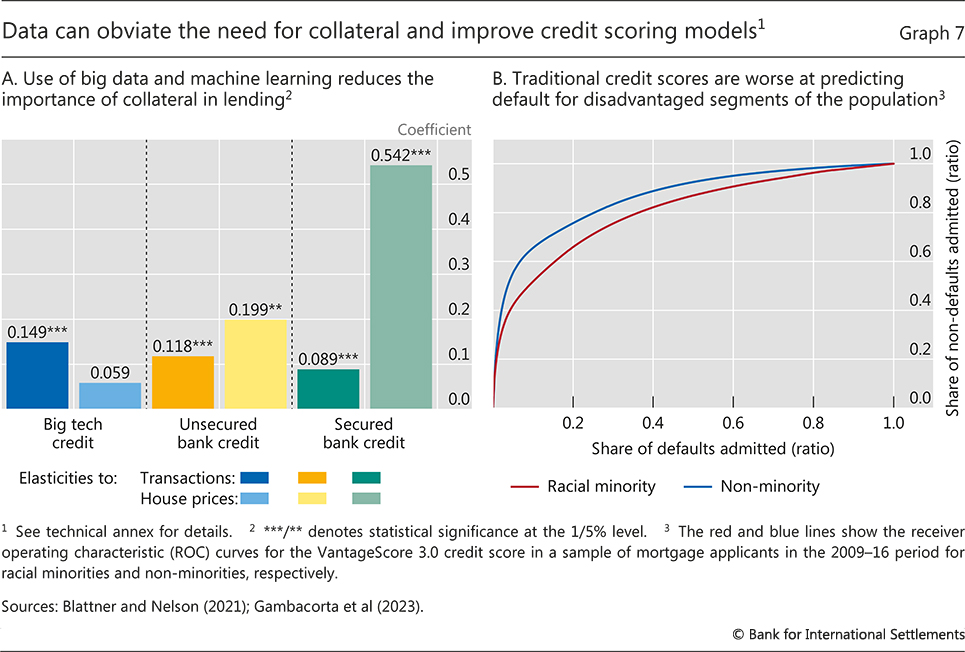
Graph 7
Data can obviate the need for collateral and improve credit scoring models
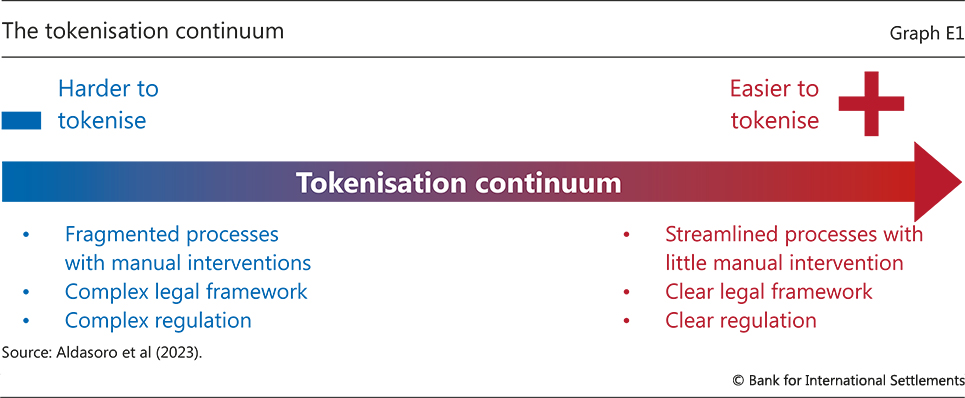
Graph E1
The tokenisation continuum
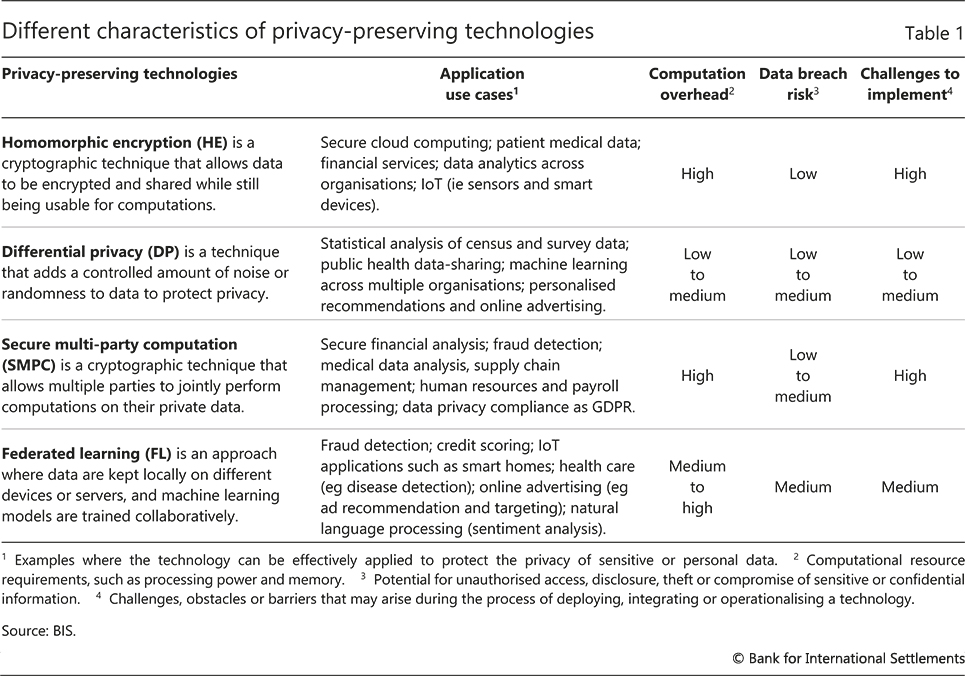
Table 1
Different characteristics of privacy-preserving technologies
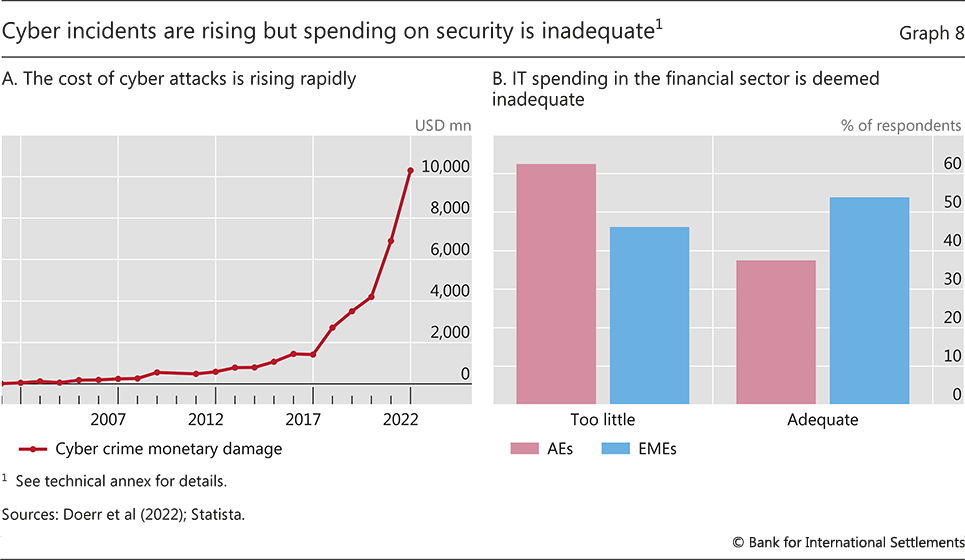
Graph 8
Cyber incidents are rising but spending on security is inadequate
Related information
Annual
Economic Report 2023
Top
Share this page