Prudential policy and financial dominance: exploring the link

Since mid–2021, central banks have rapidly tightened monetary policy against the backdrop of historically high debt levels and a strong increase in inflation. Experience over the past five decades reveals that, under broadly similar circumstances, monetary policy tightening could usher in financial stress. We find that prudential policy tightening, whether before or during monetary tightening, helps to avoid such stress. Tighter prudential policy therefore reduces the risk of financial dominance and provides central banks with more policy headroom to fight inflation. 1
JEL classification: E52, G18.
Since mid–2021, central banks have rapidly tightened monetary policy against the backdrop of multi–decade high debt levels and strong inflationary pressures (Graph 1). This has raised questions about the possible impact on financial stability. So far, the financial system has proved resilient, but existing vulnerabilities could constrain central banks' fight against inflation – so–called financial dominance.
We examine whether prudential policy can increase monetary policy's room for manoeuvre. Based on five decades of data for advanced and emerging market economies, we explore the conditions under which monetary tightening may usher in stress and whether prudential tightening reduces the likelihood of such an outcome. We contribute to the literature by analysing prudential tightening specifically in the context of monetary tightening episodes and by considering various indicators of stress.2
We find that prudential policy tightening helps to prevent financial dominance. Such measures are especially helpful when monetary tightening takes place against the background of strong inflationary pressures, which would induce a more intense tightening, or higher private debt. These are also two key features of today's macro–financial backdrop.
Key takeaways
- Monetary policy tightening is more likely to usher in financial stress down the road when rate hikes occur amid high private debt levels or strong inflationary pressures.
- Prudential policy tightening – whether ahead of or during a monetary tightening – helps to reduce the likelihood of financial stress.
- This provides central banks with more room for manoeuvre in their fight against inflation – it reduces "financial dominance".
The remainder of this special feature proceeds as follows. The first section identifies past monetary tightening episodes. It also analyses the odds of financial stress during such episodes and whether these odds are higher when the macroeconomic environment is comparable with the current one (Graph 1). The second section analyses the impact of prudential measures on the odds of financial stress, with a focus on whether their impact varies if they are taken before or during monetary tightening. The final section draws the policy implications.
Monetary policy tightening and financial stress
To explore the link between monetary policy tightening and financial stress under conditions that may shed light on current challenges, we proceed in two steps. First, we construct a data set of monetary tightening and financial stress episodes. Second, we examine whether a monetary tightening episode is more likely to be followed by financial stress if it takes place in an environment of high private debt or strong inflationary pressures.
The data set: identifying monetary tightening and financial distress
We focus on monetary tightening episodes involving a material and sustained increase in the policy rate. Importantly, to choose episodes that are more relevant at the current juncture, we seek to isolate those meant to quell – possibly incipient – inflationary pressures and exclude those driven by other factors. In particular, we exclude sharp hikes in response to currency depreciations or sudden capital flow reversals, possibly during financial crises. An episode starts in the month of the first policy rate hike, ends when the policy rate peaks, and features increases over at least four consecutive months.3
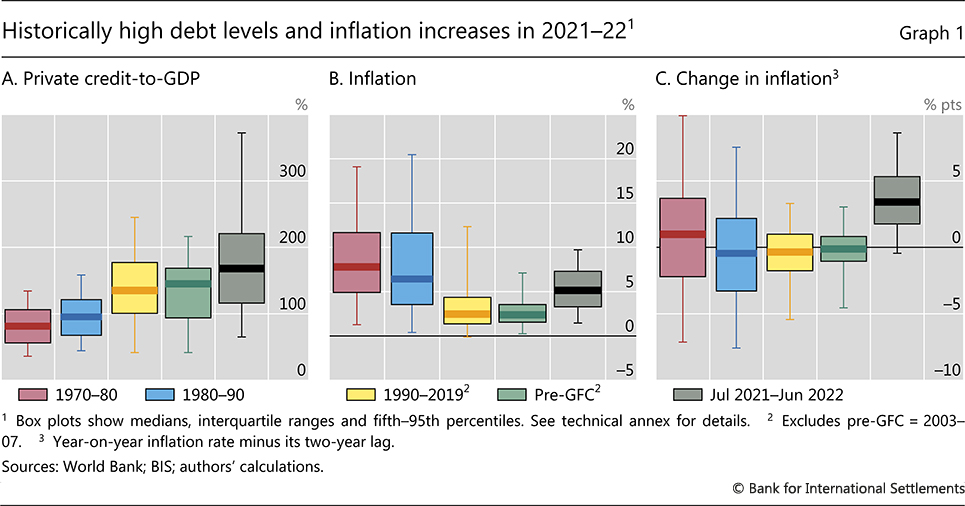
The choice of sample period for the analysis raises a quandary. On the one hand, active deployment of prudential measures started only in the 1990s (see below). It is not possible to reliably measure the implications of such measures before then. On the other hand, inflation dynamics similar to the current ones generally prevailed in the 1970s and early 1980s (Graphs 1.B and 1.C). Therefore, examining the link between monetary policy tightening and financial distress only from the 1990s would throw away useful information.
To address this quandary, we vary the sample depending on the specific focus. When considering the link between monetary policy and financial distress, we begin the analysis in 1970; when we consider the interaction with prudential measures, we start in 1990. Robustness checks indicate that the link between monetary policy and financial stress also survives in the subsample beginning in 1990, despite the smaller range of variation in the inflation rate.4 Regardless of the focus, the sample ends in 2017 to exclude the Covid–19 recession, which is sui generis, and the current monetary tightening episode, which is still under way.
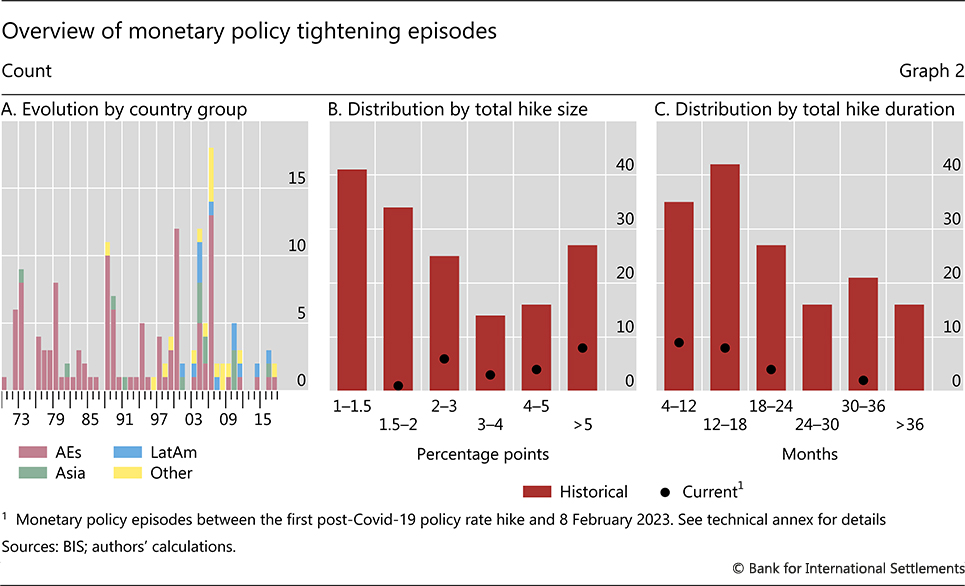
The data set covers 157 monetary tightening episodes for 21 advanced economies (AEs) and 16 emerging market economies. Before 2000, most of the episodes took place in AEs, partly reflecting data availability. The sample is more balanced thereafter (Graph 2.A).
The size and duration of policy rate increases vary across episodes. In about half of them, the policy rate hike exceeds 2 percentage points overall (Graph 2.B) or lasts more than 18 months (Graph 2.C). The rate hikes average some 3 percentage points, below the 5 percentage point average seen in the current monetary tightening phase (Graph 2.B, black dots).5
What about indicators of financial stress? Financial stress is hard to miss but varies in intensity and is difficult to measure precisely. To keep the analysis as sharp as possible, in the main text we rely on a zero/one indicator of banking crises (Laeven and Valencia (2020) and Baron et al (2021)).6 Our key findings survive if we use a continuous indicator of stress based on narrative sources (Romer and Romer (2017), see Annex).
The resulting data set includes 38 episodes associated with crises. No fewer than 33 occurred after 1985 and 20 after 1990. A key reason is that, until the early 1980s, financial systems were largely repressed through a wide array of regulations and controls, both domestic and cross–border. This reduced the scope for the build–up of financial imbalances (eg Borio et al (2018)).
The role of debt and inflation
We now examine how private sector debt and inflation dynamics affect the link between monetary tightening and financial stress. Specifically, we study how the frequency of banking crises after the first interest rate hike depends, in turn, on debt and inflation at the beginning of the monetary policy tightening episode.
A first issue is whether we should focus on the rate of change of credit or its level. There is ample empirical evidence that rapid cumulative credit growth is a harbinger of subsequent stress.7 However, since only around half of the countries in the sample have seen credit booms recently, the question more relevant for the current period is whether a high level of debt also matters. In turn, we measure the level of debt by allocating it to four different categories, each corresponding to a quartile in the distribution of credit–to–GDP over the whole sample in any given country.
The results indicate that the level of debt matters. A high private debt–to–GDP ratio at the time of the first hike increases the likelihood of financial distress one to three years down the road. After three years, the frequency of crises is around 40% when the ratio is in the top quartile of the country–specific distribution, around 20% when it is in the second or third quartile, and zero when it is in the bottom quartile (Graph 3.A). The difference between the bottom and top quartiles is statistically significant.
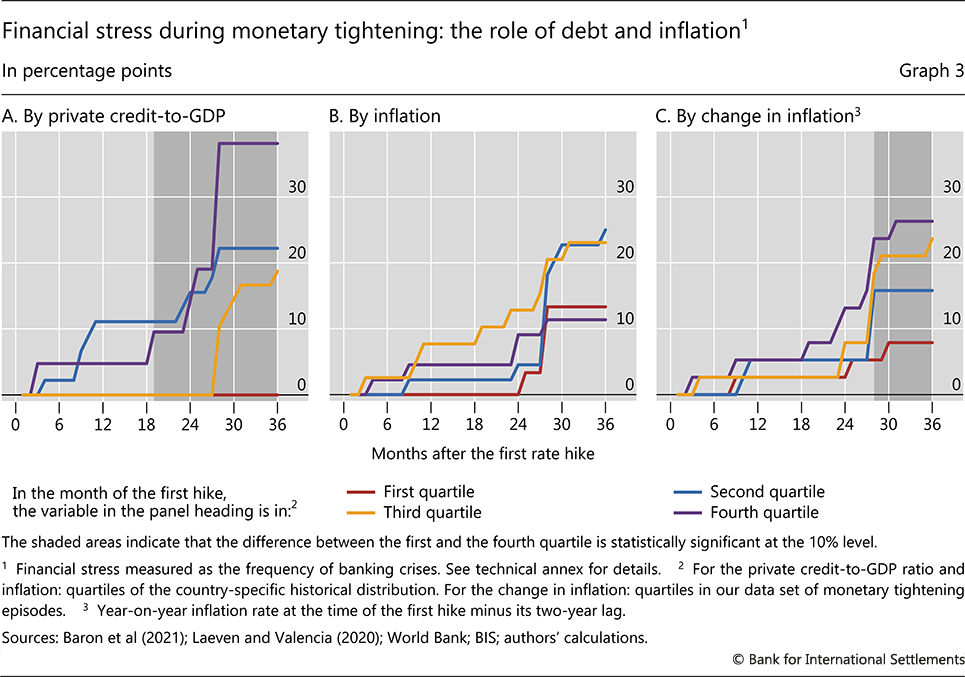
In the case of inflation, and using similar categories, the picture is more nuanced. When we condition on the initial level of inflation, we do not observe a systematic ordering of financial stress frequencies and the differences between frequencies are not statistically significant (Graph 3.B). The picture is different when we condition on the change in the inflation rate (Graph 3.C). The larger the increase in inflation just before the start of the monetary tightening episode, the higher the subsequent incidence of distress.
These findings are intuitive. The initial level of inflation is unlikely to matter by itself: it should have an influence on the likelihood of financial stress only to the extent that it induces a larger and more prolonged monetary tightening. The initial increase in inflation is likely to provide a better indication of the need to tighten strongly when the central bank implements the first hike. And the higher the initial level of debt, the greater the pressure on the financial system as the tightening proceeds.
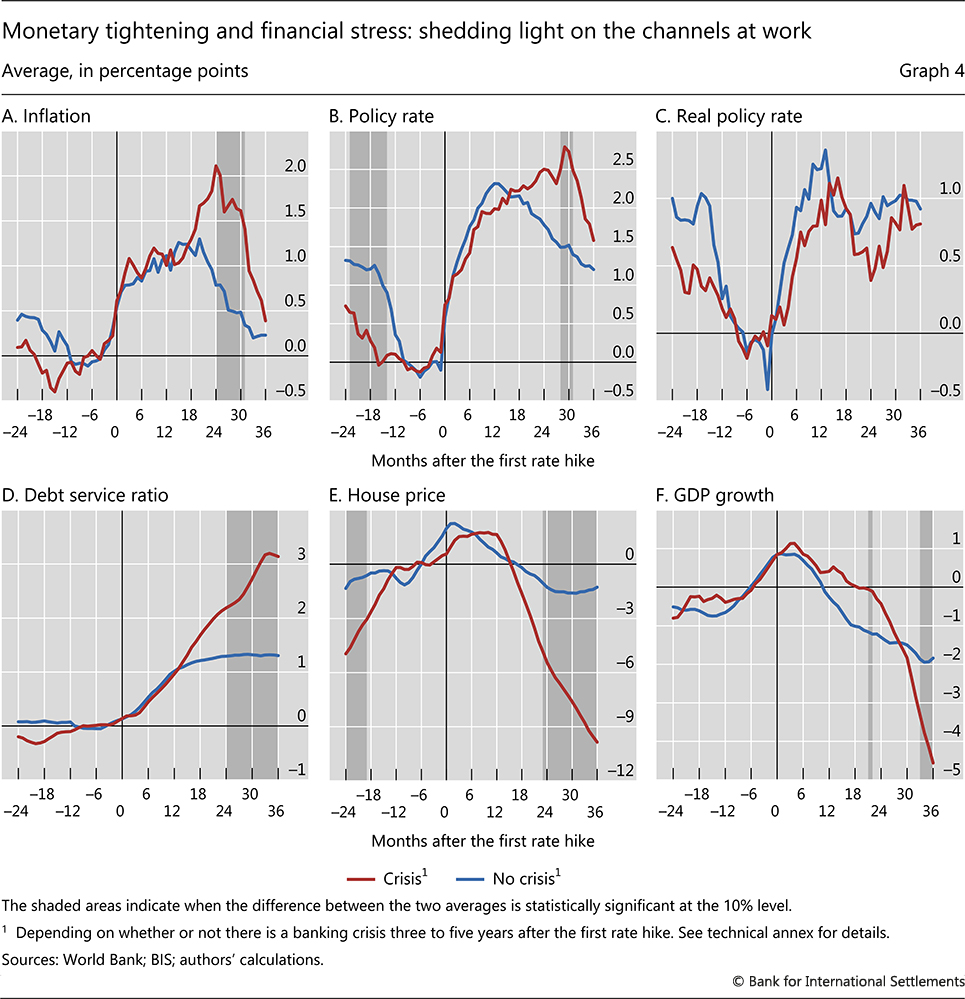
Graph 4 sheds light on some of the mechanisms at work. The stronger and more persistent the rise in inflation, the more forceful and prolonged the policy rate hike (Graphs 4.A and 4.B). As a result, the debt service ratio rises by more (Graph 4.D)8 and general financial conditions tighten more strongly, putting pressure on borrowers and depressing strongly property prices, here captured by house prices (Graph 4.E).9 Taken together, these forces weigh heavily on economic activity (Graph 4.F). And the larger the initial stock of debt, the stronger the tightening of financial conditions, not least since even borrowers with fixed–rate and long–term debt eventually become directly affected. All this heightens the risk of financial distress.
Prudential policy, monetary tightening and financial stress
One way to increase the resilience of the financial system is to have tight prudential policy in tranquil times. The idea is to have buffers in place, by strengthening lenders' capitalisation and liquidity position or by improving borrowers' ability to withstand a deterioration in their cashflows, income or balance sheets (eg through maximum loan–to–value or debt–to–income ratios). To varying degrees, these measures improve the ability of the system to withstand a shock and constrain the build–up of imbalances that can cause the shock in the first place.10
During a monetary tightening episode, the calibration of prudential measures becomes complex. On the one hand, depending on the speed of implementation and transmission of the measures, financial conditions could become too tight precisely when the economy is experiencing a bust. If the effect is strong enough, it could weaken the economy and thus the financial system – a kind of fallacy of composition. On the other hand, more stringent prudential measures increase the financial system's resilience in the face of tighter financial conditions.
Timing is of the essence and the right timing depends on the nature of the prudential instrument. Some regulatory requirements are designed to be tightened during financial booms, when systemic risk increases, and to be lowered during busts, when systemic risk materialises – so–called macroprudential measures (BIS (2008)).11 In turn, institutions can draw on the released buffers to relieve financial strain and sustain lending. Other regulatory requirements, of a more structural nature, contribute to the system's resilience, even though they are not calibrated with explicit reference to system–wide effects – so called "microprudential" measures (Crockett (2000) and Borio (2003)). Regardless of the type of the prudential measure, however, greater resilience mitigates potential financial stability risks, and should provide central banks with more headroom to raise their policy rate and fight inflationary pressures without leading to financial stress.12
The data set of prudential measures
To examine the impact of prudential measures, we draw on the "iMaPP" database in Alam et al (2019). Starting in January 1990 and ending in August 2017, this comprehensive resource includes data on a monthly frequency and is updated annually – it represents the sample for our test. The starting date is a limitation, but not as serious as it may appear at first sight. Prudential regulation was strengthened around the world starting in the 1980s and at least half of the crises around monetary tightening episodes since 1970 took place after 1990. The sample covers 92 monetary tightening episodes.
A more important limitation of the database is that it does not account for the stringency of prudential measures. Regardless of the type of measure, their adjustment is captured by a binary index ("dummy"). The index takes the value of 1 when the authorities introduce or tighten the prudential requirement and -1 when they loosen or eliminate it.13 Thus, while it is possible to get a sense of the impact of different types of measure, all policy interventions are treated alike. For example, increasing capital requirements from 1 to 2% is equivalent to increasing them from 1 to 5%.
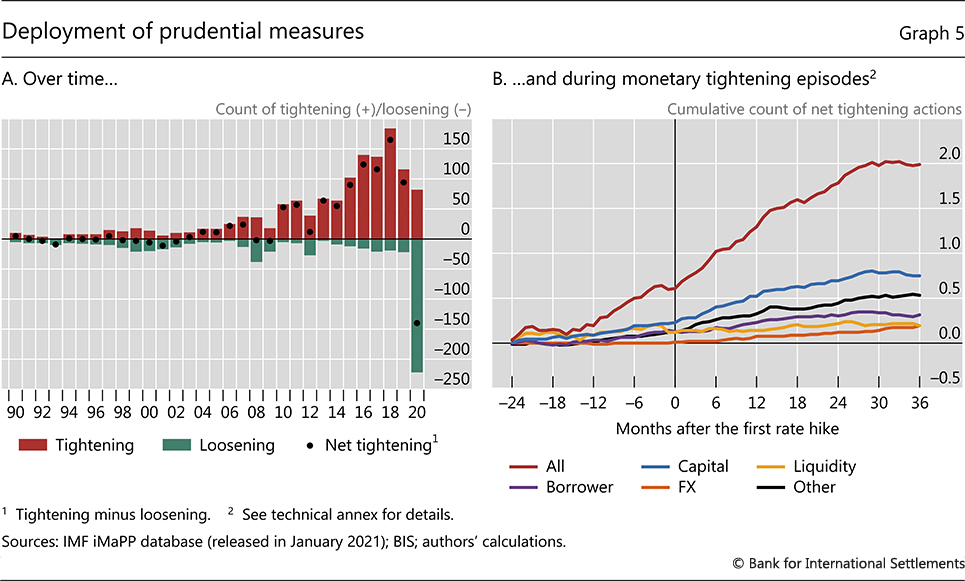
Graph 5 documents the evolution of prudential measures. Their use has tended to increase since the 1990s, especially after the 2007–09 Great Financial Crisis (GFC) (Graph 5.A), reflecting mainly the implementation of macroprudential frameworks. On balance, measures have been tightened, indicative of the growing efforts to strengthen the financial system. Loosening actions tend to cluster around financial stress episodes, such as the Asian crisis of 1997, the GFC in 2008 and, most starkly, the sui generis Covid-19 crisis.14
Turning to the relationship with monetary tightening episodes (Graph 5.B), some clear patterns emerge. On net, prudential measures are tightened both before and after the first interest rate hike, with little difference in the rate of increase. But after two and a half years, the net tightening stops and, if anything, turns into a loosening (red line). Moreover, this pattern encompasses all types of measure, albeit to different degrees. In most cases, authorities set higher capital or liquidity requirements, or stricter borrower–based rules. In a small number of instances, they also took more stringent foreign currency–related measures.
Test design and findings
Armed with the data set, we proceed to the design of the test. For this analysis, we need to decide how to quantify prudential tightening. We also need to choose the length of the window around the beginning of monetary tightening episodes, over which we consider prudential measures.
Further reading:
We focus on an indicator of net tightening, ie the difference between the number of policy actions that tighten the calibration of prudential instruments and the number of actions that loosen it.15
We first consider the overall set of measures and then single out those related to bank capital. We split out only bank capital measures because they are by far the most common type (Graph 5.B) and are the only type that allows for reliable statistical inference when considered in isolation.
As regards the window, we consider two years before the initial hike and two years after. Two years before is a period long enough to capture the impact of a given measure. In turn, hardly any prudential measure was adopted, on net, beyond a two–year window after the start of monetary tightening (Graph 5.B).16
We then carry out two types of test. First, we examine whether the frequency of financial stress depends on whether prudential measures are tightened on net over a given period, regardless of the cumulative change in the number of measures. Second, we explore if the cumulative change makes a difference. In both cases, and to get a sense of the importance of a policy's timing, we also separately consider measures taken before and after the initial hike in the monetary policy rate.
We find that prudential measures help, regardless of when they are taken.
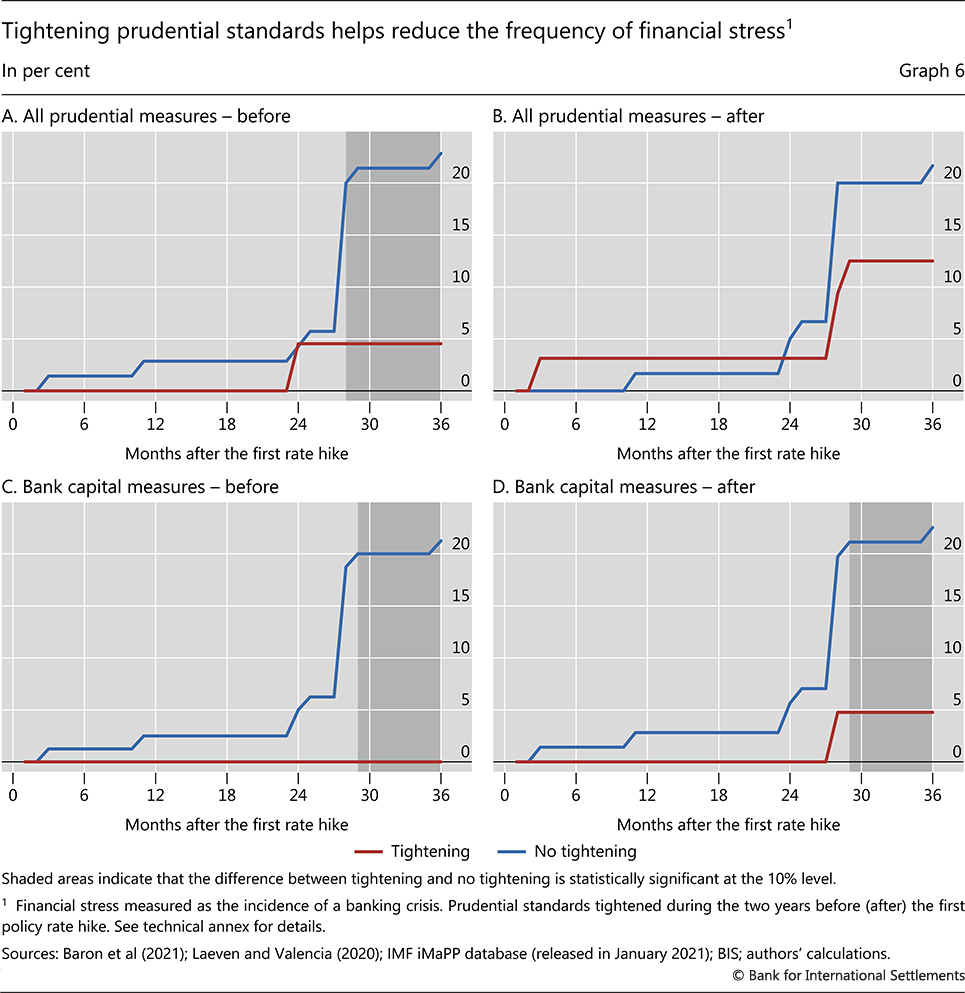
Consider the first type of test. We see that the frequency of crises is lower after prudential measures are made more stringent, on balance (Graph 6). The improvement is especially large, and statistically significant, three years after the initial interest rate hike – of the order of 15 percentage points (Graph 6.A). The beneficial role of capital is very much in evidence (Graphs 6.C and 6.D).
Similar findings hold once we take into account the cumulative change in the number of measures. Here, we need a regression specification:

For each monetary tightening episode i, the regression relates a dummy variable, CRISIS, which is equal to one if a banking crisis breaks out over the three years after the first rate hike, and the total number of incremental net tightening measures either before or after the first rate hike (PPTi), as well as control variables (Zi). The controls are meant to capture the context of the monetary tightening and include dummies related to the level of the credit–to–GDP ratio as well as the change in inflation at the time of the first hike (recall Graph 3). In regression (1), the coefficient of interest is β, which corresponds to the effect of one incremental prudential tightening action on the frequency of a crisis, in percentage points.
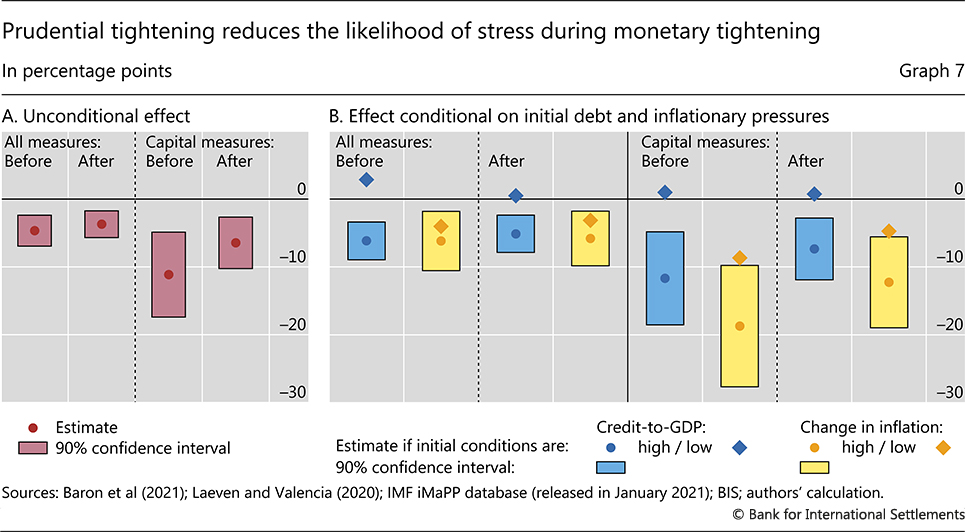
The results reinforce the message. Our estimates of the coefficient β in equation (1) reveal evidence that prudential tightening helps reduce the likelihood of distress, regardless of whether it takes place before or after the initial interest rate hike (Graph 7.A). The effect is stronger in the case of bank capital–related instruments, especially when they are tightened early on.
Last, we study whether the impact of prudential policy on the frequency of financial stress depends on the initial level of debt or change in inflation. Accordingly, we modify equation (1) as follows:

where  is a dummy variable equal to one if the country's private credit–to–GDP ratio or change in inflation at the time of the first rate hike is above its median and to zero otherwise.17 In regression (2), the coefficients of interest are βH, and βL, when the level of credit or change in inflation is initially high or low.
We find that prudential tightening is relatively more effective in reducing the likelihood of financial stress if the monetary tightening takes place in the context of high levels of debt and strong inflationary pressures (Graph 7.B, dots versus diamonds).
Conclusion
Our findings indicate that tightening prudential policy increases monetary policy's room for manoeuvre. There is evidence that monetary policy tightening raises the likelihood of financial stress down the road if the hikes take place when the initial level of private sector debt is high and inflationary pressures call for a strong policy reaction. This pattern has been present even since the 1990s, when the variation in inflation has been much smaller than in the past. We also provide evidence that prudential measures implemented around monetary tightening episodes, whether before or after the initial interest rate hike, help to reduce the likelihood of financial stress. In sum, prudential policy can allow monetary policy to focus more freely on its fight against inflation, by mitigating the risk of financial dominance.
These findings shed some light on current challenges. All else equal, today's historically high levels of private debt and the surge in inflation would raise the odds that the current monetary tightening might usher in financial stress down the road. But the findings also indicate that a tightening of prudential measures should help to reduce that risk. A number of countries have been tightening prudential policy to tackle financial expansions seen during the post–pandemic recovery. And this comes on top of the post–GFC cumulative strengthening of prudential standards that has substantially increased banks' capital defences.
The findings also shed light on the highly complementary role that monetary and prudential policies can play in a more holistic macro–financial stability framework (Borio et al (2022)). Such a framework is designed to better reconcile price, financial and hence macroeconomic stability, through a more holistic deployment of monetary, prudential and fiscal policies. Developing that framework is still a work in progress.
References
Alam, Z, A Alter, J Eiseman, G Gelos, H Kang, M Narita, E Nier and N Wang (2019): "Digging deeper – Evidence on the effects of macroprudential policies from a new database", IMF Working Papers, no WP/19/66, March.
Araujo, J, M Patnam, A Popescu, F Valencia and W Yao (2020): "Effects of macroprudential policy: evidence from 6,000 estimates", IMF Working Papers, no WP/20/67, May.
Bank for International Settlements (2008): 78th Annual Report, June.
Baron, M, E Verner and W Xiong (2021): "Banking crisis without panics", Quarterly Journal of Economics, vol 136, no 1, pp 51–113.
Boissay, F, F De Fiore and E Kharroubi (2022): "Hard or soft landing?", BIS Bulletin, no 59.
Borio, C (2003): "Towards a macroprudential framework for financial supervision and regulation?", BIS Working Papers, no 128, February.
Borio, C and M Drehmann (2009): "Assessing the risk of banking crises – revisited", BIS Quarterly Review, March, pp 29–46.
Borio, C, M Drehmann and D Xia (2018): "The financial cycle and recession risk", BIS Quarterly Review, December, pp 59–71.
Borio, C and P Lowe (2002): "Assessing the risk of banking crises", BIS Quarterly Review, December, pp 43–54.
Borio, C and F Restoy (2020): "Reflections on regulatory responses to the Covid–19 pandemic", FSI Briefs, no 1, April.
Borio, C, I Shim and H S Shin (2022): "Macro–financial stability frameworks: experience and lessons", BIS Working Papers, no 1057, December.
Bruno, V, I Shim and H S Shin (2017): "Comparative assessment of macroprudential policies", Journal of Financial Stability, vol 28, February, pp 183–202.
Cavallino, P, G Cornelli, P Hoerdhal and E Zakrajsek (2022): "Front–loading monetary tightening: pros and cons", BIS Bulletin, no 63.
Cerutti, E, S Claessens and L Laeven (2017): "The use and effectiveness of macro–prudential policies: new evidence", Journal of Financial Stability, vol 28, pp 203–24.
Crockett, A (2000): "Marrying the micro– and macroprudential dimensions of financial stability", BIS Speeches, 21 September.
Fernandez–Gallardo, A (2023): "Preventing financial disasters: macroprudential policy and financial crises", European Economic Review, vol 151, January.
Gambacorta, L and A Murcia (2020): "The impact of macroprudential policies in Latin America: An empirical analysis using credit registry data", Journal of Financial Intermediation, vol 42.
Hofmann, B and G Peersman (2017): "Is there a debt service channel of monetary transmission?", BIS Quarterly Review, December, pp 23–37.
Juselius, M and M Drehmann (2020): "Leverage dynamics and the burden of debt," Oxford Bulletin of Economics and Statistics, vol 82, pp 347–64.
Juselius, M and N Tarashev (2020): "Forecasting expected and unexpected losses", BIS Working Papers, no 913.
Kim, S, and A Mehrotra (2019): "Examining macroprudential policy and its macroeconomic effects – some new evidence", BIS Working Papers, no 825.
Kuttner, K and I Shim (2016): "Can non–interest rate policies stabilise housing markets? Evidence from a panel of 57 economies", Journal of Financial Stability, vol 26, October, pp 31–44.
Laeven, L and F Valencia (2020): "Systemic banking crises database II", IMF Economic Review, vol 68, pp 307–61.
Mendoza, E and M Terrones (2008): "An anatomy of credit booms: evidence from macro aggregates and micro data", NBER Working Papers, no 14049.
Nakatani, R (2020): "Macroprudential policy and the probability of a banking crisis", Journal of Policy Modelling, vol 42, no 6, November–December, pp 1169–86.
Romer, C and D Romer (2017): "New evidence on the aftermath of financial crises in advanced countries", American Economic Review, vol 107, no 10, pp 3072–118.
Schularick, M and A Taylor (2012): "Credit booms gone bust: monetary policy, leverage cycles, and financial crises, 1870–2008", American Economic Review, vol 102, pp 1029–61.
Schularick, M, L Ter Steege and F Ward (2021): "Leaning against the wind and crisis risk", American Economic Review: Insights, vol 3, pp 199–214.
Annex
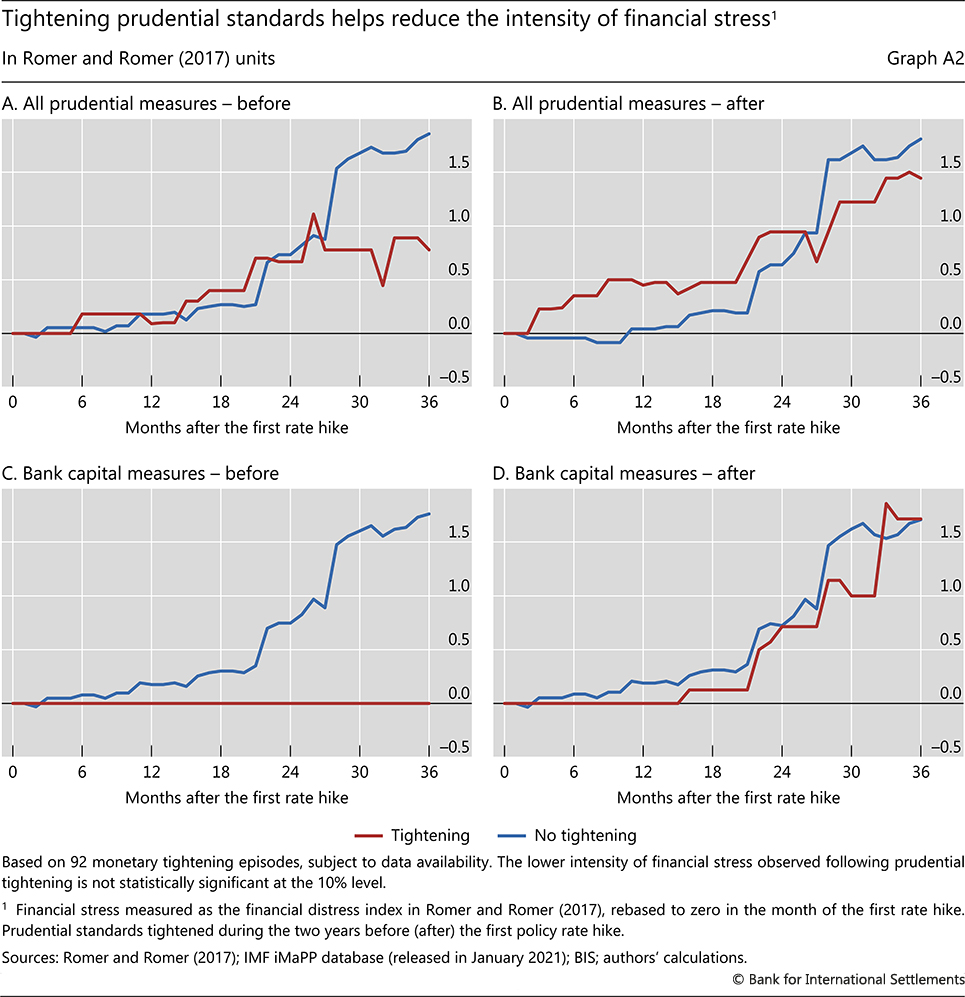
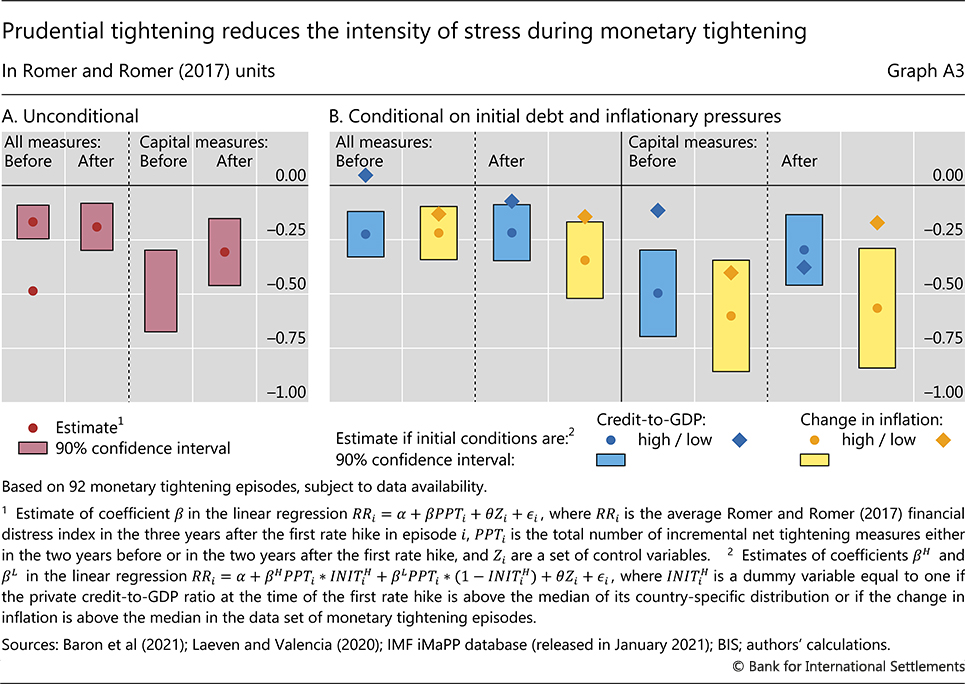
Analysis using Romer and Romer (2017) financial distress index
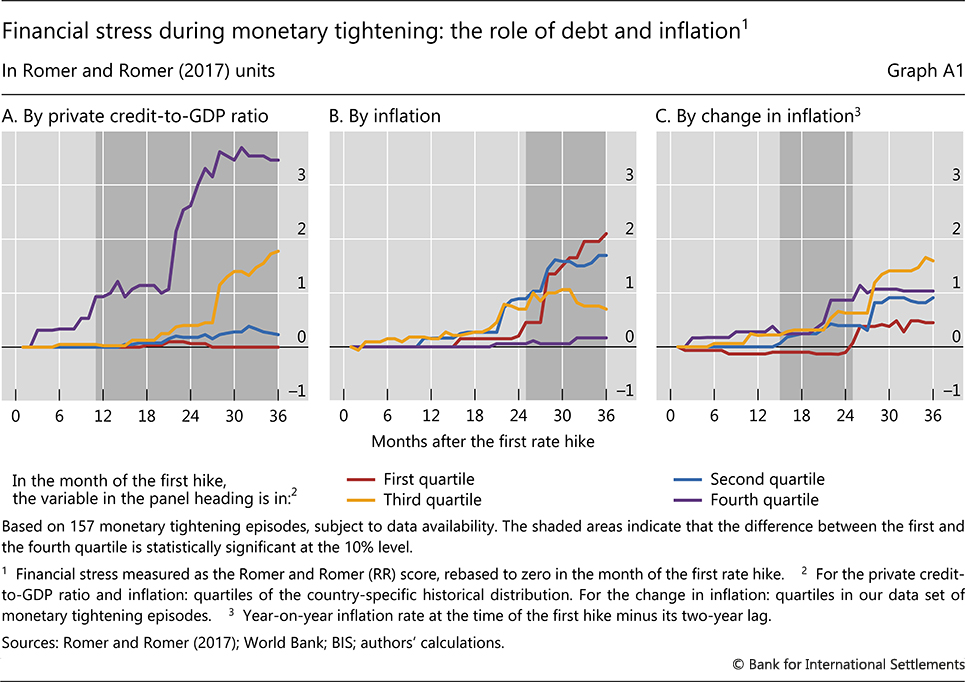
This annex reports the results based on the index of Romer and Romer (2017), which measures the intensity – as opposed to the incidence – of financial stress. The three graphs below provide the same qualitative messages as those derived in the discussion of Graphs 3, 6 and 7, respectively.
Technical annex
Graph 1: Based on 21 advanced economies (AT, AU, BE, CA, CH, DE, DK, ES, FI, FR, GB, GR, IS, IT, JP, LU, NL, NO, NZ, PT and US) and 16 emerging market economies (CL, CO, CZ, HK, HU, IL, IN, KR, LV, MX, PE, PL, RO, SK, TH and TW).
Graph 2: Based on 157 monetary tightening episodes between March 1970 and August 2017 in 37 countries (see entry for Graph 1, excluding TW).
Graph 3: Based on 157 monetary tightening episodes (see entry for Graph 1), subject to data availability.
Graph 4: See entry for Graph 3. The series are rebased so as to have a zero mean in the 12 months that precede the first rate hike.
Graph 5.B: Based on 92 monetary tightening episodes. Capital: prudential measures taken to strengthen banks' capital position, such as minimum capital ratios, adjustments in risk weights and limits on bank leverage. Liquidity: prudential measures taken to mitigate banks' liquidity and funding risks, such as minimum reserve requirements, liquid asset ratios and core funding ratios. Borrower: prudential measures taken to strengthen borrowers' balance sheet, such as ceilings on the debt service–to–income ratio and the loan–to–value ratio. FX: foreign currency related prudential measures such as capital requirements on FX–denominated loans, limits on FX lending, FX exposures and FX funding, and regulation on currency mismatches. Other: other measures such as limits on loan growth.
Graph 6: Based on 92 monetary tightening episodes.
1 The authors thank Stijn Claessens,Mathias Drehmann, Leonardo Gambacorta, Aaron Mehrotra, Benoît Mojon, Phurichai Rungcharoenkitkul, Hyun Song Shin and Nikola Tarashev for helpful comments and discussions. The views expressed in this article are those of the authors and do not necessarily reflect those of the Bank for International Settlements.
2 Previous studies of the interaction of monetary and macroprudential policies focus mostly on its effects on credit, house prices or growth but not on financial stress (eg Bruno et al (2017), Cerutti et al (2017), Gambacorta and Murcia (2020), Kim and Mehrotra (2019), Kuttner and Shim (2016) or Araujo et al (2020) for a survey). A few recent studies separately analyse the effects of macroprudential or monetary policy on financial stress (eg Fernandez–Gallardo (2023), Nakatani (2020), Schularick et al (2021)). To our knowledge, we are the first to study the effects of the interaction between the two policies on financial stress.
3 We exclude "tail" events, ie episodes with the policy rate increasing by less than one or more than 30 percentage points in total, or by more than 5 percentage points within one month. In a handful of cases, we adjusted the specific start– and end–month manually, eg when the episode features a transitory, small and short–lived decline in the policy rate (Boissay et al (2022), Cavallino et al (2022)).
4 The results are available on request.
5 Fewer than 10% of the episodes last more than three years and there is, on average across countries, one episode every 5.5 years.
6 These two lists of banking crises are complementary. Laeven and Valencia (2020) identify a banking crisis based on narratives pointing to large banking system losses, bank runs or recapitalisations. In contrast, Barron et al (2021) associate banking crises with "bank equity crashes" (bank equity prices dropping by more than 30% in a year) or banking panics (eg severe withdrawals of bank funding). They rely on bank equity returns and narrative sources. While the two indicators generally identify the same crises, the starting dates may differ. In those cases, we pick the earlier of the two.
7 See eg Borio and Lowe (2002), Borio and Drehmann (2009), Mendoza and Terrones (2008) and Schularick and Taylor (2012).
8 There is evidence indicating that debt service ratios play a key role in influencing economic activity (Juselius and Drehmann (2020) and Hofmann and Peersman (2017) and are a key predictor of bank credit losses (Juselius and Tarashev (2020)).
9 The historical record indicates that commercial property prices have been a much more frequent source of banking stress than house prices. The Great Financial Crisis is more the exception than the rule. That said, house price corrections have a bigger indirect impact on banks' soundness, through their adverse effects on aggregate consumption, and the economy at large, as they reduce wealth and tighten funding constraints.
10 In general, the evidence indicates that borrower–based measures are more effective in reducing the build–up of financial imbalances, in the form of strong credit growth or asset price increases; see Borio et al (2022).
11 Strictly speaking, macroprudential measures need not vary with the state of the economy. For example, low levels of loan–to–value or debt–to–income ratios have built–in stabilising properties. This is because they reduce the elasticity of credit expansion with respect to changes in asset prices or incomes, thereby reducing the system's procyclicality.
12 There are two reasons why we combine micro– and macroprudential measures. First, it is sometimes hard to draw a clear line between them. Second, combining them increases the number of observations to work with, thus letting us make more reliable statistical inferences.
13 This limitation is shared with all large prudential policy databases. One advantage of ours is that it covers a longer period, going back to the early 1990s.
14 For a more detailed discussion of this episode, see Borio and Restoy (2020).
15 We focus on the net number because there are relatively few loosening actions and most of them take place around a crisis.
16 Moreover, at that point, the sign of the impact could switch: a loosening would support stability.
17 Consistent with Graph 3, the median refers to the country's historical distribution in the case of the credit–to–GDP ratio, and to the 92 monetary tightening episodes in the case of the change in inflation.