Commodity prices, the dollar and stagflation risk

Fluctuations in commodity prices and the US dollar exchange rate significantly affect the risk of stagflation. Using quarterly data from 22 non-commodity export-dependent economies for the past 30 years, we find that higher commodity prices and dollar appreciation each raise the odds of weak growth and high inflation. Stagflation risk increases by more when the two drivers rise in tandem – as seen over the past couple of years, in a departure from the historical pattern. Emerging market economies (EMEs) are more affected by changes in commodity prices and in the US dollar exchange rate than are their advanced economy counterparts. This reflects in particular the higher commodity consumption of EMEs and their greater exposure to swings in global financial conditions.1
JEL classification: E31, E32, F31, F36, F41, F44.
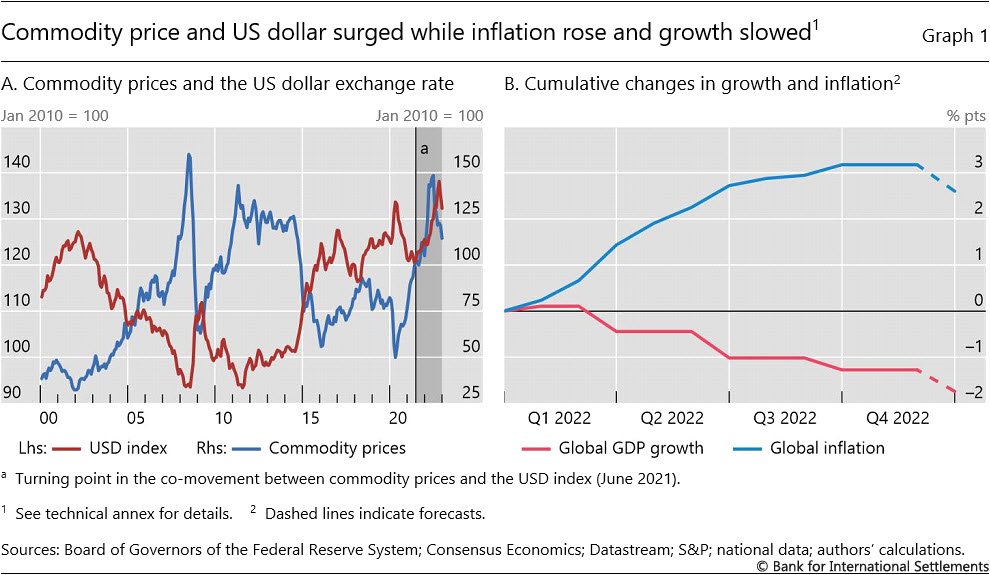
Displaying an unusual co-movement during much of 2021 and 2022, commodity prices rose alongside increasing dollar strength (Graph 1.A).2 Commodity price rises tend to stoke inflation and choke off growth in commodity-importing economies (Igan et al (2022)), while dollar appreciation tends to have similar effects outside the United States, especially in EMEs (Banerjee et al (2020), Hofmann and Park (2020)). Thus, the confluence of such developments over the past couple of years has significantly increased the risk of stagflation, ie that weak growth will coincide with high inflation. Consistent with this, inflation surged worldwide while growth fell in the course of last year (Graph 1.B).
This special feature analyses the impact of commodity price and dollar exchange rate changes on growth and inflation in economies that are not dependent on commodity exports.3 We adopt an "at risk" perspective, focusing on the impact of commodity prices and dollar exchange rate on weak growth ("growth-at-risk", GaR) and high inflation ("inflation-at-risk", IaR). There is a growing literature on GaR (eg Adrian et al (2019), Aikman et al (2019), Hasenzagl et al (2020)) and IaR (eg Lopez-Salido and Loria (2019), Banerjee et al (2020)). This paper brings together the two strands of literature to analyse stagflation risk. Moreover, while previous papers have documented the separate effects of commodity prices and dollar exchange rate on GaR and IaR, we consider the effects together, thus highlighting the importance of recent macroeconomic developments.
Key takeaways
- Higher commodity prices and dollar appreciation each increase the risk of weak growth alongside high inflation in non-commodity export-dependent economies, ie stagflation risk.
- The combination of surging commodity prices and a strengthening dollar over much of the past two years, a departure from the historical pattern, raised global stagflation risk.
- The evolution of commodity prices or the dollar's exchange rate affect emerging market economies more than advanced economies.
We find that an increase in commodity prices and an appreciation of the dollar each significantly worsen GaR and raise IaR in economies that are not dependent on commodity exports. The combination of commodity price increases and dollar appreciation during 2021/22 therefore exacerbated stagflation risks, in contrast to the preceding period when their effects tended to counteract each other. We also find that commodity prices and the dollar have significantly stronger effects on EMEs than on advanced economies (AEs). This reflects EMEs' shallower financial markets and the greater weight of commodities in their consumption baskets.
The first section of this special feature reviews the channels through which movements of commodity prices and the dollar affect GDP growth and inflation and derives testable hypotheses. The second estimates the impact of commodity price and dollar changes on GaR and IaR, and explores the empirical relevance of different channels for transmitting commodity price and dollar exchange rate changes to the macroeconomy. The last section concludes.
Economic impact of commodity prices and the dollar
Channels
Commodity prices and the dollar exchange rate, all else equal, can exert stagflationary effects through two key channels: (i) cost of living and production costs; and (ii) financial conditions. Since different channels dominate in commodity export-dependent economies and the United States, we exclude these economies from the analysis.4
Cost of living and production costs
Higher commodity prices can have, all else equal, stagflationary effects through their impact on the cost of living and on production costs (eg Bruno and Sachs (1985), Hamilton (1983, 1996)). They worsen the terms of trade and hence erode real income. More specifically, they push up the cost of living by raising energy and food prices, which in turn lowers disposable income and dampens consumption demand. At the same time, they push up the cost of firms' production through energy and raw material input prices, which may reduce investment demand. Moreover, higher inflation driven by higher commodity prices could prompt a monetary policy response that dampens the real economy (eg Bernanke et al (1997)).
A stronger dollar, all else equal, tends to reinforce the effects of higher commodity prices. Since commodities are commonly invoiced in US dollars, dollar appreciation increases commodity prices in local currency. This directly compounds the stagflationary effects of higher global commodity prices.
The widespread use of the dollar in trade invoicing beyond commodities has a similar effect. For one, import prices outside the United States rise in line with a strengthening dollar, pushing up inflation rates. Arguably, a stronger dollar might also improve the competitiveness of other countries, boosting their net exports and ultimately output. This conventional trade channel, however, rests on the assumption that export and import prices adjust in response to a change in the country's exchange rate. Over short horizons, this may not be the case precisely because of US dollar invoicing (Gopinath et al (2020)). If the invoice price is sticky in US dollar terms, swings in a country's exchange rate against the US dollar would affect imports while doing little to improve its export competitiveness in the short term. Thus, a broad-based dollar appreciation may, in the short run, primarily push up prices for importers and hence dampen overall trade. By driving up inflation and suppressing trade, dollar appreciation may thus exert broader stagflationary effects.
Financial conditions
Another key channel through which commodity prices and dollar exchange rate affect economic activity runs through financial conditions. For one, commodity price increases erode the debt repayment capacity of commodity importers and hence their creditworthiness, leading to a tightening of financial conditions.5 This adds to the above stagflationary effects of rising commodity prices, as tighter financial conditions dampen real economic activity.
The dollar exchange rate affects global financial conditions more broadly. First, it acts as a barometer of global investor risk appetite, over and above other gauges such as the VIX (Shin (2016)). When investors' risk appetite sags, their flight to safety may both push up the dollar and weaken global economic activity through tighter financial conditions as investors and lenders retrench from risky investments and borrowers.
Second, a stronger dollar directly tightens global credit supply, dampening global real activity. When there are valuation mismatches on borrowers' balance sheets due to unhedged dollar borrowing, a stronger dollar weakens the balance sheets of those dollar borrowers whose liabilities rise relative to assets, the classic "original sin" effect. This furthermore increases tail risk in the overall credit portfolio of global lenders, reducing global dollar credit supply from lenders who face a value-at-risk constraint (Bruno and Shin (2015)). Similar dynamics may play out in local currency government bond markets if tighter dollar credit conditions also tighten risk constraints for global investors holding local currency bonds, giving rise to "original sin redux" (Hofmann et al (2022)).
Testable hypotheses
We use the above channels to formulate the following testable hypotheses for economies that are not dependent on commodity exports.
First, higher commodity prices and dollar appreciation are each expected to have stagflationary effects. If this hypothesis is confirmed, commodity prices and the dollar's value would counteract each other when they evolve in opposite directions. By contrast, a move in the same direction would exacerbate stagflation risks.
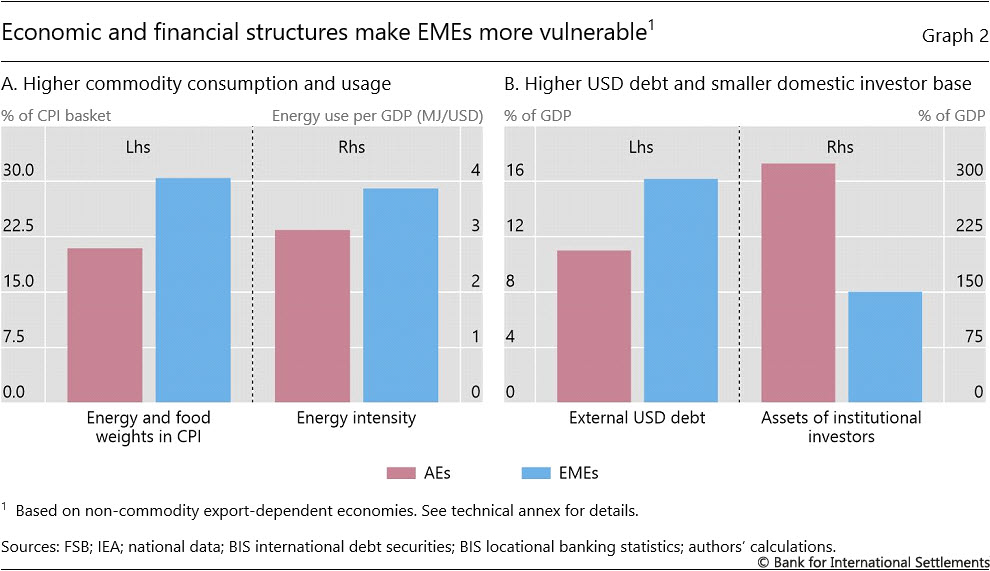
Second, the strength of the channels would depend on countries' economic and financial structure. Relative to AEs, EMEs feature a greater weight of food and energy in consumption baskets and more energy-intensive production structures (Graph 2.A).6 EMEs also have higher dollar debt and generally shallower financial systems, as reflected in their smaller domestic investor bases (Graph 2.B). This implies that higher commodity prices and a stronger dollar should have a more powerful stagflationary effect on EMEs than on AEs. By the same token, within the group of EMEs that we focus on, the strength of the channels should be greater eg for a higher share of food and energy in consumption baskets or for higher external dollar debt.
Since these hypotheses assume implicitly that supply side forces are primarily at work here, we test them by filtering out any confounding demand side factors. Specifically, we control for US economic conditions, which could drive the dollar and also GaR and IaR in other countries. US economic conditions also proxy for global demand, which would drive commodity prices and could directly affect country-level GaR and IaR at the same time.
Empirical analysis
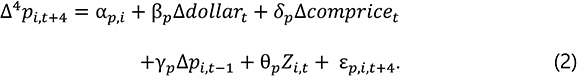
For the analysis, we use quarterly data for 22 non-commodity export-dependent economies, including 15 EMEs and seven AEs, which overall account for 60% of global GDP, over the period Q1 1990–Q4 2019.7 We estimate the effect of commodity price and dollar exchange rate changes on GaR and IaR, defined respectively as the lowest 10% of growth outcomes and the highest 10% of inflation outcomes, using fixed effects panel quantile regressions:8
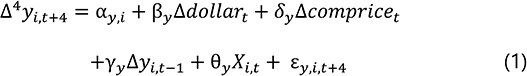
In these equations  stands for the four-quarter real GDP growth four quarters ahead and
  for four-quarter consumer price inflation four quarters ahead.
  is the quarterly log change in the Federal Reserve's broad dollar index and
 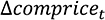 the quarterly log change in the S&P GSCI global commodity price index. The regressions further include country fixed effects and lagged quarterly real GDP growth and inflation, respectively, as well as a set of variables Xi,t (for GaR) and Zi,t (for IaR) that control for domestic and US demand side factors that could affect domestic growth and inflation and therefore confound the supply side forces in focus. Specifically, in both equations, we include US quarterly real GDP growth and the US purchasing managers' index (PMI) as current and forward-looking indicators of US economic conditions.9 The domestic controls included in comprise stock market volatility as a measure of financial conditions, three-year non-financial private credit growth (relative to GDP), the current account balance (relative to GDP), the quarterly inflation rate, the change in the policy rate and a quarterly dummy to capture remaining seasonality.10 Those in comprise domestic real GDP growth and also a quarterly dummy variable.11
The estimated impact on stagflation risk
We find that higher commodity prices and an appreciation of the dollar each significantly raise stagflation risk on average across the 22 economies covered by the analysis (Graph 3). Concretely, a one standard deviation (9.8 ppt) increase in the rate of change in commodity prices lowers four-quarter-ahead GaR and increases four-quarter-ahead IaR, by –0.95 and 0.25 percentage points, respectively (panel A). A one standard deviation increase in the rate of change in the dollar exchange rate (2.5 ppt) lowers four-quarter-ahead GaR and raises four-quarter-ahead IaR by –0.46 and 0.23 percentage points, respectively (panel B).12 These economically significant increases in the risk of simultaneously weak growth and high inflation are also statistically significant.
The overall stagflationary implications of commodity price and dollar gyrations depend on the direction of their co-movement. As shown in Graph 1.A, commodity prices and the value of the dollar used to move inversely until 2021, after which they moved together. Thus, while the effects of commodity price and dollar gyrations on stagflation risks used to offset each other, they compounded each other in 2021/22.
Further reading:
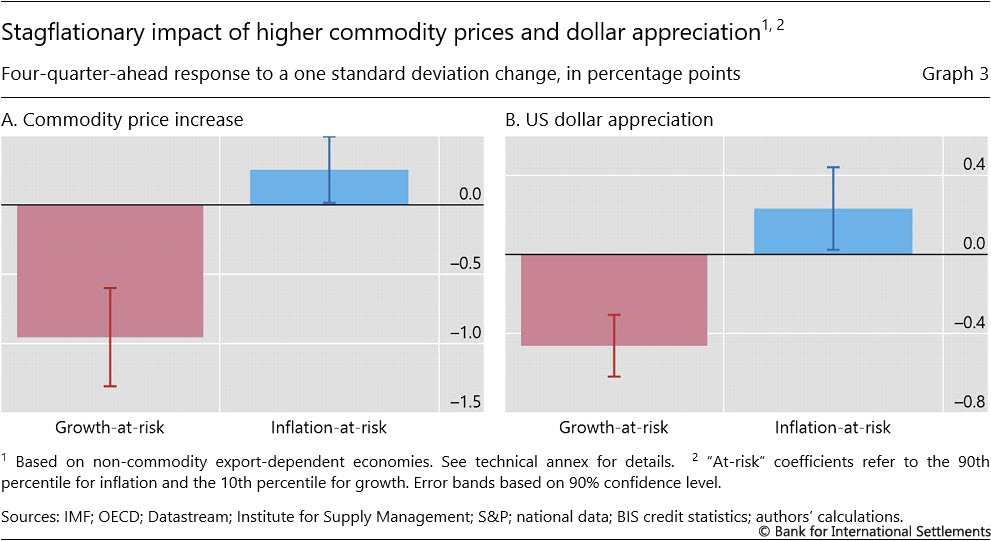
The combined effect of gyrations in commodity prices and the dollar exchange rate on GaR and IaR can be quantified by using our estimates of equations (1) and (2).13 We show this in Graph 4 over three characteristic episodes: the commodity price boom from 2002 to 2008, which was accompanied by dollar depreciation; the commodity price bust from 2011 to 2020, which came with dollar appreciation; and the joint surge in commodity prices and the dollar in 2021/22. In the first two episodes, the contributions of changes in commodity prices and dollar exchange rate largely offset each other for the average country. By contrast, in the third episode, the two factors worked in the same direction, considerably worsening both GaR and IaR. Overall, these results suggest that the particular co-movement of commodity prices and the dollar during any period is of material importance for stagflation risk.
Testing the channels
We now assess the empirical relevance of the channels discussed earlier. First we test the hypothesis that the GaR and IaR of EMEs are more affected by the commodity price and dollar exchange rate changes than are those of AEs. To do so, we re-estimate equations (1) and (2) separately for the EME and AE subsamples.
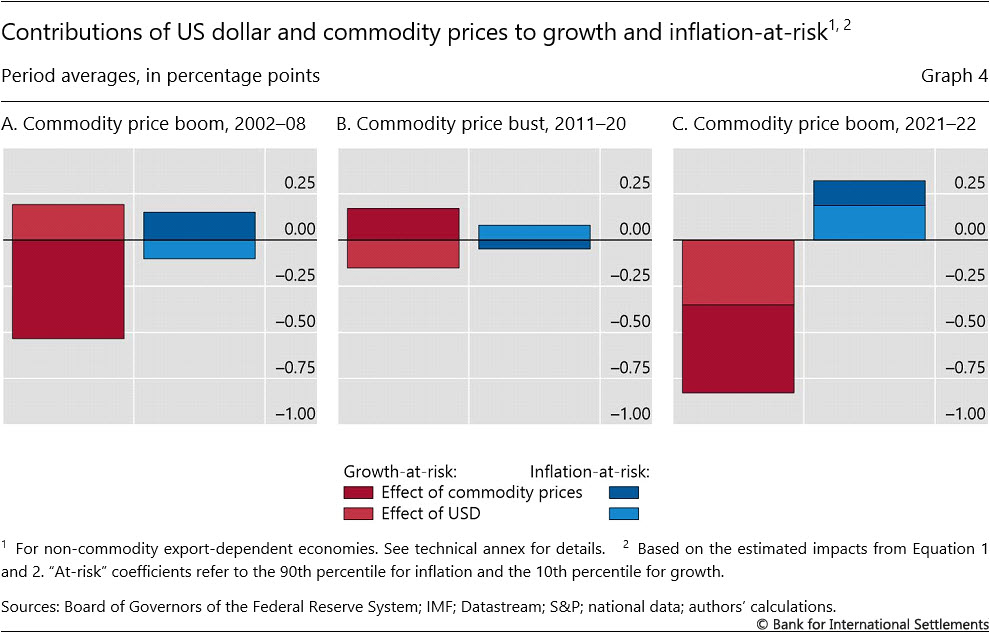
The results suggest that both higher commodity prices and dollar appreciation do have stronger stagflationary effects in EMEs than in AEs (Graph 5). In EMEs, GaR and IaR change by a respective –0.94 and 0.32 percentage points in response to a one standard deviation increase in the rate of change in commodity prices, compared with –0.53 and 0.22 percentage points respectively in AEs. A similar picture emerges for the impact of a one standard deviation increase in the rate of change of the dollar exchange rate. In EMEs, GaR and IaR respectively change by –0.61 and 0.43 percentage points. In AEs, both GaR and IaR fall, by a respective 0.18 and 0.12 percentage points. The latter result probably reflects that, in AEs, dollar invoicing is less widespread and exchange rate pass-through is weaker (see BIS (2019)), mitigating the direct impact of the dollar exchange rate on inflation.
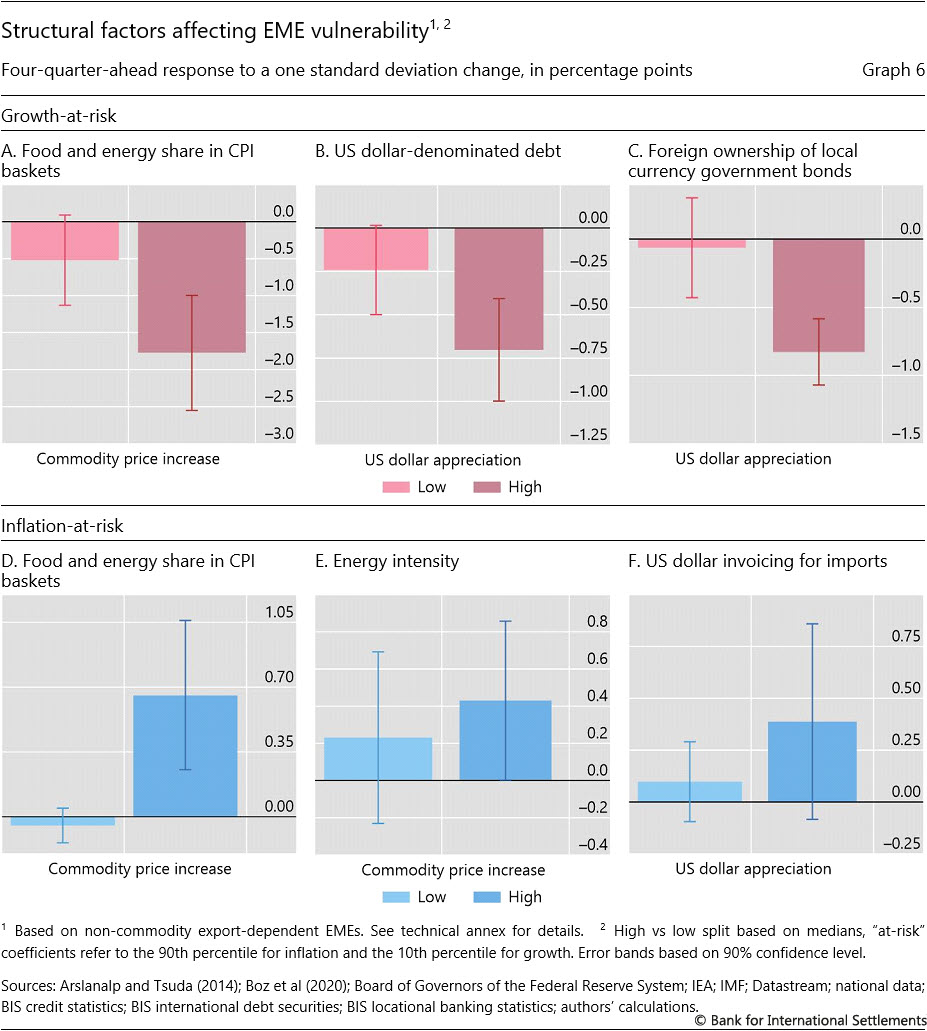
To deepen our understanding of the structural factors behind the differences between AEs and EMEs in the latest results, we test whether these factors could play a similar role across EMEs. Specifically, we split the EMEs into five pairs of groups: (i) high vs low shares of energy and food in consumption baskets; (ii) high vs low shares of energy intensity of production; (iii) high vs low dollar import invoicing (iv) high vs low US dollar debt, capturing the extent of classic original sin; and (v) high vs low foreign ownership of local currency sovereign debt, capturing the extent of original sin redux. Focusing on one split at a time, we then estimate equations (1) or (2) separately for each of the corresponding country groups.
Graph 6 highlights some noteworthy results from these estimations. A greater weight of food and energy in consumption baskets is associated with a larger impact of commodity prices on both GaR and IaR (panels A and D). Higher dollar debt and greater foreign ownership of local currency sovereign bonds are associated with a larger impact of dollar appreciation on GaR, highlighting the relevance of both original sin and original sin redux for the international transmission of dollar movements (panels B and C). Finally, greater energy intensity of production (panel E) is associated with larger effects of the dollar exchange rate on IaR. Overall, these results support the notion that the channels discussed in Section 2 matter for the impact of commodity price and dollar exchange rate changes on stagflation risk across EMEs.
Conclusions
Our analysis suggests that commodity prices and the broad dollar exchange rate are important risk factors for global growth and inflation. Higher commodity prices and a stronger dollar each reduce GaR and raise IaR in economies that are not dependent on commodity exports. Our findings further suggest that the impact on risks is more pronounced for EMEs than for AEs. This reflects more commodity-intensive consumption and production in EMEs as well as their larger dollar debt burdens and shallower financial markets.
The role of commodity prices and the dollar as risk factors was very apparent during 2021/22. In the wake of the Russia-Ukraine war, commodity prices rose steeply, and the US dollar appreciated, before both trends reversed in late 2022. The joint surge in commodity prices and the dollar was associated with a steep rise in inflation and a marked slowdown in economic growth globally during 2022. Our analysis suggests that the individual stagflationary effects of commodity prices and the dollar on non-commodity export-dependent economies have compounded each other over this period as the two variables increased in tandem. This was a break from the historical pattern, when commodity prices and dollar used to move in opposite directions, so that their individual effects on stagflation risk tended to offset each other.
A lasting positive correlation between commodity prices and dollar exchange rate would imply greater challenges for macro-financial stability policies going forward. It could lead to greater macroeconomic volatility and more difficult trade-offs between inflation and output stabilisation.
References
Adrian, T, N Boyarchenko and D Giannone (2019): "Vulnerable growth", American Economic Review, 109, no 4, pp 1263–89.
Aikman, D, J Bridges, S Hoke, C O'Neill and A Raja (2019): "Credit, capital and crises: a GDP-at-risk approach", Bank of England, Staff Working Papers, no 824, September.
Arslanalp, S and T Tsuda (2014): "Tracking global demand for emerging market sovereign debt", IMF Working Papers, no 14/39, March.
Aslam, A, O Celasun, R Bems S Beidas-Strom and Z Koczan (2016): "Trading on their terms? Commodity exporters in the aftermath of the commodity boom", IMF Working Papers, no 2016/027.
Banerjee, R, J Contreras, A Mehrotra and F Zampolli (2020): "Inflation at risk in advanced and emerging economies", BIS Working Papers, no 883.
Bernanke, B, M Gertler and M Watson (1997): "Systematic monetary policy and the effects of oil price shocks", Brookings Papers on Economic Activity, no 1, pp 91–157.
BIS (2019): "Monetary policy frameworks in EMEs: inflation targeting, the exchange rate and financial stability", Annual Economic Report, Chapter II, June.
Boz, E, C Casas, G Georgiadis, G Gopinath, H Le Mezo, A Mehl and T Nguyen (2020): "Patterns in invoicing currency in global trade", IMF Working Papers, no 20/126.
Bruno, M and J Sachs (1985): Economics of worldwide stagflation, Harvard University Press.
Bruno, V and H S Shin (2015): "Cross-border banking and global liquidity", Review of Economic Studies, vol 82, no 2, April, pp 535–64.
Drechsel, T, M McLeay and S Tenreyro (2019): "Monetary policy for commodity booms and busts", proceedings of the Federal Reserve Bank of Kansas City Jackson Hole symposium.
Gopinath, G, E Boz, C Casas, F Diez, P-O Gourinchas and M Plagborg-Møller (2020): "Dominant currency paradigm", American Economic Review, vol 110, no 3, March,
pp 677–719.
Hamilton, J (1983): "Oil and the macroeconomy since World War II", Journal of Political Economy, vol 91, pp 228–48.
--- (1996): "This is what happened to the oil price-macroeconomy relationship", Journal of Monetary Economics, vol 38, pp 215–20.
Hasenzagl, T, M Plagborg-Møller, L Reichlin and G Ricco (2020): "When is growth at risk?", Brookings Papers on Economic Activity, Spring, pp 167–229.
Igan, I, E Kohlscheen, G Nodari and D Rees (2022): "Commodity market disruptions, growth and inflation", BIS Bulletin, no 54.
Hofmann, B, D Igan and D Rees (2023): "The changing nexus between commodity prices and the dollar: potential explanations and implications", BIS Bulletin, forthcoming.
Hofmann, B and T Park (2020): "The broad dollar exchange rate as an EME risk factor", BIS Quarterly Review, December, pp 13–26.
Hofmann, B, I Shim and H S Shin (2022): "Risk capacity, portfolio choice and exchange rates", BIS Working Papers, no 1031.
Lopez-Salido, J and F Loria (2019): "Inflation at risk", CEPR Discussion Papers, no 14074.
Machado, J and J Santos Silva (2019): "Quantiles via moments", Journal of Econometrics, vol 213, no 1, pp 145–73.
Rees, D (2023): "Commodity prices and the dollar", BIS, mimeo.
Shin, H S (2016): "The bank/capital markets nexus goes global", speech at the London School of Economics and Political Science, 15 November.
Technical annex
CPI = consumer price index.
Graph 1.B: Cumulative increments in real GDP growth and inflation rate since Q1 2022. Aggregates based on the median across countries.
Graph 2: 25 non-commodity export-dependent economies, consisting of 10 AEs (CA, CH, DK, DE, ES, FR, GB, IT, JP and SE) and 15 EMEs (CN, CZ, HK, HU, ID, IN, KR, MX, MY, PH, PL, SG, TH, TR and ZA). Non-commodity export-dependent economies are those for which less than 60% of the total merchandise exports comprise commodities, as defined by UNCTAD. Aggregates based on the simple average across countries.
Graph 2.A: Energy and food weight data are for 2022 or latest, data are missing for CN, HK, ID, TH, ZA and CA. Energy intensity data are for 2019 and is defined as total primary energy supply per unit of GDP 2017 PPP.
Graph 2.B: External USD debt refers to non-banks' total cross-border USD-denominated liabilities (bank loans and debt securities) as a percentage of GDP, as of Q3 2022. Assets of institutional investors refer to the sum of financial assets of insurance corporations, pension funds and other financial institutions (OFIs) as a percentage of GDP in 2021, data are missing for CZ, DK, HU, PH, PL, MY, SE and TH.
Graph 3: 22 non-commodity export-dependent economies, consisting of seven AEs (CA, CH, DK, the euro area, GB, JP and SE) and 15 EMEs (CN, CZ, HK, HU, ID, IN, KR, MX, MY, PH, PL, SG, TH, TR and ZA), for 1990–2019. Graphs show a four-quarter-ahead impact of commodity price increase and US dollar appreciation on growth-at-risk (10th percentile) and inflation-at-risk (90th percentile), estimated by fixed-effect quantile regressions, following Machado and Santos Silva (2019). To remove outliers, we exclude observations corresponding to one-year-ahead inflation above 30%.
Graph 4: Periods covered are Q2 2002–Q2 2008 (A), Q3 2011–Q1 2020 (B) and Q3 2021–Q3 2022 (C).
Graph 5: See above for Graph 3.
Graph 6: See above for Graph 3. External dollar debt is measured as non-banks' total cross-border US dollar-denominated liabilities (bank loans and debt securities) as a percentage of GDP. Foreign ownership of local currency sovereign bonds is measured as the share of central government debt securities denominated in local currency held by foreign investors, as estimated by Arslanalp and Tsuda (2014). Dollar invoicing of imports is the percentage of imports invoiced in the US dollar (Boz et al (2020)). The energy and food weight in consumption baskets are based on those in the national CPI. Energy intensity is measured as total primary energy supply per GDP 2017 PPP. A country is allocated to the high/low group of an indicator if the average value of the indicator over the sample period is above/below the cross-country median of the averages.
1 The authors would like to thank Fernando Avalos, Claudio Borio, Stijn Claessens, Thomas Drechsel, Emanuel Kohlscheen, Marco Lombardi, Benoît Mojon, Hyun Song Shin, Nikola Tarashev and Egon Zakrajšek for helpful comments and suggestions. The views expressed are those of the authors and do not necessarily reflect those of the Bank for International Settlements.
2 The unusual co-movement may reflect both temporary and enduring factors. Among the former are the adverse financial stability implications of the commodity price surge, which triggered flight-to-safety into the dollar and the more rapid tightening of monetary policy in the United States than in most other economies. The main enduring factor is the transition of the United States from energy importer to exporter, which is causing the dollar to behave like a commodity currency. See Hofmann et al (2023) for a detailed discussion of the forces driving the change in the commodity price-dollar nexus in recent years. For a comprehensive analysis of changes in the association between the dollar exchange rate, global commodity prices and the US terms of trade, see Rees (2023).
3 Non-commodity export-dependent economies are those for which less than 60% of the total merchandise exports comprise commodities, as defined by UNCTAD. See https://unctad.org/topic/commodities/state-of-commodity-dependence.
4 In commodity-exporting economies, higher commodity prices are associated with an improvement of the terms of trade, ie the relative price of exports in terms of imports, providing a real income boost and loosening financial conditions by improving borrowers' repayment capacity (see Aslam et al (2016) and Drechsel et al (2019)). In commodity export-dependent economies, these channels are particularly pronounced and therefore likely to dominate. In the United States, dollar appreciation has different effects than elsewhere as it would reduce export competitiveness and would tend to be disinflationary by lowering import prices.
5 This is essentially the financial easing effect of commodity price increases on commodity exporters, as highlighted by Drechsel et al (2019), but playing out in reverse.
6 Moreover, in EMEs, inflation is often less well anchored around target and hence more persistent, implying more prevalent second-round effects that amplify the impact of price shocks from commodities or the exchange rate (BIS (2019)).
7 The AEs are CA, CH, DK, GB, JP, SE and EA. The EMEs are CN, CZ, HK, HU, ID, IN, KR, MX, MY, PH, PL, SG, TH, TR and ZA (see technical annex). The analysis also excludes the Covid-19 recession and the subsequent rebound as the extreme movements in real GDP may distort the estimated relationships.
8 In the estimation, we follow the approach proposed by Machado and Santos Silva (2019).
9 US real GDP growth and US PMI also act as controls for the demand side drivers of commodity prices.
10 Following Aikman et al (2019), we calculated stock market volatility as the quarterly average of the realised daily stock price volatility and three-year credit growth as the three-year change in the non-financial private sector debt-to-GDP ratio.
11 The standard errors are estimated by bootstrapping methods following Banerjee et al (2020).
12 The GaR and IaR impacts are notably larger than the mean effects obtained from standard fixed effects panel OLS estimation of equations (1) and (2). Specifically, the mean impact of a one standard deviation increase in the rate of change of commodity prices on growth and inflation is respectively –0.3 and 0.19 percentage points, while the effect of a one standard deviation increase in the rate of dollar appreciation is –0.28 and 0.14 percentage points, respectively.
13 The individual contributions are calculated respectively as the average of the quarter-on-quarter changes in commodity prices and the dollar exchange rate within each period, multiplied by the corresponding coefficient in equations (1) and (2).