I. A stronger expansion: how to make it last
Abstract
The global expansion has strengthened and broadened, owing in no small part to the post-crisis measures taken by monetary and regulatory authorities. Yet growth is still too dependent on central banks' actions. There are material risks to the outlook due to overstretched financial markets, high debt and rising protectionism. Policy should take advantage of the current cyclical upswing to mitigate these risks and rebuild room to address any future downturn.
Full text
In the year under review, the global economy outperformed expectations. Growth strengthened and broadened; inflation remained subdued despite a further drop in unemployment rates; and, for most of the period, global financial conditions eased further even as monetary policy inched towards normalisation. Despite some loss of momentum in early 2018 and a deterioration in market sentiment, especially vis-à-vis emerging market economies (EMEs), most countries are expected, at the time of writing, to grow at above-potential rates in 2018 and 2019, and inflation is expected to pick up only moderately.
From a longer-term perspective, the global economy has been reaping the dividend from the post-crisis measures taken by monetary and regulatory authorities. Prolonged very easy monetary policies have underpinned the global recovery. And banking systems are now better capitalised and more resilient, and thus better positioned to support the economy (Chapter III).
The key challenge now is to sustain the higher growth beyond the near term. So far, the recovery has been too dependent on central banks' actions and unconventional policies, leaving some problems in its wake. Financial vulnerabilities have been rising. Financial markets appear overstretched. In some economies, credit has expanded strongly, often alongside large property price increases and sometimes heavy foreign currency borrowing. Globally, aggregate total non-financial debt has risen further relative to income. The room for fiscal and monetary policy manoeuvre is more limited than pre-crisis and, partly because policy has failed to address structural impediments, long-term potential growth rates are lower. And more recently, increasing protectionist pressures have challenged the international trade system that has buttressed global growth post-WWII. All this suggests that downside risks to growth are material, as has recently been confirmed by financial strains in some EMEs.
With this backdrop, policy should take advantage of the cyclical upswing to mitigate risks and to rebuild room to address any future downturn. Specifically, fiscal policy should be oriented at regaining space while structural policies should boost growth potential. The precious open multilateral trading system should be fully preserved. Macroprudential measures should be used to help strengthen further the financial system's resilience and mitigate financial excesses (Chapter IV). And with due regard for country-specific circumstances, it would be desirable to continue the process of monetary policy normalisation. The path ahead is a narrow one (Chapter II).
The chapter first describes how the macroeconomic and financial landscape has changed over the past year. It then discusses the near-term outlook and the policies needed to make growth more sustainable. Finally, it deals with the risks ahead.
The global expansion strengthens amid low inflation
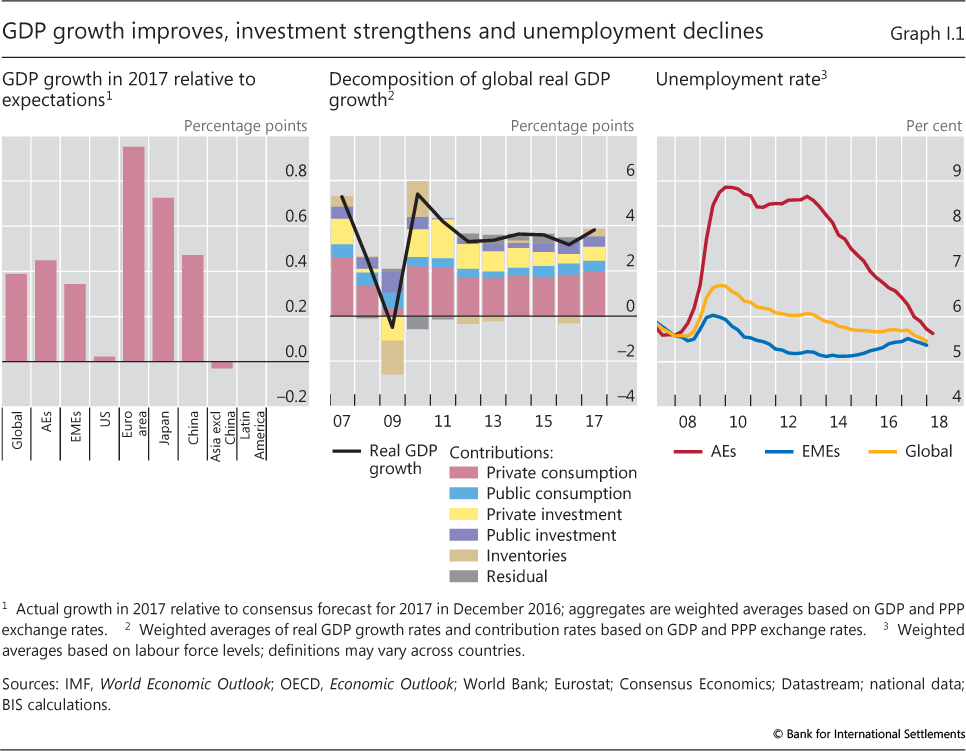
Over the past year, global economic activity accelerated. From 3.2% in 2016, global GDP growth is estimated to have risen to 3.8% in 2017, 0.4 percentage points above forecasts made at the end of 2016 and close to its long-run average. Despite losing some momentum in the last quarter of 2017 and the first quarter of 2018, especially in the euro area, growth remained above potential in most countries.
The growth pickup was more synchronised and more evenly spread across regions and countries than in the past few years. Growth in EMEs returned to rates closer to historical averages, recovering almost completely from the lows in 2014 and 2015. It also resumed in major commodity exporters, such as Brazil and Russia, after unusually long and deep recessions. And it beat forecasts in the euro area, Japan and China, while being approximately in line with them in the United States, Asia (excluding China) and Latin America (Graph I.1, left-hand panel).
The recovery was more evenly balanced also in terms of spending components. Along with inventories, private fixed investment contributed a larger share of global GDP growth than in 2016 (Graph I.1, centre panel). Its strong recovery, especially in the non-residential sector, accounted for most of the higher growth in advanced economies. In EMEs, private consumption was relatively more important. Investment overall also rebounded somewhat, but its evolution varied more across countries. In particular, investment fell as a share of GDP in China, as the economy continued to rebalance, while remaining subdued among commodity exporters.
As a result of these developments, manufacturing output and global trade expanded strongly. After several years of trailing behind services, manufacturing activity recorded the highest growth rates since 2014. And, with an annual increase of almost 5% in 2017, global trade increased at its fastest rate in years, benefiting manufacturing exporters, especially in East Asia. All of this contributed to a rebound in commodity prices, which in turn supported the gradual recovery in commodity-exporting countries.
As growth gathered pace, unemployment rates plunged to post-crisis lows (Graph I.1, right-hand panel). Remarkably, in some major economies, such lows were also close to postwar troughs. For example, in April 2018 unemployment reached 3.9% in the United States, the lowest except in 2000, 1966-69 and in the 1950s; 2.5% in Japan, the lowest in 25 years; and 3.4% in Germany, the lowest in almost 40 years. In these economies, labour shortages became evident, especially among specialised and highly skilled workers. Unemployment rates also declined rapidly in several EMEs. Standard estimates of the output gap (albeit highly uncertain) corroborate the view that several economies might have moved closer to full capacity. That said, the recovery did not advance as well everywhere. Despite Germany's strong performance, and no doubt hindered by structural factors, the unemployment rate in the euro area remained at 8.5% in April, with a wide dispersion across member countries.
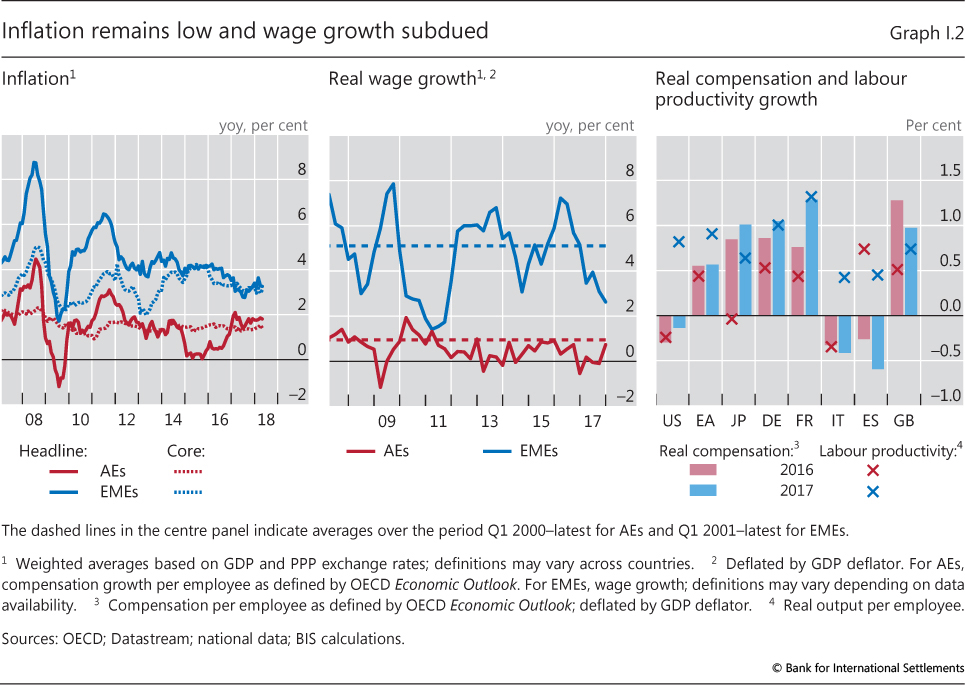
Against this backdrop, headline inflation moved up to almost 2% in advanced economies and slightly above 3% in EMEs. In both cases, the rebound in energy prices pushed average headline slightly above core inflation (Graph I.2, left-hand panel). While the increase in headline inflation has been relatively broad-based across major advanced economies, core inflation has varied significantly. With a few exceptions, core CPI inflation generally remains subdued. Over the past 12 months, it rose slowly in the United States and Japan, reaching 2.1% and 0.4% respectively in April. In contrast, over the same period, it oscillated around rates near 1% in the euro area.
Relatively low core inflation has generally reflected subdued wage growth. Over the past year, real wage growth in advanced economies picked up but remained below average (Graph I.2, centre panel). In some economies, including the United States and the euro area, real compensation growth was substantially lower than productivity gains, while in other advanced economies it was either just above or in line with productivity gains, thereby putting little or no upward pressure on unit labour costs (Graph I.2, right-hand panel). Real wage growth in EMEs was below historical averages.
Low wage growth in the face of fast declining unemployment is somewhat puzzling. True, historically wage growth has typically lagged behind inflation and productivity growth, a pattern that has coincided with a secular erosion of labour's income share. But evidence also indicates that the link between wage (or unit labour cost) growth and measures of labour market slack, albeit much weaker than in the past, is still present. Based on historical correlations, wage inflation should have been higher.
A number of factors may help explain the low wage inflation. To begin with, labour market slack may be larger than headline figures suggest, partly reflecting hysteresis effects from the Great Financial Crisis (GFC) as well as structural changes in labour markets. In some countries, broader unemployment measures, which include discouraged and part-time workers, are significantly higher than headline unemployment rates (eg close to 8% in the United States). Post-crisis, participation rates have generally increased, except in the United States, where they are more than 3 percentage points lower than in 2008. Part of these increases reflects a higher participation of workers over 55 years old.1 As a result, firms might still be facing a relatively elastic labour supply, allowing them to fill vacancies without having to offer significantly higher wages.
Another reason is that globalisation, even if it may have slowed in the last few years, continues to make labour markets highly contestable.2 Since the integration of China and the ex-Soviet bloc in the early 1990s, the world economy has been able to count on a much larger labour pool. In addition, a much greater share of production now takes place through value chains spread across many countries. To the extent that production can be outsourced to countries where labour costs are lower, workers face competition not only in their local labour market, but also externally. Hence, assessing labour market slack only by looking at domestic unemployment measures may be misleading. There is indeed some evidence that global value chains have made local production costs more sensitive to foreign factors and, relatedly, that unit labour costs have become more synchronised across countries.3
At the same time, other structural forces such as the adoption of new technologies have been gathering strength. The room for automating jobs has been increasing not only in manufacturing but also in services sectors.4 Although hard evidence is still scant, recent technological diffusion can surely put downward pressure on wage growth by further reducing labour's bargaining power. Meanwhile, by improving productivity, technological diffusion may help prevent inflation from rising, thus reducing wage demands. Technological diffusion could also lead to changes in product market structure. There is evidence that concentration in some economic sectors is on the rise, as fewer and more efficient firms gain ground at the expense of others.5 Productivity gains by a small number of firms may, at least initially, partly feed into lower prices, both directly and indirectly, by putting pressure on incumbents.6
Financial conditions remained very easy for most of the year
The global recovery was supported by very easy financial conditions which, in fact, eased further for most of the period under review. Only well into the first quarter of 2018 did signs emerge that a significant change in those conditions could be in the offing, especially for EMEs.
The monetary policy stance of major central banks remained very accommodative, although it diverged somewhat across areas (Chapter II). The Federal Reserve continued its very gradual tightening. The ECB extended the time frame of its asset purchase programme, albeit reducing its pace slightly. The Bank of Japan left its easing stance essentially unaltered. And the People's Bank of China kept its benchmark policy rates unchanged while expanding its use of central bank lending facilities.
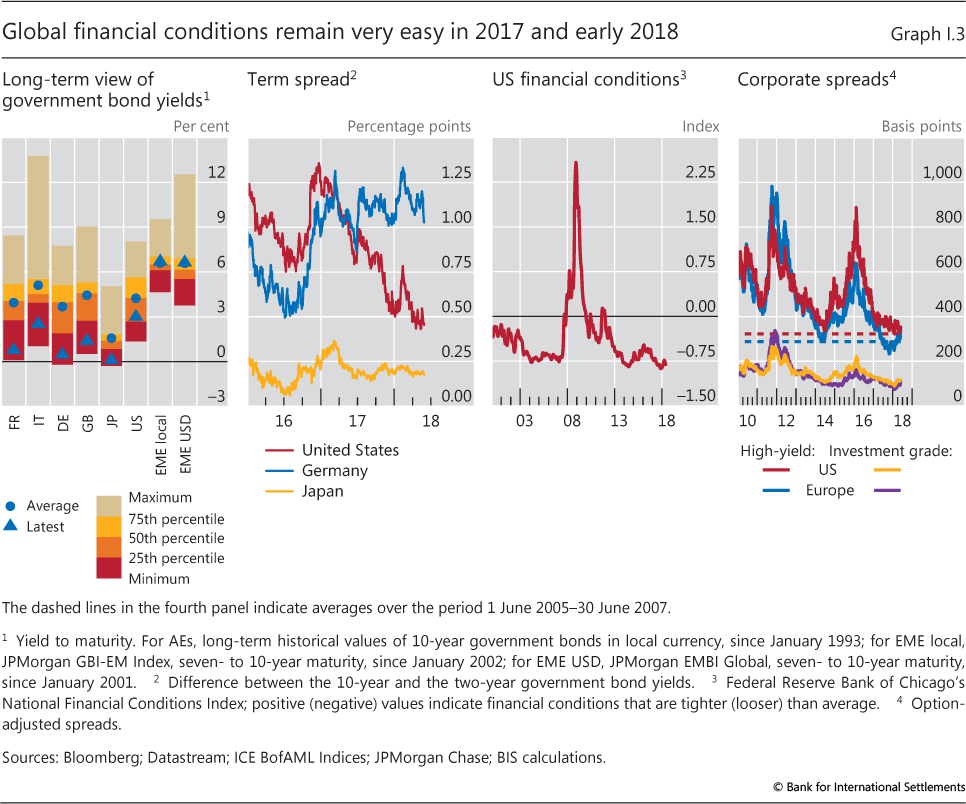
The government bond markets' reaction to these policy adjustments and the unexpectedly stronger growth outlook was, for most of the period in review, rather limited. In the United States, 10-year yields increased modestly until the turn of the year, when they began moving up steadily, reaching values close to 3% at the end of April. Even so, long-term yields in the United States and other major economies remained very low by historical standards (Graph I.3, first panel). In the United States, the yield curve remained relatively flat, reflecting unusually low term premia (Chapter II), whereas term spreads in the euro area stayed relatively high after the sharp steepening of the yield curve last June (Graph I.3, second panel).
Compressed long-term yields and term premia in the United States were to some degree surprising, given the monetary policy tightening and fiscal expansion there (Chapter II). At least two forces appear to have been at work: the persistent impact of relatively looser monetary policy in the euro area and Japan; and investors' expectations that inflationary pressures would remain under control even as growth strengthened, so that monetary policies would not need to adjust.7
Along with low bond yields, broader financial market indicators underscored the very easy financial conditions. Based on a composite index, financial conditions in the United States actually continued to loosen until the end of 2017 (Graph I.3, third panel) and, despite some subsequent tightening, they remained easier than during most of the pre-crisis period. In both the United States and the euro area, high-yield and investment grade credit spreads narrowed further till end-2017 (fourth panel) along with rising stock prices and low market volatilities. Such very easy financial conditions underwent some reversal in the first quarter of 2018, after a spike in stock market volatility, related to the liquidation of funds with values linked to volatility, led to a sharp drop in equity prices. While this episode highlighted the potential for disruptive market dynamics (Chapter III), it was a healthy correction that remained largely confined to equity markets.8
Until early 2018, the easing of global financial conditions had also gone hand in hand with a prolonged depreciation of the US dollar (Graph I.4, first panel). From December 2016 to March 2018, the dollar lost about 8% of its value in trade-weighted terms, of which more than half corresponded to a strengthening of the euro, the renminbi and the yen. It is unclear what explained the depreciation. The tightening of US monetary policy and the implied widening of short-term interest rate differentials relative to other major economies would have suggested an appreciation. However, it is not unusual for the dollar to depreciate when monetary policy tightens: in half of the past tightening cycles, the dollar depreciated, including in 2004-06, when the dollar lost about 7% in trade-weighted terms. This suggests that other factors are relevant. In 2017, one such factor was the unexpected strengthening of the global economy relative to the US economy. This may have boosted investors' risk appetite for non-US assets, including fixed income in EMEs, while bringing forward the expected timing (and possibly raising the expected speed) of a withdrawal of monetary policy stimulus in other major economies, especially the euro area.9 Uncertainties related to the US Administration's policies, especially concerning trade, but also fiscal policies, may also have played a role.
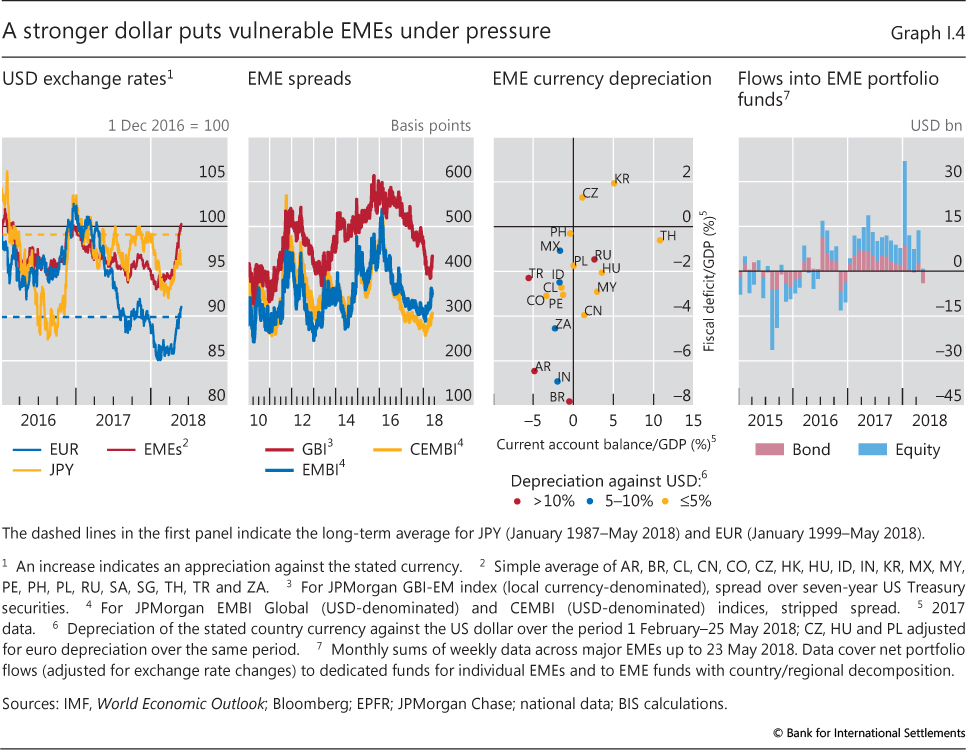
While supported by improved growth, financial conditions in EMEs largely mirrored the depreciation of the dollar. They eased significantly until the early months of 2018, as indicated by the large drop in the spreads on local currency bonds (over 130 basis points from January 2017 to February 2018) as well as dollar-denominated bonds (Graph I.4, second panel). Then, in the first quarter of 2018, as the dollar reversed course and started to appreciate (Graph I.4, first panel) and US long-term yields rose, conditions tightened considerably, with EME currencies coming under pressure, especially those of countries with weaker current account and/or fiscal positions (Graph I.4, third panel). Tensions were acute in Argentina and Turkey, with the former turning to the IMF for support in May. After staying positive for an unprecedented 16-month spell, portfolio inflows came to a sudden halt and reversed in May (Graph I.4, fourth panel). Dollar-denominated bond spreads widened more, on average, than local currency ones (Graph I.4, second panel).
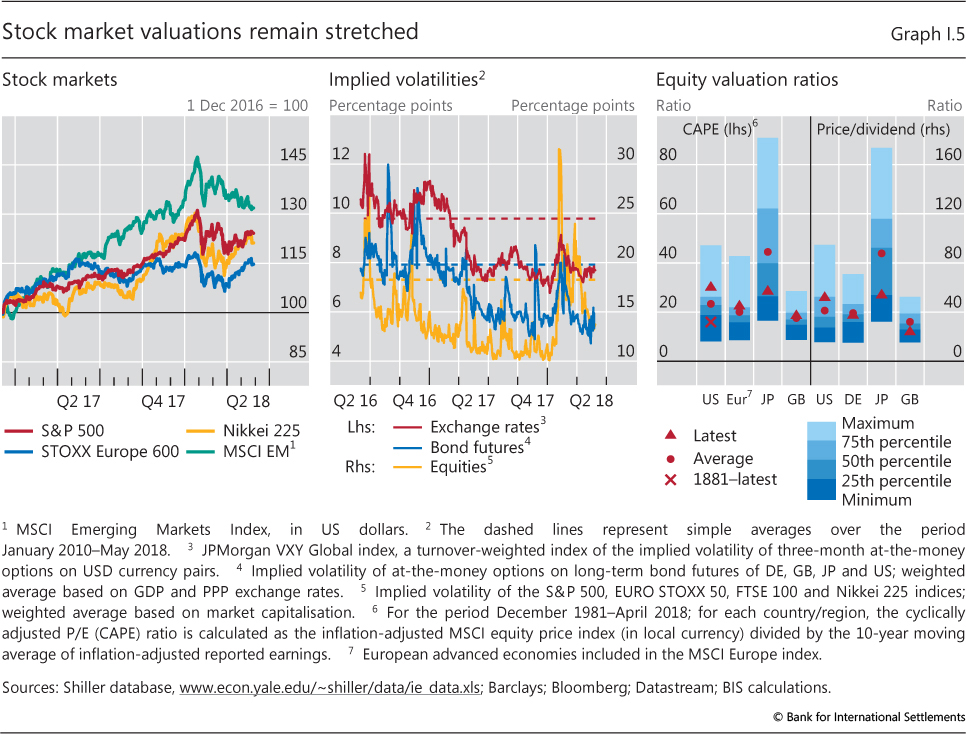
At the time of writing, it is hard to tell how the tightening of financial conditions will unfold across regions. In major advanced economies, credit spreads have increased only modestly, while equity markets have resumed their upward trajectory (Graph I.5, left-hand panel). Implied volatilities have also quickly subsided, remaining below recent historical averages (Graph I.5, centre panel). That said, concerns about stretched valuations remain, especially in the United States, where the cyclically adjusted price/earnings ratio has exceeded its post-1982 average and is almost twice its long-term 1881-2017 average (Graph I.5, right-hand panel).10 In the euro area, the spread of Italian sovereign debt relative to German bunds widened considerably in May, following political events. And in EMEs, conditions have continued to deteriorate, and could do so further should the US dollar extend its appreciation.
The near-term outlook
The global economy's unexpectedly strong performance over the past 12 months had led analysts to repeatedly revise upwards growth forecasts for 2018 and 2019 in most countries. This pattern prevailed until the first quarter of this year, when a number of indicators signalled a possible loss of momentum. While growth expectations have since been revised down in a number of countries, the prospects for the global economy overall remain upbeat. Based on consensus forecasts, global growth is currently forecast to rise to 3.9% in 2018, from an estimated 3.8% in 2017, before returning to 3.8% in 2019 (Graph I.6, left-hand panel).
The expected increase in global growth masks some differences across economies. In the United States, forecasts have been upgraded substantially since the announcement last December of the tax reforms and the spending stimulus: GDP is currently expected to expand by 2.8% in 2018 and 2.6% in 2019, from 2.3% in 2017. By contrast, euro area GDP is expected to grow by 2.3% in 2018, the same as in 2017, followed by a slowdown to 1.9% in 2019, with forecasts revised down in early 2018. In Japan, growth is expected to slow from 1.7% in 2017 to 1.3% in 2018 and 1.1% in 2019. In other advanced economies, growth is expected to decline over the next two years. And in EMEs, excluding China, growth is expected to rise to 4.2% in 2018 and 4.3% in 2019 (Graph I.6, left-hand panel).
These near-term forecasts are above long-run potential growth estimates in most countries, which are lower than pre-crisis and unlikely to go back up fully, given demographic headwinds and other structural impediments. For instance, based on long-term consensus forecasts (six to 10 years ahead), long-run growth is currently estimated to be 2.1% in the United States, compared with over 3% pre-crisis; 1.3% in the euro area, against 2% pre-crisis; and 0.7% in Japan, less than half the pre-crisis estimate. In EMEs, depending on the country, long-run growth expectations have dropped by between one fifth and one half from pre-crisis levels.
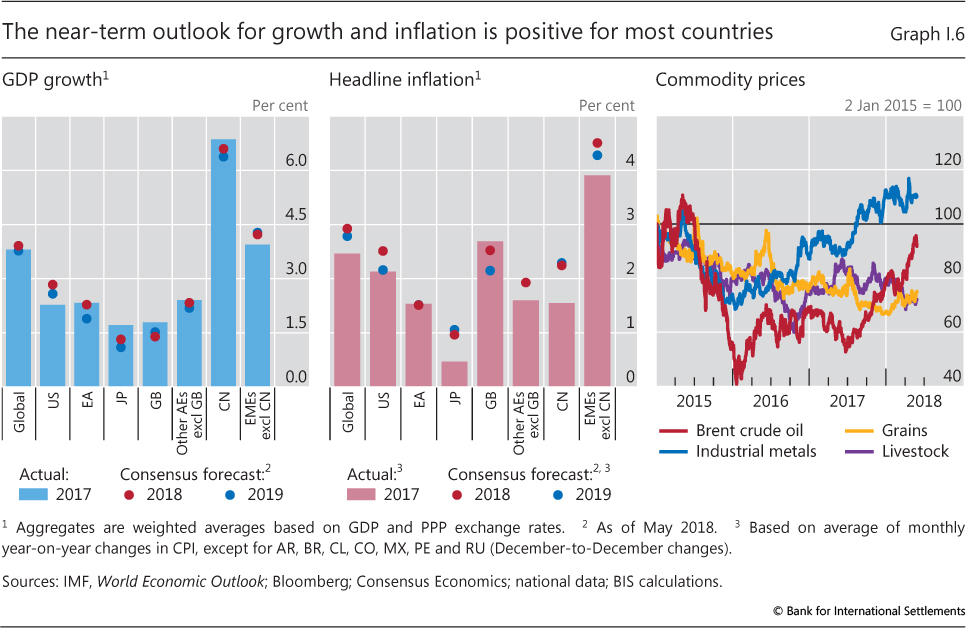
The outlook for inflation is generally consistent with projected stronger growth (Graph I.6, centre panel). Headline inflation is expected to increase in most countries, reflecting partly the reduction in output and labour market slack and partly the recent increase in the price of oil and other commodities. In particular, consensus forecasts see headline (CPI) inflation reaching 2.5% in 2018 in the United States, before dropping to 2.2% in 2019; and close to 1% in Japan in 2018 and 2019. In the euro area, by contrast, headline inflation is expected to remain unchanged at around 1.5% in both 2018 and 2019, albeit with significant variations across member countries. In line with the pickup in short-run inflation expectations, market-based measures of long-term ones have also moved up over the past 12 months in both the United States and the euro area; at the same time, consensus forecasts for inflation six to 10 years ahead have remained remarkably stable. The increase in oil and industrial metal prices over the past year should support the projected increase in headline inflation going forward (Graph I.6, right-hand panel).
In the near term, a number of mutually reinforcing factors should help support the global expansion. First, globally, low unemployment rates, some pickup in wage growth and limited expected increases in inflation should sustain household spending. Second, above-average business confidence readings and continued very accommodative financial conditions should support fixed capital investment. The recent reform of the tax regime in the United States is likely to be an additional driver of investment spending, especially in the short run. Third, thanks to the post-GFC financial reforms, banking systems are generally better capitalised and more resilient (Chapter III). Fourth, over the next two years, fiscal policy is set to turn strongly procyclical in the United States and mildly expansionary in Germany, while becoming broadly neutral in other economies.
At the same time, looking beyond the near term, such a strong projected momentum at an advanced stage in the upswing, alongside mild inflationary pressures, is quite unusual by historical standards (Box I.A). It is possible, as argued before, that there is more slack than conventional measures indicate. Moreover, to the extent that current investment raises productivity, albeit with a lag, there may be room for the economy to continue expanding at above-average rates beyond the near term. That said, there are questions about the sustainability of the current expansion. Strong investment and fiscal expenditure could, at a certain point, push the economy up against capacity constraints. This could lead to the emergence of stronger inflationary pressures than seen so far. And even without those pressures, it may become increasingly difficult for firms to find quality inputs and meet earnings expectations.
Over long horizons, the only way to ensure sustainable higher non-inflationary growth is through structural reforms. As examined in more detail in previous Annual Reports,11 while the necessary measures are country-specific, they share a number of features. Their common denominator is fostering entrepreneurship and the rapid take-up of innovation, limiting rent-seeking behaviour and promoting the flexible reallocation of all factors of production. Unfortunately, although the pace of structural reforms picked up in the immediate aftermath of the GFC, especially in countries that were hardest hit, it has slowed significantly since then. It is now the slowest since 2011.12 Naturally, the incentive to carry out politically difficult reforms wanes in good times, when they may appear less pressing. But it is then that any short-term adjustment costs can be borne more easily.
Making growth more sustainable also requires rebuilding the room for countercyclical policy, which has narrowed considerably relative to the pre-crisis period. This involves work on several fronts.
Box I.A
Evidence of unusual late-business-cycle momentum - a historical perspective
Global growth has picked up and broadened over the past year. This box compares recent developments with those of the past and finds that the current momentum in the recovery is unusually strong so late in the cycle.
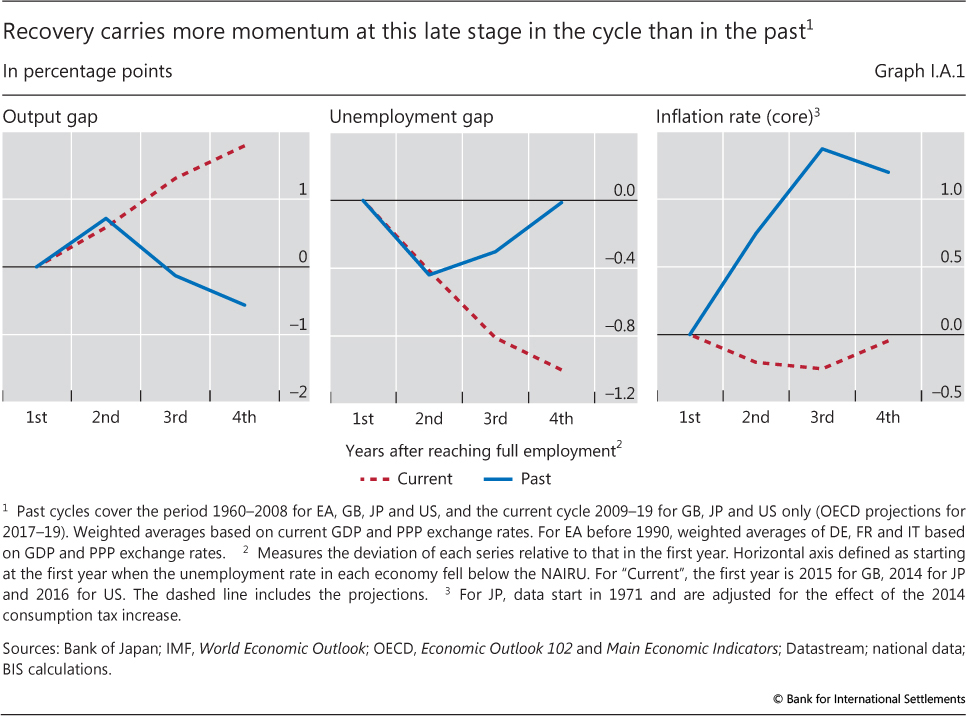
Since last year, there has been greater confidence that both output and unemployment rates will far exceed conventional benchmarks for potential output and full employment. Graph I.A.1 highlights these developments in the euro area, Japan, the United Kingdom and the United States. Relative to the averages of previous cycles (blue lines), these economies are forecast to carry far more momentum and hence to exceed those benchmarks much further in the years ahead (red lines).
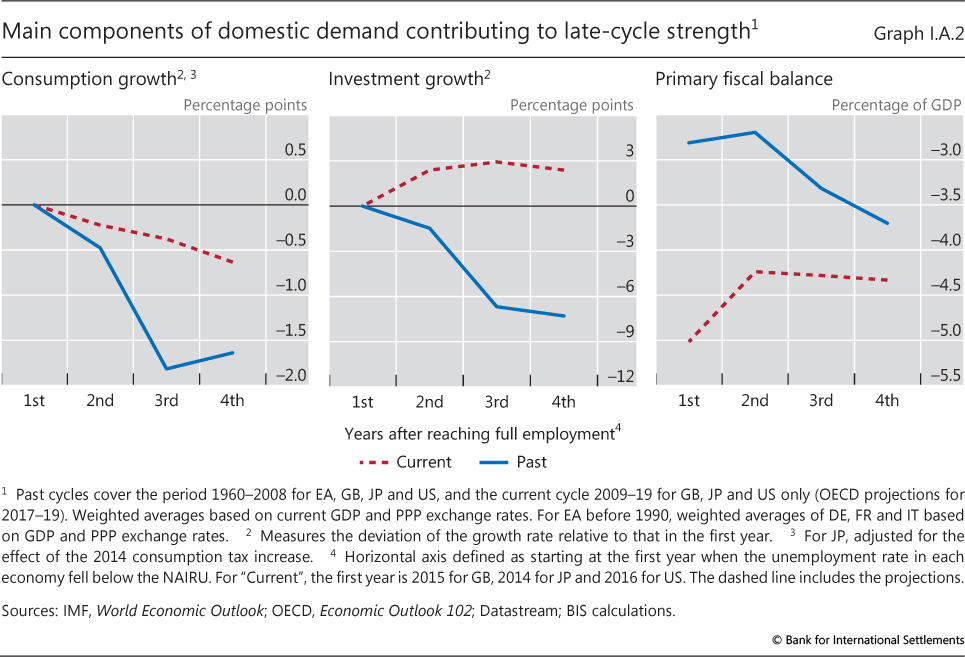
Investment and fiscal spending are two key drivers of this late-cycle momentum. Graph I.A.2 shows the main components of domestic demand for these major economies. While consumption growth exceeds the average of past cycles, both investment and fiscal spending are unusually strong. The late-cycle surge in investment reflects a delayed recovery after rather anaemic activity during most of the post-crisis period. The depreciation of the capital stock, the rise in capacity utilisation and the need to adopt new technologies are continuing to support this leg of the upswing. Similarly, current fiscal deficits are much higher than in previous cycles, and projections indicate a much more procyclical stance this time around.
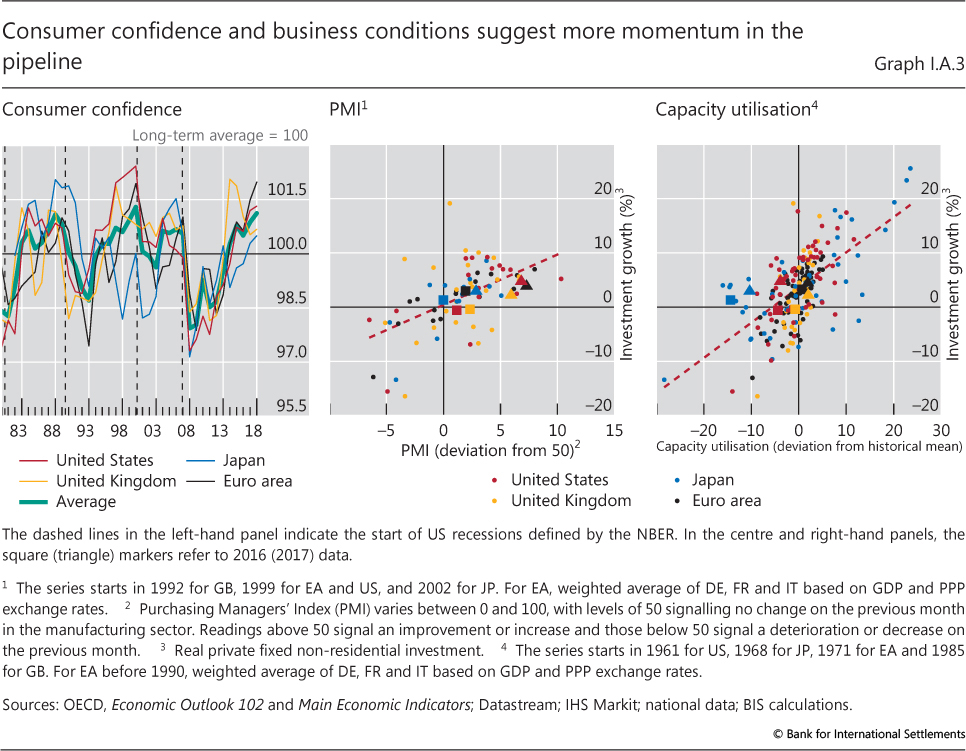
Other supportive conditions are in place, not least buoyant consumer and business sentiment. The recent levels compare favourably with past cyclical highs (Graph I.A.3). As in the past, this heralds further gains in employment and incomes that, in turn, will tend to boost confidence further. This mutually reinforcing process, especially in periods of relatively easy financial conditions, suggests that there is more underlying economic momentum in the pipeline.
That said, questions remain about whether the stronger momentum can be maintained. Admittedly, it is always difficult to draw precise parallels between current macro-financial conditions and those that, in the past, derailed recoveries. Moreover, as discussed in Box I.B, there are reasons to believe that the nature of the business cycle, and in particular the role of inflation and financial factors, has changed over time. And, last but not least, there is considerable uncertainty about the measurement of full employment and potential output as events unfold, ie in "real time". Even so, historical experience tends to suggest that output and employment exceeding those benchmarks tend to increase the likelihood of a subsequent downturn.
 Put differently, under those conditions it may prove more difficult for policy to ensure a smooth transition back to a balanced, sustainable growth path.
Estimates of potential output and the natural rate of unemployment are subject to real-time uncertainty. For example, the structural changes discussed in the main text suggest that currently there may be more slack in the economy than conventionally measured. There are also reasons to consider that real-time benchmarks may be biased upwards because of the way trends are calculated (the "endpoint problem"). All else equal, if a recession were to materialise, current gaps would tend to be revised down. What happened in the wake of the Great Financial Crisis was no exception to this pattern. See D Staiger, J Stock and M Watson, "How precise are estimates of the natural rate of unemployment?", in C Romer and D Romer (eds), Reducing inflation: motivation and strategy, University of Chicago Press, 1997; M Watson, "How accurate are real-time estimates of output trends and gaps?", Federal Reserve Bank of Richmond Economic Quarterly, vol 93, no 2, Spring 2007; F Grigoli, A Herman, A Swiston and G Bella, "Output gap uncertainty and real-time monetary policy", IMF Working Papers, WP/15/14, January 2015; and E Rusticelli, D Turner and M Cavalleri, "Incorporating anchored inflation expectations in the Phillips curve and in the derivation of OECD measures of the unemployment gap", OECD Journal: Economic Studies, vol 2015/1, 2015. See M Jackson and T Pietro, "A forest fire theory of the duration of a boom and the size of a subsequent bust", June 2017.
First, in countries where financial vulnerabilities are building up (see below), macroprudential measures can be very helpful in rebuilding policy buffers and can help rein in financial excesses (Chapter IV). Indeed, in many countries major efforts to implement macroprudential frameworks have been an essential complement to the financial reforms aimed at strengthening individual institutions and key infrastructures (Chapter III). The measures are particularly well suited to target specific vulnerabilities, such as in the mortgage market, and can significantly improve the trade-offs the authorities need to make when articulating a balanced policy response to the macro-financial challenges they face. At the same time, they do not always address the root cause of the problems and have so far proved more effective in strengthening resilience than in succeeding, on their own, in fully preventing the build-up of financial imbalances (Chapter IV).
Second, fiscal space needs to be preserved or rebuilt, naturally with due regard for country-specific circumstances. Public debt has risen to new post-WWII highs in both advanced and emerging market economies. Against the backdrop of falling long-run potential growth rates, such higher levels of debt are likely to have reduced fiscal space. The need to build fiscal space is especially important in those economies where fiscal solvency has already been called into question, as during the euro area debt crisis, and where financial expansions may be disguising the true state of public finances, not least owing to temporarily buoyant tax revenues. Besides the need for fiscal space for the macroeconomy more generally, sound public finances are also an essential backstop for the financial system.13
Finally, monetary policy normalisation, too, is essential. It would create room for countercyclical policy when needed in the future, help reduce the risk of the emergence of financial vulnerabilities and contribute to restraining debt accumulation. That said, as discussed in detail in Chapter II, given the unprecedented starting point, including high debts and persistently low inflation in many jurisdictions, the path ahead for monetary policy is quite narrow. It calls for striking a delicate balance between competing considerations while taking heed of country-specific conditions.
The risks ahead
Against the backdrop of positive near-term prospects, what might be the risks ahead? In order to understand them better, it is essential to pay particular attention to financial factors. Since at least the 1980s, their relevance for business cycle fluctuations has grown (Box I.B). The GFC is just the most recent and prominent example. In addition, with financial conditions having been so easy for so long, the possibility of a reversal with macroeconomic consequences cannot be ruled out. The recent wobbles in EMEs confirm this possibility.
To be sure, the trigger for a materialisation of risks need not be financial at all. Of particular concern today would be an escalation in trade tensions, which would negatively affect business confidence and investment. Were this seen as threatening the current multilateral trading system, the impact could be very significant. Another possible trigger could be inflation surprising on the upside. Or worries about fiscal sustainability may return, not least in high-debt slow-growing economies. Political events may put some countries under strain. And spending may simply flag as business profitability disappoints. But, even if not acting as triggers, financial factors are likely to be powerful amplifying forces.
In order to explore these issues further, after examining the background risks that could arise from the state of financial cycles around the world, we focus on two specific risk scenarios: a snapback in bond yields sparked by an inflation surprise in major economies; and a sharp reversal of risk appetite unrelated to such a surprise. We then turn to the question of the longer-term evolution of risks, should the non-inflationary expansion continue and, given historically low interest rates, support the build-up of financial imbalances and debt - private and public. All of these issues are especially pressing due to the more limited room for policy manoeuvre.
How have financial cycles played out so far?
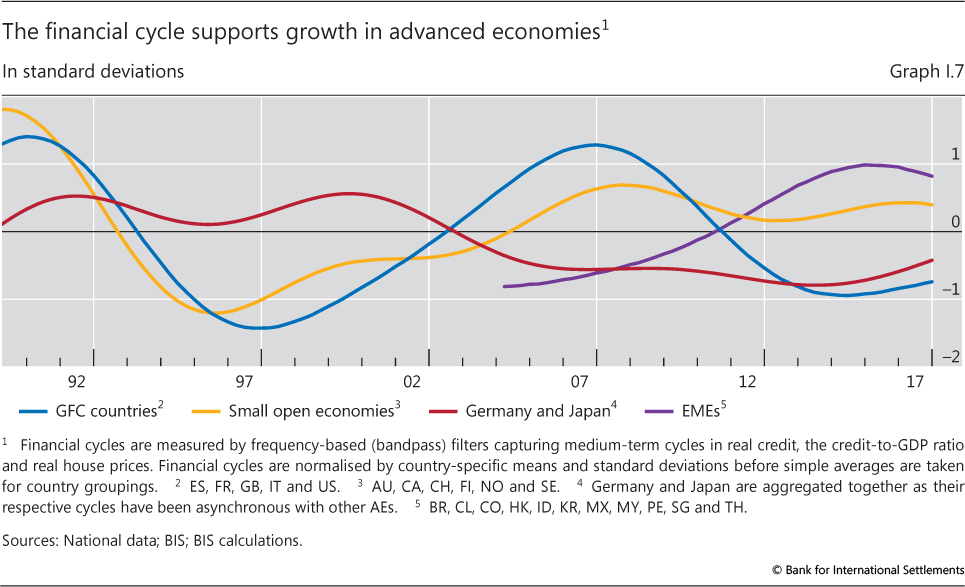
The term "financial cycle" generally refers to the self-reinforcing interactions between perceptions of value and risk, risk-taking and financing constraints that can amplify business cycle fluctuations and are reflected in the joint behaviour of credit and asset prices (Box I.B). Empirical work indicates that the financial cycles that pose the greatest risk for economic activity are best captured more specifically by combining information from medium-term fluctuations in credit and property prices, although equity prices naturally also play a role. Graph I.7 illustrates the state of the financial cycle aggregating across different countries in broadly similar phases, using a simple measure that combines the relevant information (see Box I.B for further details).
The graph indicates that in major advanced economies financial cycles are at a relatively early stage of the expansion. This set of countries includes some of those at the heart of the GFC and that have seen some private sector deleveraging since then. In particular, at least at the aggregate level, no worrisome boom is evident in the United States and the United Kingdom: this is because, while property prices have recovered strongly from their post-crisis lows, credit-to-GDP ratios remain well below their pre-crisis peaks (not shown). Similarly, in some large advanced economies less severely affected by the GFC, such as Germany and Japan, the financial cycle is also on an upswing. This suggests that, in the near term, the cycles will not act as a headwind to economic activity and could support it further.
By contrast, in several advanced small open economies that avoided the crisis, strong financial cycle expansions seem to be coming to an end. After a period of rapid increase, growth in credit to corporates and households has decelerated since 2016, while growth in property prices has slowed or turned negative. However, household credit as a ratio to GDP remains at historical highs in Australia, Canada and some Nordic countries (Graph I.8, left-hand panel). To mitigate these vulnerabilities, national authorities have been encouraging banks to tighten their lending standards or have adopted macroprudential measures (Chapter IV).
Box I.B
The changing nature of the business cycle and its link to the financial cycle
Since the early 1980s, a number of important changes have made financial factors more important in driving business cycle fluctuations while reducing the relevance of inflation as an indicator of unsustainable expansions. First, financial markets have been liberalised, starting around that time. Without sufficient safeguards, this change created the potential for larger booms, followed by busts, in credit and asset prices - that is, larger financial cycles. Second, starting roughly at the same time, inflation-focused monetary regimes became the norm. Central banks' focus on inflation control led them to gradually downplay the role of monetary and credit aggregates and to rely almost exclusively on microprudentially oriented supervision and regulation to affect financial behaviour during financial booms and hence minimise any fallout as booms turned to busts (Chapter IV). This meant that they had little reason to tighten policy if inflation remained low, even as financial imbalances built up. Finally, from the 1990s on, the entry of China and former Communist countries into the world economy, the international integration of product markets and technological advances have boosted global supply and productivity. Along with greater central bank credibility, this has made it more likely that inflationary pressures would remain mute even as expansions gathered pace. It also means that financial booms can build up further and that a turn in the financial cycle, rather than rising inflation, may bring about a downturn in economic activity.
These factors were clearly present also in the run-up to the Great Financial Crisis. Short-term output volatility as well as the level and volatility of inflation remained low (the so-called Great Moderation). At the same time, leverage in the financial and non-financial system rose. When the financial cycle turned, financial stress emerged and the economy experienced a serious recession.
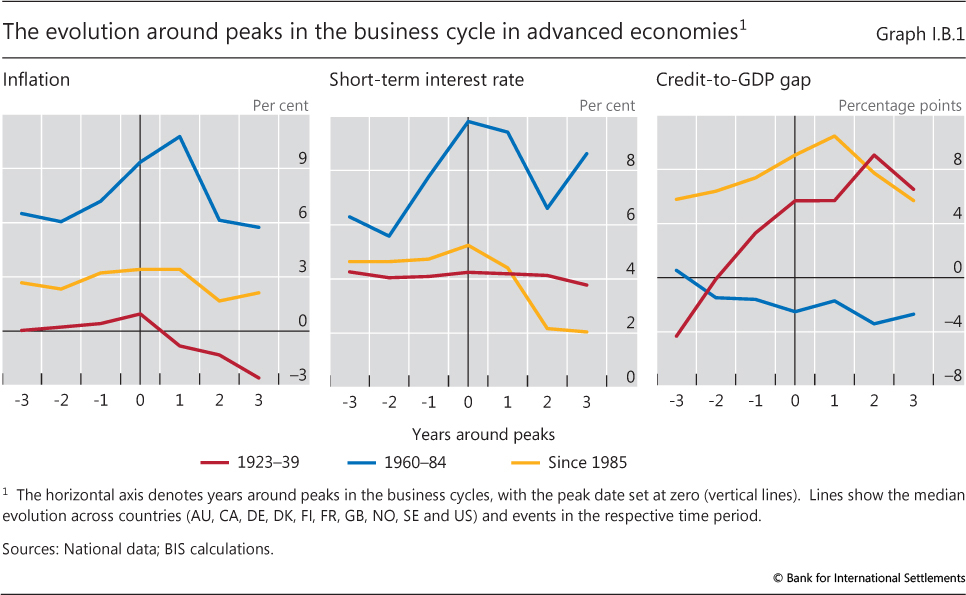
Graph I.B.1 illustrates some of these changes for a group of advanced economies, focusing on the behaviour of key variables around business cycle turning points. In the period 1960-84, inflation was higher and tended to increase by several percentage points, peaking soon after output; the short-term nominal interest rate also tended to increase by several percentage points, closely tracking inflation; and there was no credit boom - in fact, the credit-to-GDP gap tended to decline slightly after the business cycle turned. By contrast, since 1985 inflation has been lower and remarkably stable around business cycle peaks; the short-term interest rate has increased only modestly; and credit has boomed in the upswing, as indicated by the positive and large credit-to-GDP gap. Interestingly, these patterns resemble those observed between the two world wars, given that the 1920s saw a large credit boom against the backdrop of low inflation, a high degree of global trade and financial integration, as well as a monetary regime that de facto kept a lid on inflation. Similar patterns were also in evidence pre-WWI (the classical gold standard) - the previous era of globalisation.
One noteworthy mechanism behind the interaction between the financial and business cycles operates through the accumulation of debt and the subsequent increase in debt service burdens. That is, in the upswing of the financial cycle, new borrowing and rising asset prices boost economic growth. Over time, however, the accumulation of debt implies ever larger debt service commitments. These commitments have a strong and long-lasting negative impact on expenditures of indebted households and corporations. Hence, once the financial cycle turns, the positive effects of new credit on spending fade while the negative ones of the debt service burdens grow. It is therefore unsurprising that measures of financial cycle expansions, not least those that include the evolution of debt service burdens, can be useful leading indicators of subsequent economic downturns and that they also help explain the length and depth of the Great Recession.
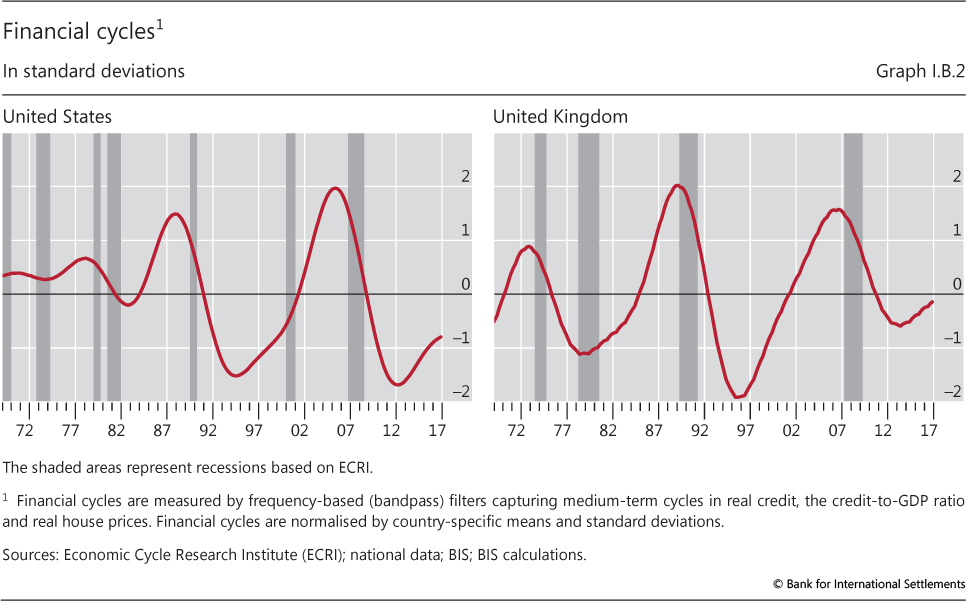
When focusing on the financial fluctuations that cause the greatest damage to economic activity (and the financial system), empirical research suggests that a promising strategy is to represent the financial cycle through medium-term fluctuations in credit and property prices. In turn, these fluctuations can be identified through a range of methodologies. A simple one, used in Graph I.B.2 and Graph I.7 in the main text, relies on statistical filters to extract cyclical fluctuations over periods from eight to 32 years in real credit, the credit-to-GDP ratio and real property prices. It then combines these cyclical components into a single series. To facilitate comparison across countries, it is also useful to normalise the cyclical components by country-specific means and standard deviations, so that a value of one indicates that cycles are, on average, one standard deviation higher than normal.
As an illustration, Graph I.B.2 shows the evolution of the financial cycle in the United States and the United Kingdom. It is evident that the downswings of the financial cycle - characterised by high debt service, deleveraging and falling asset prices - are closely associated with the economic downturns that have occurred in these countries since the mid-1980s, with some of these coinciding with serious financial strains. This also holds true for other advanced economies not shown here.
For a discussion of policy regime changes and their implications for monetary and financial stability, see eg C Borio and P Lowe, "Securing sustainable price stability: should credit come back from the wilderness?", BIS Working Papers, no 157, July 2004; C Borio and W White, "Whither monetary and financial stability? The implications of evolving policy regimes", BIS Working Papers, no 147, February 2004; and C Borio, "Monetary and prudential policies at a crossroads? New challenges in the new century", Moneda y Crédito: Revista de Economía, vol 224, 2007. See eg B Eichengreen and K Mitchener, "The Great Depression as a credit boom gone wrong", in Research in Economic History, Vol 22, Emerald Group Publishing Limited, 2003, pp 183-237. See eg W Huffman and J Lothian, "The gold standard and the transmission of business cycles, 1833-1932", in D Bordo and A Schwartz (eds), A retrospective on the classical gold standard, 1821-1931, NBER, 1984; and C Goodhart and P Delargy, "Financial crises: plus ca change, plus c'est la meme chose", International Finance, vol 1, 1998. See eg BIS, 86th Annual Report, June 2016, Box III.A; M Drehmann, C Borio and K Tsatsaronis, "Characterising the financial cycle: don't lose sight of the medium term!", BIS Working Papers, no 380, June 2012; and S Claessens, A Kose and M Terrones, "How do business and financial cycles interact?", Journal of International Economics, vol 87, 2012. For evidence of the negative effects of high debt service burdens on household consumption and investment, see M Drehmann, M Juselius and A Korinek, "Accounting for debt service: the painful legacy of credit booms", BIS Working Papers, no 645, June 2017. M Juselius and M Drehmann, "Leverage dynamics and the real burden of debt", BIS Working Papers, no 501, May 2015, show that, even with real-time estimates, the predicted adjustment to leverage and the debt service burden from 2005 onwards implies paths for credit and expenditure that closely match actual developments before and during the Great Recession in the United States. More generally, for evidence of the negative effect of debt on growth, see also O Jorda, M Schularick and A Taylor, "The great mortgaging: housing finance, crises and business cycles", Economic Policy, vol 31, January 2016; A Mian, A Sufi and E Verner, "Household debt and business cycles worldwide", Quarterly Journal of Economics, vol 132, 2017; IMF, "Financial conditions and growth at risk", Global Financial Stability Report, October 2017, Chapter 3; and M Lombardi, M Mohanty and I Shim, "The real effects of household debt in the short and long run", BIS Working Papers, no 607, January 2017. See references in footnote 4.
In a number of EMEs, the financial cycle appears to have already turned.14 In 2017, credit and property prices expanded at a much lower rate than their average since 2010, and in several cases even contracted. China is a case in point, as after a very rapid increase its overall credit-to-GDP ratio peaked at the beginning of 2017. In particular, credit to the corporate sector fell sharply as the authorities intensified measures to encourage deleveraging and reduce financial stability risks.
Aggregate financial cycle measures can help to identify whether slow-moving financial factors are supporting or depressing growth and to spot risks ahead. They are, however, only a first step in the analysis of financial vulnerabilities. In several advanced economies, even in those where the financial cycle is still on an upswing, pockets of financial fragility have surfaced.
One example is the continuous deterioration of non-financial corporate balance sheets in the United States, the United Kingdom and, to a lesser extent, France and other European countries. The deterioration is evident in the steady increase in leverage, a significant drop in interest coverage ratios and a decline in the share of firms rated A or higher. In the United States, in particular, corporate leverage today is at its highest level since the beginning of the millennium and similar to that prevailing after the leveraged buyout boom of the late 1980s. This is so even after accounting for large corporate cash balances.15 And the large share of firms rated just investment grade (BBB) is especially vulnerable to a deterioration in their ratings to below investment grade.
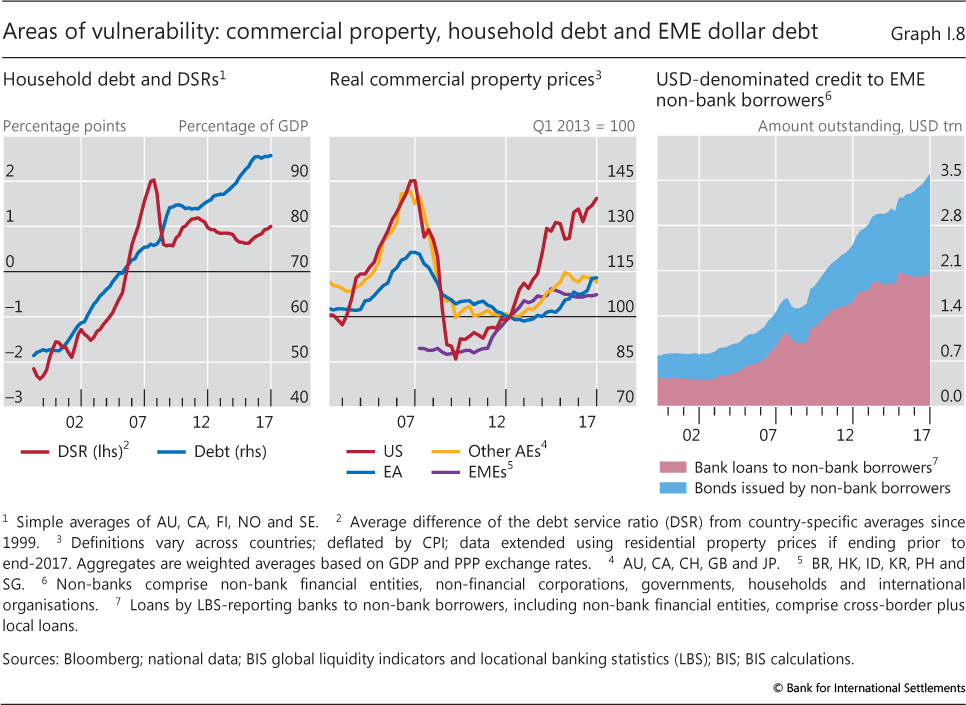
Another potential area of rising vulnerabilities is commercial real estate. Real commercial property prices have risen significantly in advanced economies. In particular, in the United States they are close to pre-crisis peaks (Graph I.8, centre panel). At the same time, nearly 50% of banks' real estate exposures are to commercial real estate, up from 40% five years ago. Values there seem particularly vulnerable to rising long-term yields. Some research suggests that, in the United States, a 200 basis point increase in long-term yields would lead to a more than 25% drop in commercial property prices.16
A third example concerns foreign currency borrowing in EMEs. There, the post-crisis financial cycle expansions went hand in hand with rapid growth in non-banks' US dollar borrowing, which continued throughout 2017. According to the BIS global liquidity indicators, the outstanding stock of US dollar credit to non-bank EME borrowers has roughly doubled since 2008 and currently stands at $3.6 trillion. As the dollar weakened in 2017, the annual growth rate of dollar-denominated credit to EME non-bank borrowers almost tripled from 3.1% at end-2016 to 8% at end-December 2017. Growth was especially pronounced in international debt securities, which expanded at an annual rate of 17% in December 2017 (Graph I.8, right-hand panel). Moreover, estimates indicate that borrowing through FX swaps, not covered by these statistics, was of a similar magnitude to that visible on balance sheets.17
These trends mean that EMEs have become more exposed to an appreciation of the dollar and to reversals in international investors' risk appetite, as recent events have confirmed. Consistent with this, there is a growing body of evidence indicating that post-crisis the value of the US dollar versus a broad basket of other currencies has become an important driver of global banks' leverage and cross-border capital flows, more so than the VIX (Chapter II).18 Meanwhile, the greater participation of foreign investors in local currency markets compared with pre-crisis might not necessarily act as a stabilising factor, as it may expose EMEs to a greater risk of capital flight.
Several developments in EMEs have reduced risks relative to previous episodes of large-scale foreign exchange borrowings, but they have not eliminated them altogether. Important mitigating developments include the large accumulation of foreign exchange reserves by EME central banks and, compared with the turbulence in the 1990s, more flexible exchange rate regimes. The active deployment of macroprudential measures should help too (Chapter IV). At the same time, these economies are not immune to a more general tightening of financial conditions, should the dollar continue to appreciate (see below and Chapter II) and a major shift in portfolio diversification be triggered among institutional investors.
Snapback risk
So far inflation has been rather unresponsive to the continuing tightening in product and labour markets, but at some point pressures could mount and inflation could surprise on the upside. For example, the longer the expansion continues, the more likely it is that capacity constraints will bite. This is especially so if, as projected, slack declines further at the global level: this would limit the safety valves available to individual countries and possibly generate additional pressures on commodity prices. In addition, if, as some evidence suggests, workers' and firms' expectations have become more backward-looking since the GFC, the lag before inflation emerges may simply be longer.19
To be sure, while inflation surprises cannot be ruled out, they are unlikely to be large. The secular structural forces keeping a lid on inflation will not vanish any time soon (see above). The increasing relevance of shale oil, given its greater responsiveness to prices, coupled with advanced economies' lower oil dependence than in the past, should dampen inflation spikes linked to sharp oil price increases and make them less persistent.20 And while an escalation of protectionist measures could well reverse part of these trends, a persistent impact on inflation would take time to emerge.
That said, even small changes in the inflation outlook (or monetary policy response) could elicit an outsize market response. Very compressed (even negative) term premia point to the potential for a quick and sharp reversal - a snapback - as illustrated during the market ructions in early February this year. Market participants clearly see low inflation stretching out into the future, and may also have taken considerable risks owing to investment strategies, such as benchmark-hugging and other forms of herding, that can amplify market moves. For similar reasons, credit and liquidity risks may also be underpriced. The underpricing may be more severe in sectors and countries where debt levels and credit flows have grown strongly post-crisis, including EMEs.
A snapback could be rapidly transmitted to other major bond markets, especially if it took place in the market of the dominant international currency - the US dollar. For one thing, term premia tend to be quite correlated internationally, even when the expected interest rate component of bond yields is not.21 This could lead to an undesired steepening of yield curves even in countries where output is still at or below potential and inflation remains well below objectives. Moreover, the increase in yields could be compounded by an appreciation of the dollar and capital outflows from countries with large dollar-denominated liabilities.
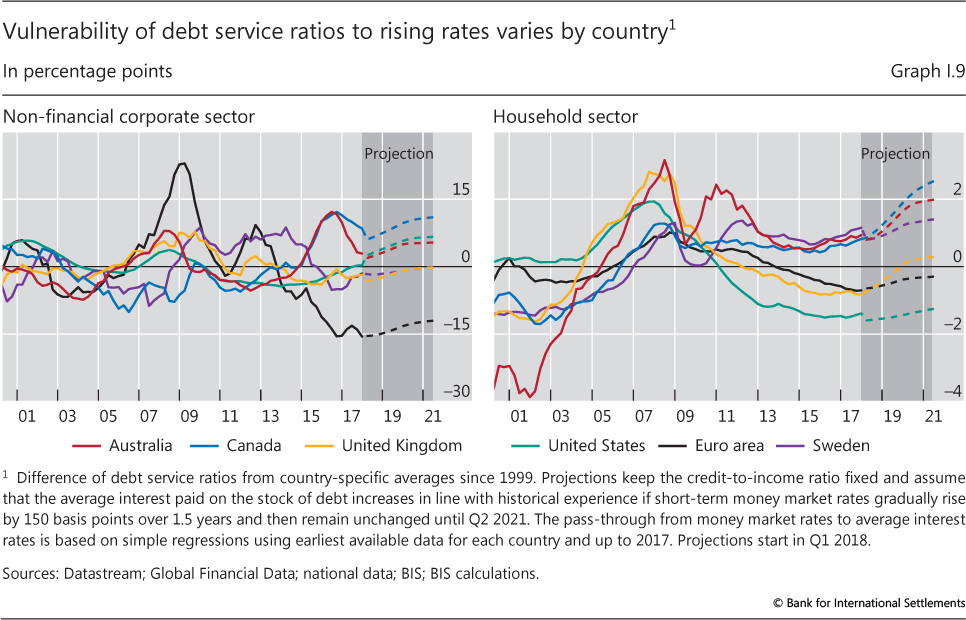
The effects of a snapback in bond yields on individual countries would depend on several factors. One is the size of debt and financial imbalances. The most exposed to such risks are naturally sectors and countries where debt in relation to income is high or short-run refinancing needs are large. Among these are several small open economies and, in particular, EMEs where the financial cycle has peaked (Graph I.7), dollar debt is high, current account deficits are large and foreign exchange reserve buffers small. This assessment is confirmed by a simple sensitivity analysis (Graph I.9). In some small open advanced economies that have seen the largest increases in debt post-crisis, higher interest rates would push debt service burdens well above long-run averages, thus dampening consumption and investment (Box I.B). A second factor is the extent to which lenders could absorb any credit losses. In most countries, banks are generally better capitalised than pre-crisis, especially in countries hard hit by the GFC (Chapter III). However, post-crisis, a greater share of credit has been intermediated by non-banks, especially the shadow banking system.22 A third factor is the participation of foreign investors in local markets, as the asset management industry has grown rapidly in recent years and become more global in its investment. This makes markets more vulnerable to a reversal in flows and an evaporation of liquidity in times of stress (Chapter III). While these risks are hard to assess, a combination of these factors would make a country especially vulnerable.
Reversal of risk appetite
A generalised sharp tightening of financial conditions may occur even if there is no inflation or monetary policy surprise in the large economies that are home to international currencies. In some EMEs it could be induced, for instance, by the domestic financial cycles contracting, given signs that they may have turned (Graph I.7). In advanced economies, worries about fiscal sustainability may return, especially in countries with high debt and slow growth and/or facing politically challenging circumstances. More generally, even in the absence of inflationary pressures, sentiment-driven swings in business or residential investment could initiate a contraction, not least if profits were to disappoint and undermine stretched equity valuations.23
A severe tightening of financial conditions could play out somewhat differently from a snapback in bond yields in the major advanced economies. In particular, as international investors retreated from the countries affected, stronger flows to safe haven countries could well depress term premia there.
Despite the positive effects of safe haven flows, growth in receiving countries could be more adversely affected than in the past even if the shock originated in EMEs. The latter now account for 60% of global GDP and have contributed more than two thirds of its growth since 2010. In various adverse scenarios that hit growth in EMEs, model-based simulations indicate that growth in major economies could be reduced by up to 1 percentage point, possibly a conservative estimate.24 Given the currently lower potential growth rate of several advanced economies, the risk of downturn could be material if the original contraction was large enough.
Risks from the further build-up of financial imbalances and debt
Even if a soft landing scenario in the global economy materialises in the near to medium term, downside risks could increase over the longer term. In particular, the combination of a non-inflationary expansion and low interest rates would be likely to encourage the further, gradual build-up of financial imbalances and debt accumulation more generally, creating the conditions for a more costly contraction further down the road.25 In addition to private sector debt accumulation, procyclical fiscal policies, facilitated by current low borrowing costs, could lead to a further rise in public debt, especially if, as evidence indicates, the financial expansion has flattered the fiscal accounts.26 While supportive of growth in the short run, expansionary fiscal policies could force retrenchment in the future and further limit any room for policy manoeuvre. Indeed, a growing body of studies documents how higher leverage, in both the private and public sectors, can boost growth in the short run, but at the cost of lower growth on average, including deeper and prolonged recessions, in the future.27
From a long-term perspective, the continuous accumulation of debt is worrying for at least two reasons. First, the higher the debt, the more sensitive the economy and financial valuations are to higher interest rates, reducing the level of interest rates an economy can bear. This, in turn, makes it more difficult to raise them, favouring further debt accumulation - a kind of "debt trap" (Chapter II). Second, higher debt - private and public - narrows the room for policy manoeuvre to address any downturn.
This broad analysis of risks, financial and real, points to a clear message. While the global economy has made substantial progress post-crisis and near-term prospects are positive, the path ahead is a narrow one. The risks highlight the importance of taking advantage of the current upswing to implement the necessary measures to put the expansion on a stronger footing and to rebuild policy buffers. Such buffers are essential to regain the room for policy manoeuvre to tackle the next downturn, which will surely come at some point.
Endnotes
1 The participation rate of workers aged 55 to 64 increased from 56% in 2008 to 62% in 2016 on average across OECD countries. In Germany, it increased from about 60% in 2008 to over 70% in 2016. Given their shorter expected tenure, this group of workers tends to command lower wages relative to younger groups. See B Mojon and X Ragot, "The labor supply of baby-boomers and low-flation", Sciences Po OFCE Working Paper, no 9, 2018-01.
2 For example, the diffusion of global production chains has slowed post-crisis. That said, costs have not fully converged across countries, suggesting room for further integration. Even without the greater contestability of labour markets due to globalisation, existing competitive pressures may interact with other factors to keep inflation weak. One example concerns the formation of inflation expectations embedded in wage negotiations. Due to existing competitive pressures, workers may be (temporarily) more reluctant to ask for wage increases in line with inflation targets. Thus, inflation expectations may have become more inertial (or appear as de-anchored), reflecting more heavily past inflation outcomes than inflation targets.
3 See BIS, 87th Annual Report, June 2017, Box IV.B. Evidence on the relevance of measures of global slack in Phillips curves is mixed. C Borio and A Filardo, "Globalisation and inflation: new cross-country evidence on the global determinants of domestic inflation", BIS Working Papers, no 227, May 2007, and R Auer, C Borio and A Filardo, "The globalisation of inflation: the growing importance of global value chains", BIS Working Papers, no 602, January 2017, found that the expansion of global value chains accentuated the importance of global factors relative to domestic pressures. Other studies have questioned the quantitative relevance of this channel, eg J Ihrig, S Kamin, D Lindner and J Marquez, "Some simple tests of the globalization and inflation hypothesis", International Finance, vol 13, issue 3, Winter 2010; ECB, "Assessing labour market slack", ECB Economic Bulletin, issue 3/2017, Box 3; and D Brouillette and L Savoie-Chabot, "Global factors and inflation in Canada," Bank of Canada Staff Analytical Note, no 2017-17, October.
4 According to a detailed study of some 800 occupations in 46 advanced and emerging market economies, about 60% of occupations have at least 30% of their content that can be automated based on existing technologies (McKinsey Global Institute, A future that works: automation, employment, and productivity, January 2017).
5 See eg D Andrews, C Criscuolo and P Gal, "Frontier firms, technology diffusion and public policy: micro evidence from OECD countries", OECD Productivity Working Papers, no 2, November 2015.
6 For example, the rise of e-commerce (the "Amazon effect") seems to have lowered retail price inflation in the United States by at least 0.1% per year between 2011 and 2015, without counting for the indirect effects; see eg K Kliesen and C Gascon, "An examination of current economic conditions in the nation and in the Memphis area", Regional Economic Briefing, Federal Reserve Bank of St Louis, October 2017.
7 Other factors may have also contributed, including the US Treasury's decision to shift its issuance towards shorter maturities and a possible continued strong demand for long maturities by insurers and pension funds needing to meet regulatory standards and to match their long-term liabilities.
8 See "Volatility is back", BIS Quarterly Review, March 2018, pp 1-15.
9 The dollar value may have been influenced not only by the expected beginning of normalisation in the euro area, but also by its expected path. That is, investors seem to have expected that once normalisation began in the euro area, it would proceed at a more rapid pace than in the United States.
10 Strong dividends lent some support to US equity valuations. However, dividends per share of US equities have been growing at a much faster rate since the GFC. High dividends per share have also been supported by large stock repurchases since the early 2000s. The latter may be further strengthened by the repatriation of offshore savings following the US tax reform.
11 See eg BIS, 83rd Annual Report, June 2013, Chapter III.
12 See OECD, Going for Growth 2018, March 2018.
13 See BIS, 86th Annual Report, June 2016, Chapter V.
14 Early warning indicators for systemic banking crises also point to the build-up of vulnerabilities in several EMEs: see I Aldasoro, C Borio and M Drehmann, "Early warning indicators of banking crises: expanding the family", BIS Quarterly Review, March 2018, pp 29-45.
15 See also IMF, Global Financial Stability Report, April 2018.
16 These effects are implied by current capitalisation rates (rent-to-price ratios) (ACLI survey) and the estimates in J Duca, P Hendershott and D Ling, "How taxes and required returns drove commercial real estate valuations over the past four decades", National Tax Journal, vol 70, no 3, September 2017, pp 549-83.
17 See C Borio, R McCauley and P McGuire, "FX swaps and forwards: missing global debt?", BIS Quarterly Review, September 2017, pp 37-54.
18 One possible mechanism is that when the dollar weakens, the creditworthiness of currency-mismatched borrowers improves and global banks' balance sheet constraints are relaxed, thereby increasing the supply of cross-border lending. In turn, this ends up stimulating real investment (see S Avdjiev, V Bruno, C Koch and H S Shin, "The dollar exchange rate as a global risk factor: evidence from investment," BIS Working Papers, no 695, January 2018). This channel, also known as the risk-taking channel of the exchange rate, operates in the opposite direction from the textbook trade channel, which emphasises trade competitiveness resulting from currency movements. The relevance of the US dollar in influencing financial conditions globally has been documented, using the broad dollar index, in S Avdjiev, W Du, C Koch and H S Shin, "The dollar, bank leverage and the deviation from covered interest parity", BIS Working Papers, no 592, July 2017; S Avdjiev, C Koch and H S Shin, "Exchange rates and the transmission of global liquidity", unpublished mimeo, March 2018; and also, using bilateral exchange rates, in V Bruno and H S Shin, "Cross-border banking and global liquidity", Review of Economic Studies, vol 82, no 2, April 2015; V Bruno and H S Shin, "Capital flows and the risk-taking channel of monetary policy", Journal of Monetary Economics, vol 71, April 2015; and B Hofmann, I Shim and H S Shin, "Sovereign yields and the risk-taking channel of currency appreciation", BIS Working Papers, no 538, May 2017.
19 There is some evidence that expectations have become somewhat de-anchored in the aftermath of the GFC in some countries, especially in the euro area (eg T Lyziak and M Paloviita, "Anchoring of inflation expectations in the euro area: recent evidence based on survey data", European Journal of Political Economy, vol 46, 2017; F Natoli and L Sigalotti, "Tail co-movement in inflation expectations as an indicator of anchoring", International Journal of Central Banking, January 2018); and more generally when inflation is significantly below target or when interest rates are close to the zero lower bound (eg R Banerjee and A Mehrotra, "Deflation expectations", BIS Working Papers, no 699, February 2018). Other studies, however, find no evidence of de-anchoring in most countries (eg O Blanchard, "The US Phillips curve: back to the '60s?", Peterson Institute for International Economics Policy Briefs, no PB 16-1, January 2016). De-anchoring of expectations also creates the risk of a persistent overshoot should inflation pick up.
20 Shale oil production is more responsive to prices than that from other sources, as costs are much lower, wells can be opened and shut down much more rapidly, and the investment cycle is much shorter and less uncertain. Despite representing a small fraction of total oil production (6% in 2017), shale oil has accounted for over 60% of its cumulative increase since 2010.
21 See eg M Obstfeld, "Trilemmas and trade-offs: living with financial globalisation", BIS Working Papers, no 480, January 2015; B Hofmann and E Takáts, "International monetary spillovers", BIS Quarterly Review, September 2105, pp 105-18; and E Kharroubi and F Zampolli, "Monetary independence in a financially integrated world: what do measures of interest rate co-movement tell us?", BIS Papers, no 88, October 2016, pp 193-205.
22 For instance, the share of assets intermediated by other financial intermediaries (OFIs) has steadily increased, reaching about 30% of total financial system assets in 2016, mainly through collective investment vehicles and securitisation-based intermediation, which account for about 80% of the FSB's narrow measure of shadow banking.
23 Sentiment-driven swings in investment along with fluctuations in credit and financial conditions are timeless features of business cycles and can explain why economic activity may turn even in the absence of strong inflationary pressures (see eg V Zarnowitz, "Theory and history behind business cycles: are the 1990s the onset of a golden age?", Journal of Economic Perspectives, vol 13, no 2, 1999).
24 For example, IMF, World Economic Outlook: Adjusting to lower commodity prices, October 2015, considers a scenario in which a greater than anticipated slowing of potential output growth in EMEs is combined with smaller capital flows to EMEs and tighter financial conditions. After one year, growth is 0.8 percentage points lower than baseline in the BRICS and 0.4 points lower in advanced economies. Similarly, P Ollivaud, E Rusticelli and C Schwellnus, "Would a growth slowdown in emerging markets spill over to high-income countries? A quantitative assessment", OECD Economics Department Working Papers, no 1110, 2014, consider a scenario in which EMEs experience a 2 percentage point decline in domestic demand growth combined with a 10% fall in equity prices and a 20% currency depreciation (current account deficit countries). The same scenario also involves a 50 basis point increase in the equity risk premium in OECD economies, reflecting a negative confidence spillover due to tighter financial conditions in EMEs. As a result, growth declines by 1 percentage point in Japan and ⅔ percentage point in the United States and Germany, close to the average for OECD countries. These estimates may, however, understate the true effects, especially at times of heightened financial market volatility. Existing structural and empirical models may not fully capture the (time-varying and non-linear) power of financial factors.
25 In addition, over time, the continuation of the expansion, especially if supported by low interest rates and growing financial imbalances, may also be accompanied by worsening imbalances in the real sector (see also Box I.A). Of particular note is the risk of sectoral resource misallocations: see eg C Borio, E Kharroubi, C Upper and F Zampolli, "Labour reallocation and productivity dynamics: financial causes, real consequences", BIS Working Papers, no 534, January 2016.
26 See C Borio, M Lombardi and F Zampolli, "Fiscal sustainability and the financial cycle", in L Ódor (ed), Rethinking fiscal policy after the crisis, Cambridge University Press, 2017, pp 384-413.
27 Empirical studies have documented the potential negative impact of public debt on future average growth, albeit not conclusively (for an overview, see eg "Is high public debt a drag on growth?", in BIS, 83rd Annual Report, June 2013), and the amplifying effects of high public debt following a financial crisis (see eg O Jorda, M Schularick and A Taylor, "Sovereigns versus banks: credit, crises, and consequences", Journal of the European Economic Association, vol 14, no 1, February 2016).