II. Monetary policy: a narrow normalisation path
Abstract
The incipient monetary policy normalisation in the major economies raises tough challenges, exemplified by continued loose financial conditions. Normalising too slowly could give rise to overheating and financial stability risks, while moving too fast could trigger disruptive market reactions and harm the economic recovery. Treading the narrow normalisation path will require sound judgment and pragmatism.
Full text
After the long period of ample and unconventional monetary accommodation that helped economies recover from the Great Financial Crisis (GFC), the incipient policy normalisation in the major advanced economies stands out in important respects. It involves normalising both policy rates and balance sheets; it is highly asynchronous, with the Federal Reserve raising policy rates while the ECB and the Bank of Japan continue with large-scale asset purchases and negative rates; and it takes place against a macro-financial landscape still marked by the preceding era of historically low interest rates. As a result, central banks face tough challenges ahead.
As an example of the special challenges confronting central banks, domestic and global financial conditions have not tightened for most of the period since the United States started to normalise its monetary policy. While conditions would probably have been even easier had the authorities not acted, the development nonetheless raises questions about policy transmission. Several factors may have been at work. The improved economic outlook and short-term fiscal stimulus may have boosted asset prices. Continued asset purchases by other major central banks may have partly offset the effects of US policy normalisation. And the gradual and predictable nature of this normalisation may itself have played a role. Only well into the second quarter of 2018 were there signs that a significant change could be in the offing, especially for emerging market economies (EMEs).
This highlights the delicate balance central banks must strike. On the one hand, moving too slowly could give rise to overheating and financial stability risks. On the other hand, moving too fast could trigger disruptive market reactions and harm the economic recovery, not least as global debt levels relative to GDP have continued to increase and financial market valuations appear stretched. The task is further complicated by uncertainties about the strength of transmission, the macroeconomic backdrop, the level of "equilibrium" interest rates, the impact of adjustments in central bank balance sheets and, above all, the limited room for manoeuvre to address any future economic downturn.
After taking stock of the global monetary policy landscape, this chapter homes in on the experience of the central bank that is furthest along the normalisation path - the Federal Reserve. It compares the current US policy tightening with previous ones, documenting its special character. The chapter closes with a discussion of the key policy challenges faced by central banks.
Monetary policy normalisation: where do we stand?
Monetary policy normalisation in the major advanced economies made uneven progress in the period under review, reflecting different states of recovery from the GFC. In the United States, policy rate normalisation gathered pace with three additional hikes of the federal funds target range, yielding an increase in the effective federal funds rate of about 80 basis points between June 2017 and May 2018 to 1.7% (Graph II.1, left-hand panel). Despite this, as of April 2018 the rate was still negative in inflation-adjusted (real) terms (centre panel). At the time of writing, the Federal Open Market Committee (FOMC) expected that economic conditions would warrant further gradual increases, so that the rate would be likely to remain below its expected longer-run level for some time. The expected pace of policy rate normalisation quickened in the second half of 2017 against the backdrop of strengthening labour market conditions, but remained very gradual. As of late May 2018, forward curves implied a federal funds rate at 2.6% by end-2020, while the FOMC participants' March projections were somewhat higher, at 3.4% (median projection). Thus, the real federal funds rate was expected to rise gradually to only 0.5-1.3% by 2020. In October 2017, the Federal Reserve also began to unwind its asset holdings by capping reinvestments. Thus, its balance sheet also shrank in absolute terms, after having declined relative to GDP since 2014 (right-hand panel).
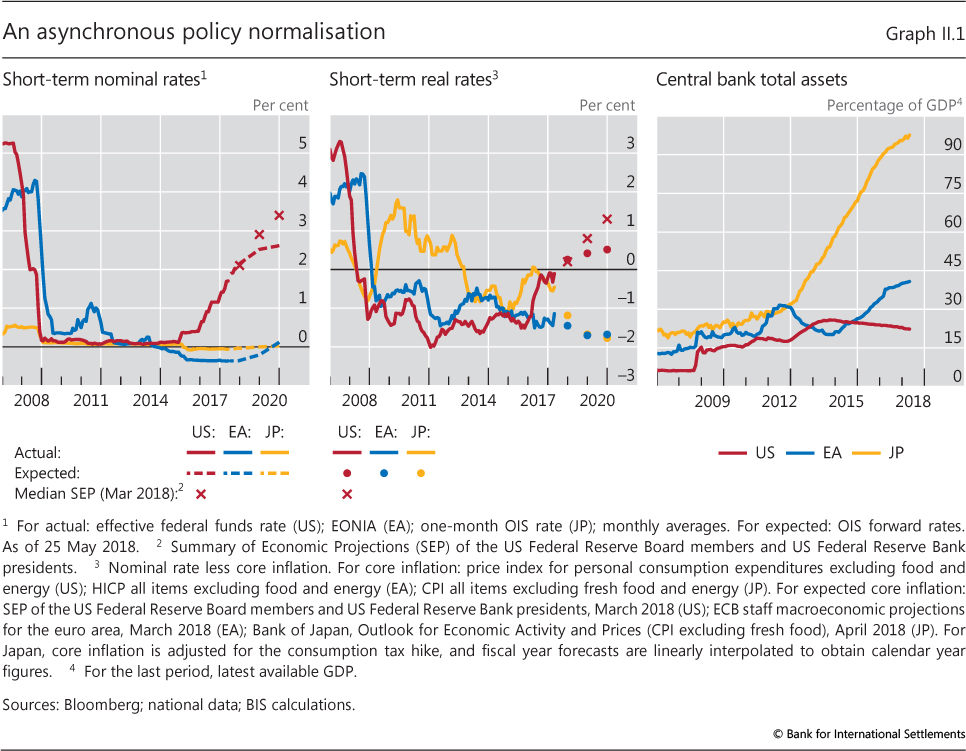
By contrast, central banks in the euro area and Japan continued their large-scale asset purchases and their negative rate policies. The ECB took a further step towards normalisation by halving its monthly net asset purchases to €30 billion from January, but reiterated its commitment to keep rates at prevailing levels well past the end of the purchases, which would proceed at least until end-September this year. The Bank of Japan continued its Quantitative and Qualitative Easing with Yield Curve Control programme. The two major components of the programme are yield curve control, consisting of a negative short-term policy interest rate and a near 0% target for 10-year Japanese government bond yields, and a commitment to overshoot the 2% inflation target. In April this year, the Bank of Japan clarified that monetary policy would not be tied to a specific time frame for meeting the inflation target.
As of late May 2018, euro area and Japanese short-term interest rates were expected to rise only gradually, if at all, in the years ahead. In the euro area, market-implied short-term rates rose above zero only from 2020; in Japan, there is little sign of a meaningful increase any time soon (Graph II.1, left-hand panel). Thus, in real terms, money market rates were negative in both economies during the past year and, at the time of writing, were not expected to enter positive territory in the foreseeable future (centre panel). At the same time, the ECB's and the Bank of Japan's balance sheets expanded further, albeit at a slowing pace. By April 2018, assets at the ECB and the Bank of Japan stood at more than 40% and close to 100% of GDP, respectively (right-hand panel). Reflecting the mix of negative interest rate policies and large-scale asset purchases, respectively about 40% and more than 50% of euro area and Japanese government bonds traded at negative yields in late May 2018.
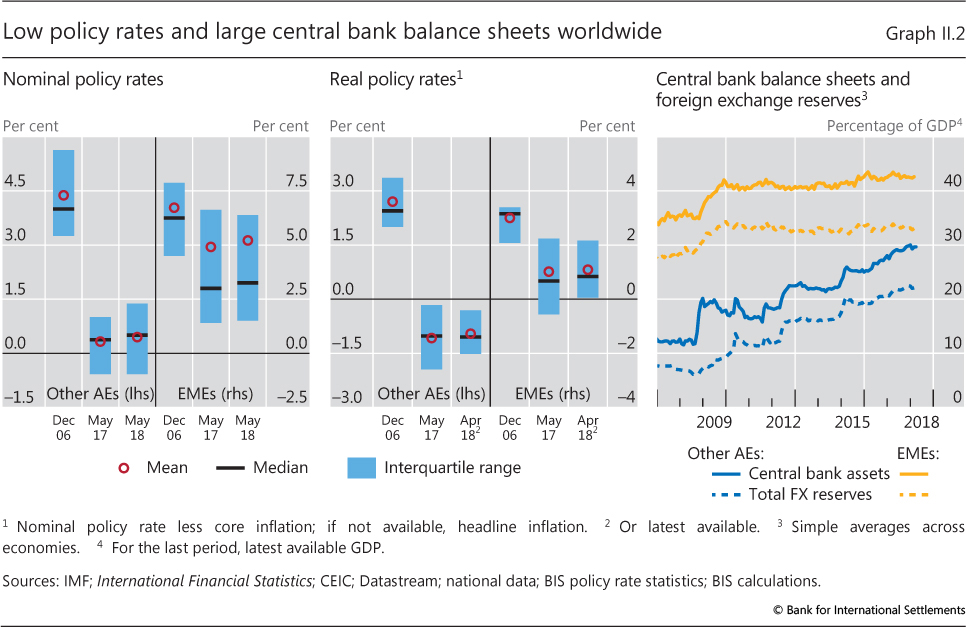
In most other advanced economies, policy rates changed little during the year, remaining well below pre-crisis levels (Graph II.2, left-hand panel). Most held their policy rates constant and maintained an accommodative policy stance as inflation remained low, including Australia, New Zealand and Norway; in the case of Denmark, Sweden and Switzerland, rates were kept negative. On the other hand, Canada raised its policy rate by 75 basis points from mid-2017, while the United Kingdom increased its base rate in November 2017 back to its pre-Brexit vote level. In real terms, policy rates in the other advanced economies remained negative across the board (centre panel). Central banks' balance sheets in those economies changed little and stood at 30% of GDP on average in April 2018 (right-hand panel).
In EMEs, policy rates also barely changed on balance in the period under review (Graph II.2, left-hand panel). The People's Bank of China continued to signal a neutral monetary policy stance and kept its key lending and deposit rates unchanged. The Reserve Bank of India too aimed at a neutral stance of monetary policy, with a 25 basis point cut in policy rates in August last year and subsequently unchanged rates through May 2018. In some cases, subdued inflation has led to more significant rate cuts as central banks extended policy accommodation (Brazil and South Africa) or sped up a transition to a neutral policy stance (Russia). Mexico tightened its policy rate to curb inflation risk as its currency depreciated, petrol prices were liberalised, and uncertainty rose about its trade relations with the United States. In real terms, EME policy rates stayed on average slightly above zero (centre panel). Central bank balance sheets remained stable vis-à-vis GDP, standing on average above 40% in April 2018 and reflecting mainly large FX reserve holdings.
Starting in April 2018, some countries came under pressure as their currencies depreciated and capital flows reversed. While largely triggered by idiosyncratic developments, this also reflected a broader change in investor sentiment, linked to an appreciating US dollar and rising US interest rates (Chapter I). In particular, Argentina hiked its main interest rate by a total of 12.75 percentage points in April and May, to 40%. Also in May, Turkey raised its late liquidity window rate by 3 percentage points, to 16.5%, to stem outflows. Both countries stepped up foreign exchange intervention, and Argentina applied for an IMF programme. Indonesia raised interest rates twice in May, totalling 50 basis points and reversing the rate cuts of the third quarter of 2017, to stabilise the exchange rate.
The current backdrop for monetary policy normalisation is unprecedented in a number of important respects. Historically, interest rates in advanced economies, real and nominal, have never stayed this low for this long and central bank balance sheets have never swelled as large in peacetime. The long spell of multi-pronged policy accommodation may have left lasting marks on the macro-financial landscape, making policy effects harder to assess. Meanwhile, a broad-based economic recovery, with several countries close to or even beyond standard measures of full employment, coincides with subdued inflation in many jurisdictions (Chapter I). And debt levels in relation to GDP stand near historical highs.
Monetary and financial conditions: imperfect transmission?
One notable development that may be partly linked to this unprecedented picture concerns the relationship between monetary policy and financial conditions. A tightening of monetary policy would normally coincide with a tightening of financial conditions. Short- and long-term capital market rates would be expected to rise, risk spreads to widen, asset price increases to at least slow down and the domestic currency to appreciate whenever interest rate differentials widened. A tightening in major economies would further be expected to be propagated globally, working through investor portfolio decisions and changes in risk-taking. Insofar as financial conditions are a key transmission channel for monetary policy, any weak link raises questions about the effectiveness of policy measures. And these conditions may also complicate policy by raising the risk of undesirable market disruptions further down the road if they induce or reflect higher risk-taking (Chapter I).
In fact, until at least the first quarter of 2018, no tightening of financial conditions accompanied the normalisation of US monetary policy; it was only well into the second quarter that any appreciable tightening was seen, particularly in EMEs (see also Chapter I). From December 2015, when the United States started tightening, until late May of this year, two-year US Treasury yields rose in line with higher policy rates, by more than 150 basis points (Graph II.3). But the yield on the 10-year Treasury note increased by only around 70 basis points, while very long-term yields traded sideways. Importantly, the S&P 500 surged by over 30%, and corporate credit spreads narrowed, in the high-yield segment by more than 250 basis points. The Federal Reserve Bank of Chicago's National Financial Conditions Index (NFCI) trended down to a 24-year trough last year before rebounding slightly this year, in line with several other financial condition gauges. The dollar appreciated slightly, but this reflected mainly a reversal from late April that undid its previous depreciation. This reversal went hand in hand with a significant tightening in EME financial conditions (Chapter I). That said, by late May, EME local currency bond spreads were still 90 basis points below their end-November 2015 levels, and cumulative net flows into EME portfolio funds over this period amounted to more than $200 billion.
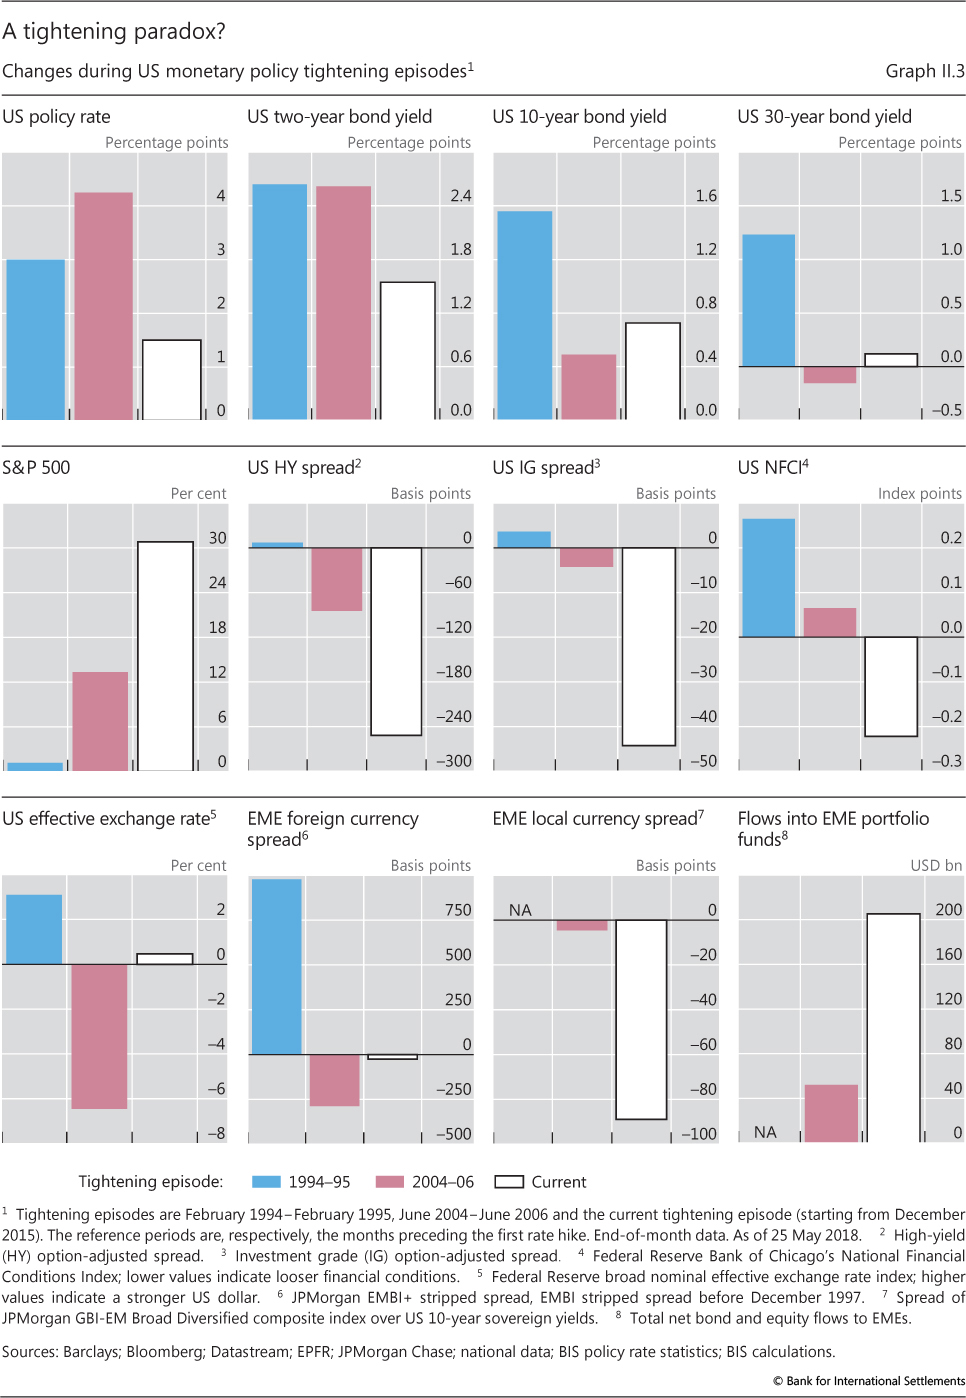
Qualitatively, the current tightening cycle has some similarities with its counterpart in the mid-2000s. At that time, policy rate hikes of more than 400 basis points coincided with only marginal increases (or even declines) in long-term government bond yields - Federal Reserve Chairman Alan Greenspan's famous "conundrum". Stock markets also rose and US credit spreads narrowed, albeit by less than during the current tightening. The NFCI did at least register a small increase back then. Also, the US dollar fell by more than 6%, while EME spreads narrowed and portfolio flows rose.
These two episodes contrast markedly with the tightening of 1994-95, when the Fed's actions triggered sharply higher long-term yields, somewhat wider US credit spreads and a tightening of overall US financial conditions, as captured by the NFCI index. Back then, the dollar appreciated, and EME spreads widened significantly on the back of large EME currency depreciations.
There are several possible reasons for monetary policy's limited impact on financial conditions. These include factors unrelated to the policy itself, large and growing central bank balance sheets outside the United States, and possibly the gradual and predictable nature of the normalisation. Consider each in turn.
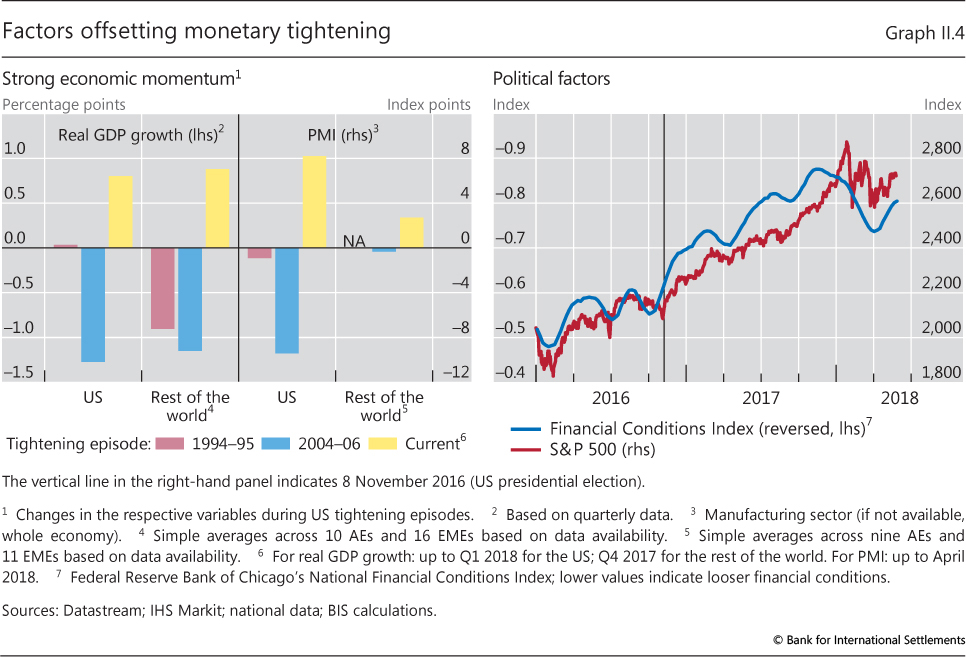
The improved macroeconomic backdrop and outlook, potentially further boosted in the near term by the prospect of fiscal expansion, could have counteracted the effects of monetary policy tightening. Both in the United States and globally, the growth outlook has strengthened considerably over the past year, while inflation has remained subdued. In particular, during the current tightening cycle, economic momentum, reflected in the change in real GDP growth and in business sentiment, increased both in the United States and globally, while it tended to slow during previous tightening episodes (Graph II.4, left-hand panel). Stronger growth has probably translated into lower perceived default risk and higher expected dividends, at least in the near term. This could have reduced credit spreads and boosted asset prices. In addition, political factors could have boosted financial market sentiment. Specifically, the outcome of the US presidential election in November 2016 may have buoyed expectations for business- and growth-friendly policies, thereby raising projected corporate profits and hence asset prices. Indeed, the election ushered in a steep increase in stock prices and an easing of broader financial conditions (right-hand panel).
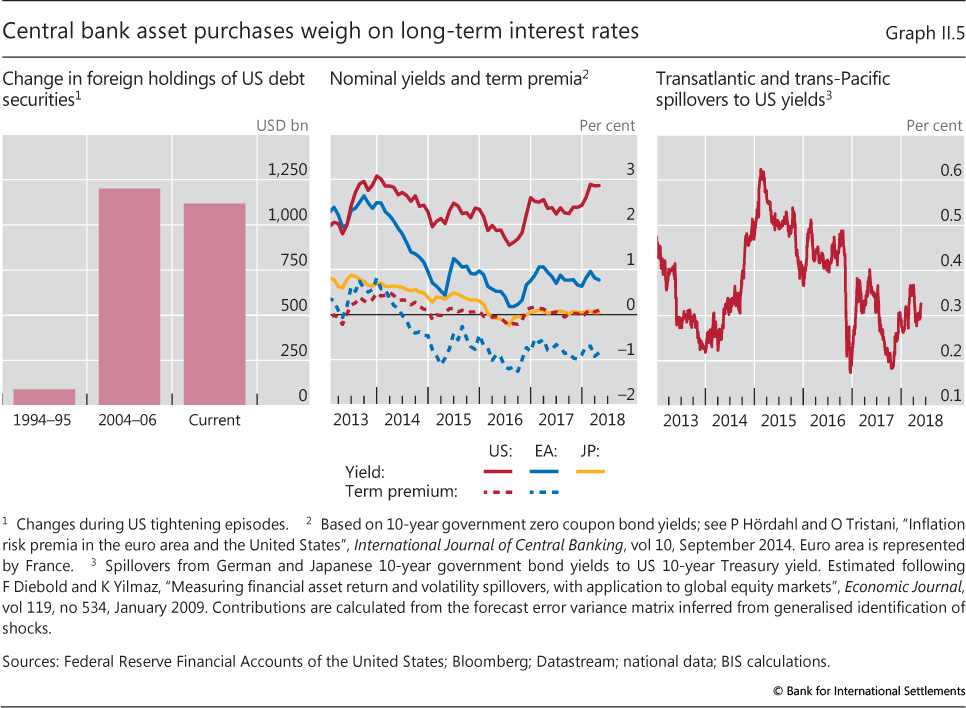
The large-scale asset purchase programmes of the major central banks outside the United States may have offset the impact of the Fed's monetary policy normalisation. While the reduction in the Fed's balance sheet would be expected to raise the US term premium, continued large-scale asset purchases in Europe and Japan may have spilled over across borders and compressed it, as investors turned to higher-yielding US securities. Indeed, foreign holdings of US debt securities have increased as significantly during the current tightening as they did during the 2004 conundrum episode (Graph II.5, left-hand panel). By contrast, in 1994, foreign holdings barely rose.
The co-movements of US, euro area and Japanese bond yields, and of their term premia, support this notion (centre panel). Indeed, time variation in transatlantic and trans-Pacific interest rate spillovers can be linked to major changes in monetary policy (right-hand panel). Between 2014 and 2016, when the ECB and the Bank of Japan, respectively, launched and expanded their asset purchase programmes and introduced negative policy rates, movements in German and Japanese government bond yields explained about 40% of those in Treasury yields. Spillovers weakened in late 2016 but have risen again since late 2017.
Finally, the gradualism and predictability of the tightening may also have played a role. Gradualism is especially called for when there is high uncertainty about the economic context and monetary transmission, as currently.1 In such a situation, this can help avoid undesirable financial and economic responses. Yet a high degree of gradualism and predictability may also dilute the impact of policy tightening. More gradual hiking paths correspond to a flatter trajectory of expected future short rates while a high degree of predictability implies low uncertainty about that trajectory, reducing risk premia. Through these effects, gradualism and predictability could induce search-for-yield and risk-taking behaviour, further compressing risk premia and boosting asset prices.2 Moreover, market participants could interpret gradualism and predictability as signalling that central banks wish to prevent sharp market moves, thereby providing implicit insurance for risky position-taking.3
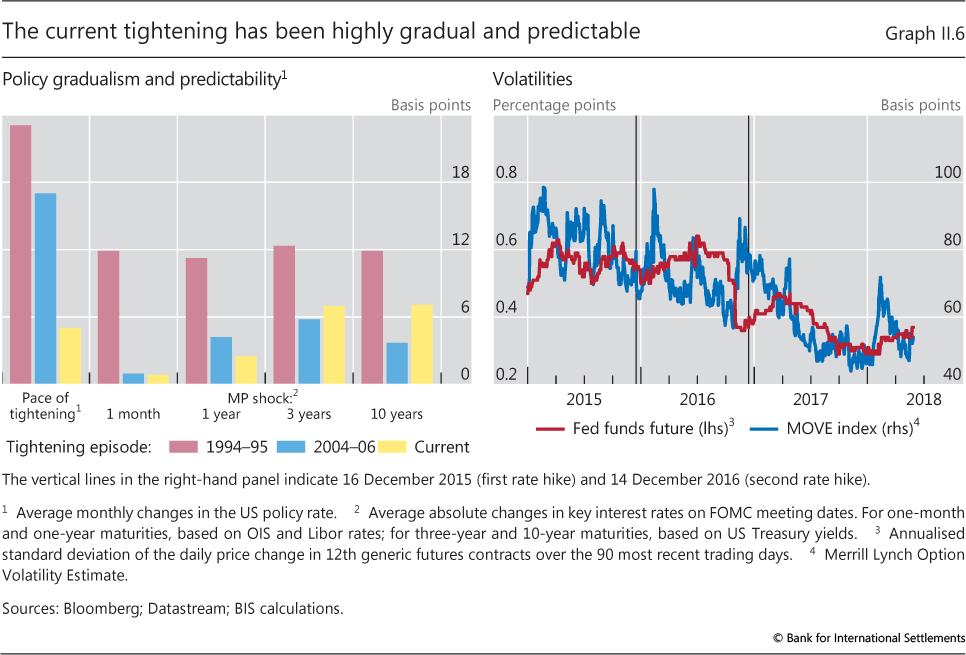
Since December 2015, the Federal Reserve has been normalising its monetary policy very gradually and predictably. The average monthly pace of policy rate increases was just 5 basis points as of late May 2018, compared with a respective 20-plus and 15-plus basis points during the tightenings of the mid-1990s and mid-2000s (Graph II.6, left-hand panel). At the same time, the surprise element of policy rate changes was generally small. Short-term market interest rates changed on decision days by less than 2 basis points on average, similar to the impact of rate hikes in 2004, but much less than in 1994 when surprises tended to exceed 10 basis points. The surprise in medium- and long-term Treasury yields was somewhat higher than in the 2000s, possibly because of greater reliance on forward guidance and the additional effect coming from balance sheet normalisation, but still only around one half of that during the mid-1990s (left-hand panel). Similarly, the reduction in the Federal Reserve's asset holdings has followed a preannounced schedule with moderate reinvestment caps. Consistently with this overall picture, the volatility of policy rate futures and implied bond market volatility have eased since the beginning of policy rate normalisation (right-hand panel).
Policy challenges
The weak effect of monetary policy tightening on financial conditions is just one example of the challenges central banks face in the normalisation process. Given the unprecedented starting conditions and the large array of instruments in use, there is considerable uncertainty surrounding the transmission mechanism and policy benchmarks.
Take the impact of interest rate changes. On the one hand, there is evidence that the link between short rates and long rates has weakened over yearly horizons since the early 2000s.4 This suggests that monetary policy may have to act more strongly to achieve a given effect. On the other hand, there is also evidence that long-term interest rates have become more sensitive to monetary policy surprises at higher frequencies (daily and intradaily) over the same period.5 This points to the risk of a snapback in long-term rates should policy be tightened more than expected.
Similar questions concern the impact of balance sheet normalisation on long-term rates. Estimates are very imprecise and vary widely. For example, a Federal Reserve study found that the announced balance sheet run-off plan would increase the 10-year Treasury term premium by around 15 basis points in the year 2018, but with a statistical uncertainty range around the level of the term premium of as much as 70 basis points.6
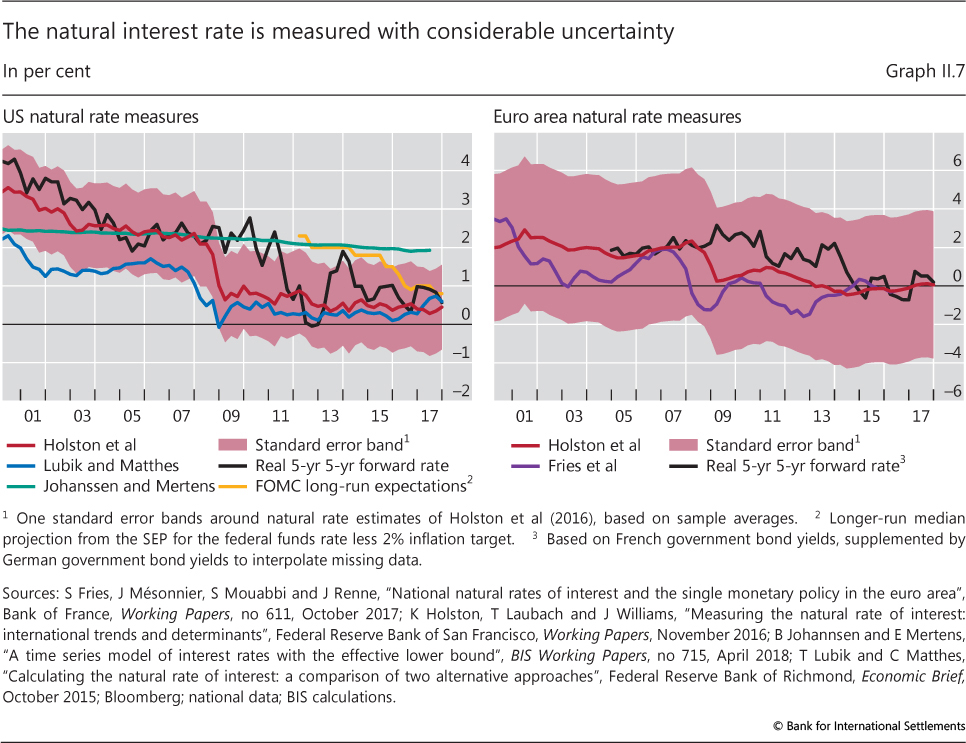
Questions also relate to the end-point for interest rates - sometimes referred to as the natural or equilibrium rate. This is conventionally defined as the real interest rate consistent with output at potential and inflation at target. Most estimates point to a notable decline in the natural rate over the past few decades, with a further drop post-crisis, but the ranges are very wide (Graph II.7). This decline has been linked to real developments that reduce investment and raise saving, such as demographic shifts and slowing potential growth. At the same time, while this notion draws strength from studies that focus on the past three decades, some recent work based on longer historical data finds less support for this hypothesis, including by pointing to a role for monetary policy (Box II.A).
Against this backdrop, central banks must strike a delicate balance in determining the timing and pace of any normalisation.
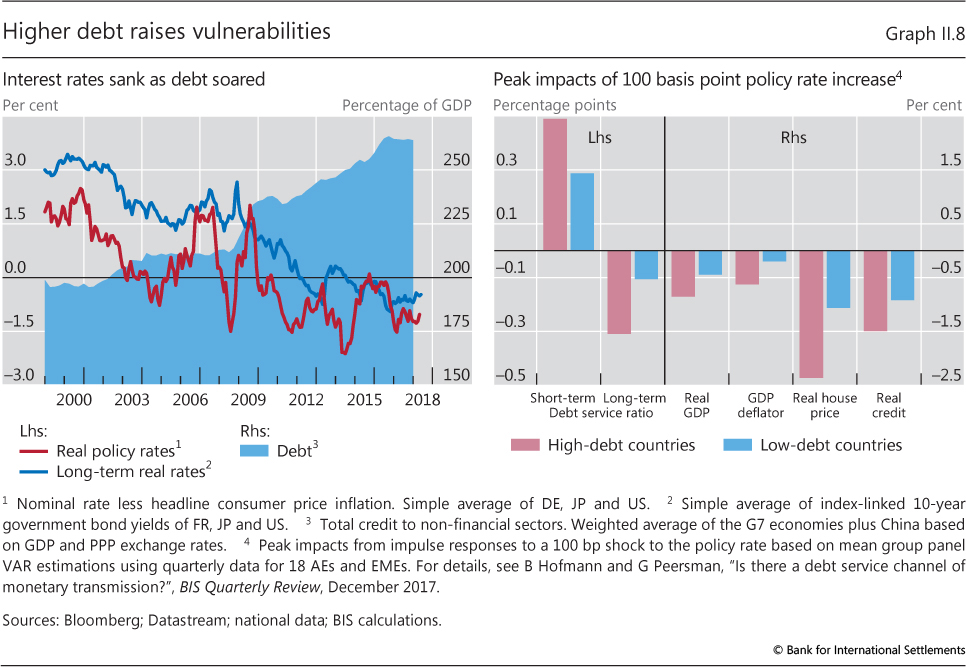
On the one hand, there is a risk of moving too early and too rapidly. The upswing may prove fragile, given the uncertainty over how financial markets and the economy might respond after the long period of ultra-low rates. Too fast an increase in interest rates may trigger an abrupt repricing in financial markets if it prompts an outsize revision in the expected level of risk-free interest rates or a decompression in risk premia. Such a snapback could be amplified by market dynamics (Chapter III) and possibly have adverse macroeconomic consequences (Chapter I and below). It could compromise the economic recovery or spill across borders in the case of international funding currencies, with broader repercussions. A particular concern is that the macroeconomic impact of tighter monetary policy could turn out to be larger than in the past, since debt has continued to rise globally as interest rates have sagged (Graph II.8, left-hand panel). There is evidence that the impact of monetary policy on the economy is significantly larger when debt is high, reflecting in part a much higher short-term impact on debt service ratios (right-hand panel).7
Other considerations too would support a very patient strategy. By testing how far the expansion can be accommodated, central banks may partly reverse some of the crisis-induced loss in production potential.8 This could entice discouraged workers back into the labour force and boost investment and productivity. Such a strategy would also allow central banks to test the true extent of slack in the economy, premised on the view that inflation reliably signals excess capacity. Indeed, it is common practice to adjust measures of full employment and potential output according to the behaviour of inflation, raising them if inflation fails to increase. Moreover, as long as inflation is not very responsive to demand and expectations remain well anchored - a flattening of the Phillips curve - the risk of a significant overshoot would be low, allowing the central bank to remain patient. Indeed, concerns with a de-anchoring of expectations and the associated loss of credibility have been a key motive for central banks' efforts to push inflation towards target and prevent deflation.
On the other hand, running a high-pressure economy raises risks too. The possibility of a stronger than expected rise in inflation cannot be ruled out (Chapter I). And given the hypersensitivity of overstretched financial markets, any disproportionate reaction could potentially damage the economy. The sharp stock market correction in response to slightly higher than expected wage increases in the United States underlines this risk. In fact, postponing and/or slowing down normalisation could further encourage risk-taking, paradoxically amplifying the likelihood of such a market response. Moreover, one might conjecture that a central bank risks a larger loss of credibility from overshooting the inflation target than from undershooting it. After all, inflation targeting was adopted to fight high inflation, and political economy pressures generally tend to push for an easing bias.
Even if inflation does not loom, risk would not disappear. Since the mid-1980s, unsustainable economic expansions appear to have manifested themselves mainly in the shape of unsustainable increases in debt and asset prices (Chapter I).9 Thus, even in the absence of any near-term market disruptions, keeping interest rates too low for too long could raise financial and macroeconomic risks further down the road. In particular, there are reasons to believe that the downward trend in real rates and the upward trend in debt over the past two decades are related and even mutually reinforcing. True, lower equilibrium interest rates may have increased the sustainable level of debt. But, by reducing the cost of credit, they also actively encourage debt accumulation. In turn, high debt levels make it harder to raise interest rates, as asset markets and the economy become more interest rate-sensitive - a kind of "debt trap" (Graph II.8, right-hand panel).10
A further complication in calibrating normalisation relates to the need to build policy buffers for the next downturn. Indeed, the room for policy manoeuvre is much narrower than it was before the crisis: policy rates are substantially lower and balance sheets much larger. While some central banks have shown that interest rates can be lowered below zero, this is probably possible only to a limited extent. And while central banks have field-tested unconventional tools in the wake of the crisis, their side effects set limits on how far they can be used. Hence, all else equal, if room for manoeuvre is valuable, it would make sense to adjust the normalisation trajectory to expand it. How far this is the case depends on the perceived likelihood of a downturn occurring before normalisation is complete, on the perceived impact of low rates on debt accumulation and on the perceived costs of raising rates.
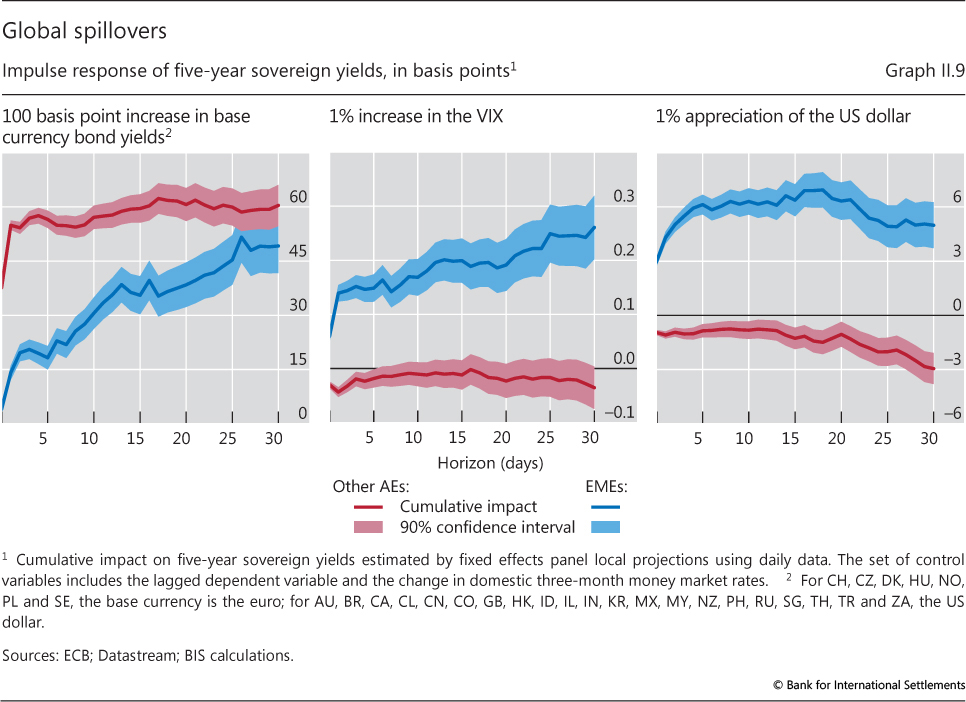
The policy normalisation of major central banks will also affect EMEs and other advanced economies through spillovers. Specifically, as a result of global investor arbitrage, there is a strong positive link between government bond yields in the core advanced economies and those in EMEs and other advanced economies (Graph II.9, left-hand panel). An increase in the VIX, a gauge of investor risk appetite, precedes a significant increase in EME yields and a slight decrease in yields in other advanced economies, probably reflecting safe haven flows (centre panel). More importantly, US dollar appreciation, working through foreign currency borrowing and global investor balance sheets, coincides with portfolio outflows from EMEs, pushing up bond yields there. Together with lower bond yields in the other advanced economies, this probably again reflects a flight to safety (right-hand panel).11
All this amplifies changes in financial conditions globally. During phases in which interest rates remain low in the main international funding currencies, especially the US dollar, EMEs in particular tend to benefit from easy financial conditions. These effects then play out in reverse once interest rates rise. A reversal could occur, for instance, if bond yields snapped back in core advanced economies, and especially if this went hand in hand with a rise in stock market volatility and a US dollar appreciation, as EME borrowers sought to hedge their positions and capital inflows turned into outflows. A clear case in point is the change in financial conditions experienced by EMEs since the US dollar started appreciating in the first quarter of 2018.
Such spillovers have posed a major challenge for central banks in EMEs and other advanced economies in the past, and will continue to do so in the future. On the one hand, a further prolongation of easy global financial conditions would worsen the policy trade-offs for economies that face concerns about appreciating currencies and the build-up of domestic financial imbalances. In small open advanced economies that do not rely on foreign currency borrowing and where inflation is already below target, any easing of domestic monetary policy to prevent excessive domestic currency appreciation would tend to encourage the further build-up of financial imbalances. For instance, in Switzerland interest rates have been negative and inflation very subdued for quite some time while a boom in the mortgage market has been raising concerns among the authorities. In EMEs that rely heavily on foreign currency debt, the room for policy manoeuvre is even narrower. This is because financial conditions in that debt segment depend directly on the monetary policy of the country issuing the currency of denomination. In addition, if inflation is above target or the build-up of domestic financial imbalances is a concern, tightening monetary policy is less effective. The tightening promotes a currency appreciation which, by reducing the foreign currency debt burden, can further ease domestic financial conditions. Borrowers are induced to borrow more and lenders to lend more, given the borrowers' apparent gain in creditworthiness.
To address these trade-offs, the authorities can usefully broaden the set of instruments deployed - an increasingly common strategy. Macroprudential measures can address emerging vulnerabilities in a targeted manner. While extremely useful, the evidence indicates that such measures are more effective in strengthening the resilience of the financial system than in preventing the build-up of financial imbalances themselves (Chapter IV). Similarly, FX intervention can offset some of the undesirable appreciation of the currency while building up a buffer that could be drawn down when conditions go into reverse.
When conditions do go into reverse, policy trade-offs become especially difficult, particularly in EMEs. Even if such a reversal is needed to limit the further build-up of financial imbalances, it could expose financial vulnerabilities in some countries, especially if it plays out in an abrupt and disorderly fashion. This could lead to powerful contractionary pressures alongside currency depreciation and hence, at least in the short run, to higher inflation. Scope for easing monetary conditions would be severely constrained; in fact, policy has often had to be tightened to prevent an uncontrolled depreciation. While FX reserves can be drawn down, experience indicates that their deployability may be smaller than their size may suggest, as markets can become nervous once the buffer shrinks. And the evidence suggests that macroprudential tools are more effective in building up buffers than in cushioning financial busts (Chapter IV).
Global spillovers can also have implications for the core countries at their origin. The collective size of the countries exposed to the spillovers suggests that what happens there could also have significant financial and macroeconomic effects in the economies that originated the spillovers. At a minimum, such spillbacks argue for enlightened self-interest in the core economies, consistent with domestic mandates.12 This is an additional policy dimension that complicates the calibration of the normalisation and which deserves close attention.
To conclude, the normalisation path is a narrow one. Treading it will require a lot of judgment to evaluate trade-offs as well as a dose of pragmatism in adjusting to changing conditions. It will also call for flexibility in pursuing inflation objectives. In particular, since unsustainable expansions may manifest themselves in growing financial imbalances rather than rising inflation, and since accumulated debt may greatly constrain future room for manoeuvre, debt and asset price dynamics require close monitoring and should be factored into policy decisions. The same applies to the need to regain policy room for manoeuvre, which has narrowed significantly since the GFC. Given the starting conditions, this journey is bound to be bumpy. Financial market ructions will no doubt occur, in the manner of withdrawal symptoms. But as long as financial market disturbances remain contained, central banks should have no reason to adjust the normalisation pace. Volatility as such is not a problem. In fact, to the extent that it inhibits unbridled risk-taking, it is healthy and part of the solution. The challenge will be to normalise with a steady hand, without overreacting to any transient bouts of volatility.
Box II.A
The decline in natural real interest rates: what do we know?
The global decline in real interest rates in recent decades is often attributed to a lower level of natural real interest rates, defined as the level that equates desired real saving to investment at full employment. Several factors may have lowered investment and raised saving over the past few decades, pushing down natural (or equilibrium) real interest rates. On the investment side, the most prominent candidates are lower productivity and potential growth, which may reduce the marginal returns to capital and hence investment. The decline in the relative price of capital (eg computers), which lowers the required investment outlay, is another potential factor. On the saving side, demographic developments have been highlighted as prompting increased saving, in particular a rising share of the working age population and increased life expectancy. As life-cycle theory posits, a lower dependency ratio results in increased saving as the working population tends to save more than retirees. Similarly, greater longevity prompts increased saving for a longer expected retirement. Greater income inequality also tends to increase aggregate saving as higher-income households have a higher propensity to save. Lastly, greater demand for safe assets and higher risk aversion could lead to lower real risk-free interest rates. Possible reasons include the limited global supply of safe securities, which has not kept pace with the increased saving demand, including from EMEs, and greater concerns about macroeconomic tail risks more generally.
The pattern seen over the last few decades lends some support to the relevance of these saving-investment factors. Even a cursory look at the data suggests that saving-investment factors and the real interest rate share some common trends. For example, the drop in real rates over the last 30 years has coincided with a decline in dependency ratios and in productivity growth. In addition, life expectancy has moved up, inequality has increased, and the relative price of capital has fallen, as the hypothesis would postulate. Pairwise correlation between real interest rates and these variables is therefore high and consistent with theory over this period (Graph II.A, left-hand panel). Recent research also shows that structural models can explain much of the observed decline in real rates. For example, studies that emphasise demographics typically use overlapping-generation models to capture the joint dynamics between the dependency ratio, life expectancy and population growth. These studies find that demographics may have lowered real interest rates by between 1 and several percentage points over the past few decades. Rachel and Smith (2017) use pre-existing elasticity estimates and find that potential growth, demographics, the risk premium and the relative price of capital are the most important factors, together explaining a 3 percentage point fall in real interest rates since the 1980s.
Another supporting piece of evidence is the fact that inflation has not increased despite the downward trend in real interest rates. Assuming a stable Phillips curve, a sustained gap between the real interest rate and its natural counterpart should exert pressure on aggregate demand, ultimately influencing the inflation dynamics. Relatively stable inflation suggests that real interest rates have merely tracked the natural rates downwards. Indeed, most "filtered" estimates of the natural rate have relied on the Phillips curve for identification, with most pointing to its steady decline over the last 30 years (Graph II.7).
While the consensus is that the natural interest rate may have recently declined, there are also reasons to be more circumspect, at least in practical policymaking. The filtering-based estimates are associated with a notoriously large degree of statistical uncertainty, not least because the empirical link between inflation and economic slack has not always been tight (Graph II.7). Additional challenges arise when allowing for possible non-linearity of the Phillips curve and structural change in the inflation process. Meanwhile, the structural approach, which focuses on articulating few specific mechanisms at a time, by construction leaves little room for empirically evaluating different hypotheses. This in turn makes it harder to assess the outlook for the natural rate, as the future evolution for saving-investment factors may diverge. Ongoing population ageing could finally reverse the demographic effects and potential growth could trend higher, while inequality and the shortage of safe assets may be more persistent forces.
There is also a risk that too much emphasis has been placed on the experience over the last 30 years. The correlation between real interest rates and saving-investment factors either switches sign or becomes substantially weaker once one extends the sample to cover longer periods (Graph II.A, left-hand panel). Formal empirical studies using long data series corroborate this observation. Hamilton et al (2015) find that GDP growth, a key determinant of the natural rate in macro models, bears little relationship to real interest rates, while Lunsford and West (2017) consider a comprehensive set of factors in the United States, and find only one demographic variable to be correlated with real rates. Borio et al (2017) study a large set of factors for 19 advanced economies since the late 19th century, and allow these factors to jointly determine real interest rates across various specifications.
 They find that none of the saving-investment factors can consistently explain real interest rate movements. The finding survives various robustness tests and extensions, including a control for the risk premium.
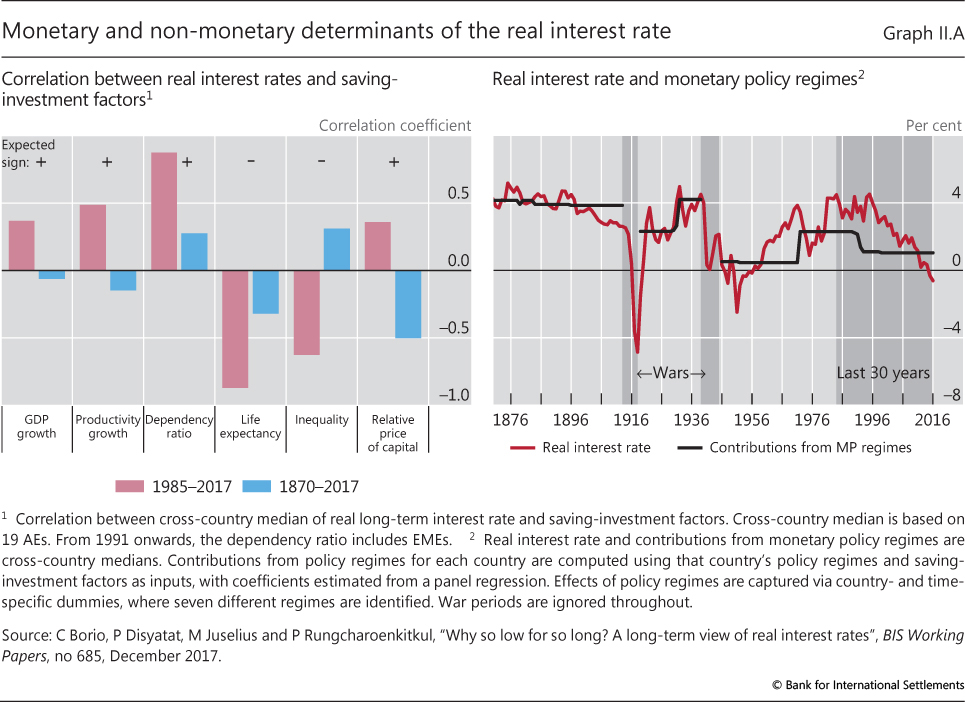
An alternative hypothesis is that monetary factors may have more persistent effects on real interest rates than usually assumed. There are several possible channels. Inflation expectations may be pinned down more successfully under certain policy regimes (eg over the last 30 years and during the gold standard), so that changes in the nominal interest rate are persistently transmitted to the real rate. There is earlier evidence that breaks in mean real interest rates coincide with those in inflation, suggesting a systematic role for monetary policy (Rapach and Wohar (2005)). Also, financial boom-bust cycles may in part be driven by monetary policy, leaving a long-lasting imprint on the real economy, including on real interest rates. Indeed, Borio et al (2017) find that shifts in monetary policy regimes matter for the levels of real interest rates, even after accounting for the influence of saving-investment variables. The right-hand-panel of Graph II.A shows the estimated impact of changes in monetary policy regimes on real interest rates. For example, the shift from post-Bretton Woods in the 1980s to the current policy regime of inflation targeting is associated with a 1.3 percentage point reduction in the real interest rate. Trends in real rates also appear to be affected by such regime changes. The persistent effect of monetary policy regimes on real rates raises deep questions about the real-only saving-investment framework, further highlighting the practical limitations of the natural interest rate in policymaking.
Equivalently, in a canonical macro model, it is defined as the level of the real interest rate that is neither expansionary nor contractionary for output. A distinction is sometimes made between short- and long-run natural interest rates. The short-run natural rate is influenced by transitory shocks, such as potential growth or productivity shocks; the long-run natural rate prevails once their effects wane. This rate is smoother, but may still vary over time owing to permanent shocks and structural breaks in economic relationships. For a detailed literature review and the references mentioned in this box, see Borio et al (2017) (for full reference, see source line of Graph II.A). L Rachel and T Smith, "Are low real interest rates here to stay?", International Journal of Central Banking, vol 13, issue 3, September 2017, pp 1-42. J Hamilton, E Harris, J Hatzius and K West, "The equilibrium real funds rate: past, present and future", IMF Economic Review, vol 64, issue 4, 2016, pp 660-707; K Lunsford and K West, "Some evidence on secular drivers of US safe real rates", Federal Reserve Bank of Cleveland, Working Papers, 17-23, 2017. For full reference, see source line of Graph II.A. Borio et al (2017) use higher moments of GDP growth and inflation as proxies for macroeconomic risk. D Rapach and M Wohar, "Regime changes in international real interest rates: are they a monetary phenomenon?", Journal of Money, Credit and Banking, vol 37, issue 5, 2005 pp 887-906.
Endnotes
1 Gradualism can be described as a policy approach where the central bank "tends to adjust interest rates incrementally, in a series of small or moderate steps in the same direction" (B Bernanke, "Gradualism", remarks at an economics luncheon co-sponsored by the Federal Reserve Bank of San Francisco and the University of Washington, Seattle, 20 May 2004). One rationale for gradualism is that a more cautious policy approach is called for when there is high uncertainty about how the economy responds to changes in the monetary policy stance; see W Brainard, "Uncertainty and the effectiveness of policy", American Economic Review, vol 57, 1967, pp 411-25; and B Sack, "Does the Fed act gradually? A VAR analysis", Journal of Monetary Economics, 2000, pp 229-56. Another rationale is that a commitment to act gradually could give the central bank more leverage over long-term interest rates; see M Woodford, "Optimal interest-rate smoothing", Review of Economic Studies, vol 70, 2003, pp 861-86.
2 See C Borio and H Zhu, "Capital regulation, risk-taking and monetary policy: a missing link in the transmission mechanism?", Journal of Financial Stability, December 2012, for a comprehensive discussion of the link between monetary policy and the perception and pricing of risk, ie the risk-taking channel of monetary policy. See T Adrian and H S Shin, "Financial intermediaries, financial stability and monetary policy", in Maintaining stability in a changing financial system, proceedings of the Federal Reserve Bank of Kansas City Jackson Hole Economic Symposium, August 2008, for the argument on predictability and gradualism being an enabling factor in the build-up of leverage before the GFC.
3 The consequence could be a "whisper equilibrium", where the central bank whispers more and more in order not to upset markets while market participants lean in to hear better and better. As markets react more, central banks' efforts to avoid stirring up the market are partially undone and the signalling value of financial market prices is impaired. See J Stein, "Challenges for monetary policy communication", speech at the Money Marketeers of New York University, 6 May 2014; and H S Shin, "Can central banks talk too much", speech at the ECB conference on Communications challenges for policy effectiveness, accountability and reputation, 14 November 2017, for more detailed discussions of the whisper equilibrium.
4 See S Hanson, D Lucca and J Wright, "Interest rate conundrums in the twenty-first century", Federal Reserve Bank of New York, Staff Reports, no 810, March 2017.
5 See Hanson et al (2017), op cit.
6 See B Bonis, J Ihrig and M Wei, "Projected evolution of the SOMA Portfolio and the 10-year Treasury term premium effect", Board of Governors of the Federal Reserve System, FEDS Notes, September 2017.
7 For a more detailed discussion and empirical analysis of the debt service channel of monetary transmission, see B Hofmann and G Peersman, "Is there a debt service channel of monetary transmission?", BIS Quarterly Review, December 2017, pp 23-37, and the references therein.
8 There is evidence for demand-driven recessions inducing long-lasting effects on output via hysteresis effects; see O Blanchard, E Cerutti and L Summers, "Inflation and activity - two explorations and their monetary policy implications", IMF Working Papers, WP/15/230, 2015; and R Martin, T Munyan and B Wilson, "Potential output and recessions: are we fooling ourselves?", Board of Governors of the Federal Reserve System, International Finance Discussion Papers, no 1145, 2015. The argument for running a high-pressure economy is premised on such a hysteresis effect working in reverse.
9 The concept of finance-neutral output gaps is one way of incorporating information about financial imbalances in gauging economic slack. These measures have been shown to outperform traditional output gap measures as real-time indicators of output sustainability, including in the run-up to the GFC. See BIS, 86th Annual Report, June 2016; and C Borio, P Disyatat and M Juselius, "Rethinking potential output: embedding information about the financial cycle", Oxford Economic Papers, vol 69, no 3, 2017, pp 655-77.
10 The debt trap refers to a situation in which the debt accumulation that coincides with accommodative monetary policy makes it progressively harder to raise rates. For a more detailed discussion of the notion of a debt trap and empirical evidence to that effect, see C Borio and P Disyatat, "Low interest rates and secular stagnation: is debt a missing link?", VOX, June 2014; and M Juselius, C Borio, P Disyatat and M Drehmann, "Monetary policy, the financial cycle, and ultra-low interest rates", International Journal of Central Banking, vol 13, no 3, 2017, pp 55-90.
11 For an overview of the mechanisms operating through banking flows and capital market financing, respectively, see V Bruno and H S Shin, "Global dollar credit and carry trades: a firm-level analysis", BIS Working Papers, no 510, August 2015; and B Hofmann, I Shim and H S Shin, "Sovereign yields and the risk-taking channel of currency appreciation", BIS Working Papers, no 538, January 2016, revised May 2017. See also BIS, 85th Annual Report, June 2015, Chapter V, for a discussion of global spillover effects.
12 See BIS (2015), op cit, for a discussion of the policy implications of global spillover effects.