Global financial markets: between uneasy calm and turbulence
Abstract
Financial markets experienced alternating phases of calm and turbulence in the past year, as prices in core asset markets remained keenly sensitive to monetary policy developments. Investors also closely followed growing signs of economic weakness in the main EMEs, especially China. Bond yields in advanced economies continued to fall, in many cases to historical lows, while the share of outstanding government bonds trading at negative yields reached new records. Low yields reflected low term premia as well as a downward shift in expected future short-term interest rates. Investors turned to riskier market segments in a search for yield, thereby supporting asset prices despite already high valuations. Unease about such valuations, coupled with concerns about the global outlook and about the effectiveness of monetary policy in supporting growth, resulted in recurring selloffs and bouts of volatility. Markets appeared vulnerable to a sharp reversal of high valuations. Some outsize bond price movements point to changes in market liquidity, but lower leverage should support more robust market liquidity under stress. Financial markets also exhibited persistent market anomalies that spread further, such as a widening cross-currency basis and negative US dollar interest rate swap spreads. These anomalies partly reflected market-specific supply-demand imbalances, sometimes reinforced by the impact of central bank actions on hedging demand. They also reflected shifts in the behaviour of large dealer institutions, which are now less active in arbitraging the anomalies away.
Full text
In 2015 and 2016, financial markets experienced alternating phases of calm and turbulence. As in prior years, prices in core asset markets were keenly sensitive to monetary policy developments. Weaknesses in the main emerging market economies (EMEs), especially China, were again watched closely. Relative to a year earlier, by end-May 2016 equity prices were lower; credit spreads higher; the dollar had depreciated against most currencies; and bond yields were reaching new lows.
As bond yields fell to historical troughs in a number of countries, the share of outstanding government bonds trading at negative yields reached new records. Low yields reflected low term premia as well as a downward shift in expected future rates. In response, investors sought returns in riskier market segments, which supported asset prices. Standard metrics, such as nominal GDP growth in the case of bonds or historical price/earnings (P/E) ratios for equities, pointed to signs of overvaluation. Unease about such valuations, coupled with concerns about the global outlook for growth, resulted in recurring sell-offs and bouts of volatility. Markets appeared vulnerable to a sharp reversal of high valuations. Some outsize bond price movements point to changes in market liquidity, but lower leverage should support more robust liquidity under stress. At the same time, the persistence of low yields could worsen financial system weaknesses over the longer term, through a number of channels.
Persistent market anomalies spread further. Examples included a widening of the cross-currency basis and negative US dollar interest rate swap spreads. These anomalies partly reflected market-specific supply-demand imbalances, sometimes reinforced by central bank actions. They also resulted from shifts in the behaviour of large dealing institutions, which are now less active in arbitraging the anomalies away.
The first section reviews market developments during the past year. The second looks more closely at market valuations, with an emphasis on the role of very low nominal and real interest rates and market liquidity conditions in fixed income markets. The third explores the factors behind the emergence and persistence of certain market anomalies in recent years.
A year of alternating calm and turbulence
Markets experienced periodic bouts of turbulence in 2015 and the first half of 2016, which alternated with phases of uneasy calm. A common theme was the progressive downward revision to the global growth outlook, particularly for EMEs (Chapter III). As in previous years, markets were closely attuned to central bank decisions. But market participants' confidence in monetary policy's ability to steer the economy appeared to falter (Chapter IV). By May 2016, equity indices, commodity prices and advanced economy benchmark bond yields were below their levels of a year earlier, while both corporate and EME sovereign credit spreads were higher. Measures of volatility were stable or higher (Graph II.1). EME currencies, while recouping some of their losses, were in most cases weaker against the dollar compared with a year earlier.
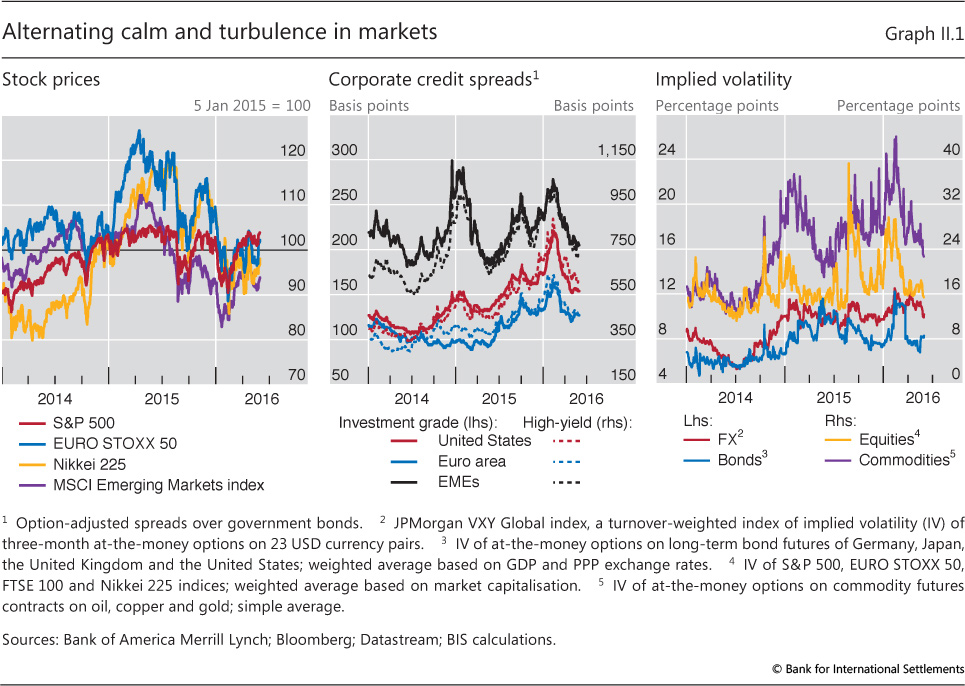
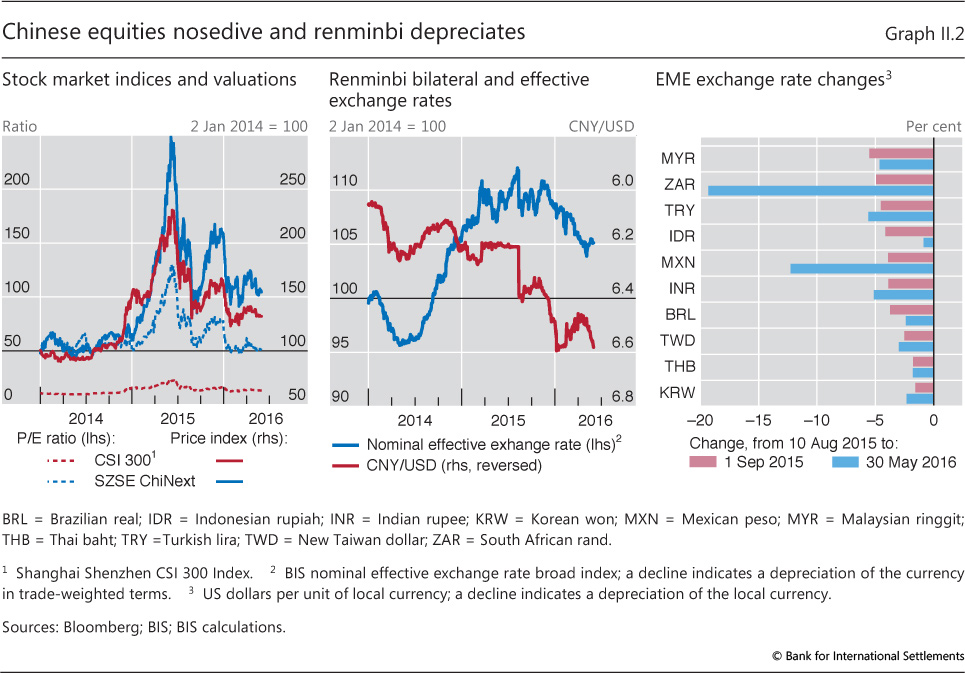
The first episode of market turbulence started in the third quarter of 2015, when the growth prospects of a number of large advanced and emerging economies were downgraded. The spotlight shone especially brightly on China, which for several years had been seen as the global growth engine. A rapid rise in equity prices in the first half of the year, fuelled in part by heavy retail margin purchases, was reversed sharply over the summer (Graph II.2, left-hand panel). The Shanghai Shenzhen CSI 300 Index collapsed from a high of 5,354 on 8 June 2015 to 3,026 on 26 August, while the high-tech-oriented ChiNext board fell even more dramatically. In August, Chinese authorities altered their exchange rate mechanism, allowing the renminbi to depreciate sharply against the US dollar (centre panel). Such events shook confidence in China's ability to achieve a "soft landing" scenario after years of rapid credit-fuelled growth.
Concerns about China quickly spread to other economies and asset prices in August and early September. EME currencies weakened against the dollar (Graph II.2, right-hand panel) while the euro and yen strengthened. Equity prices plunged, particularly in EMEs (Graph II.1, left-hand panel). Credit spreads started to widen again (Graph II.1, centre panel). Volatility rose, especially for equities and commodities (Graph II.1, right-hand panel). The plunge in commodity prices weakened the economic prospects of commodity-exporting countries and of commodity-producing firms, some of them heavily leveraged and with a large weight in key equity and credit indices (Graph II.3).
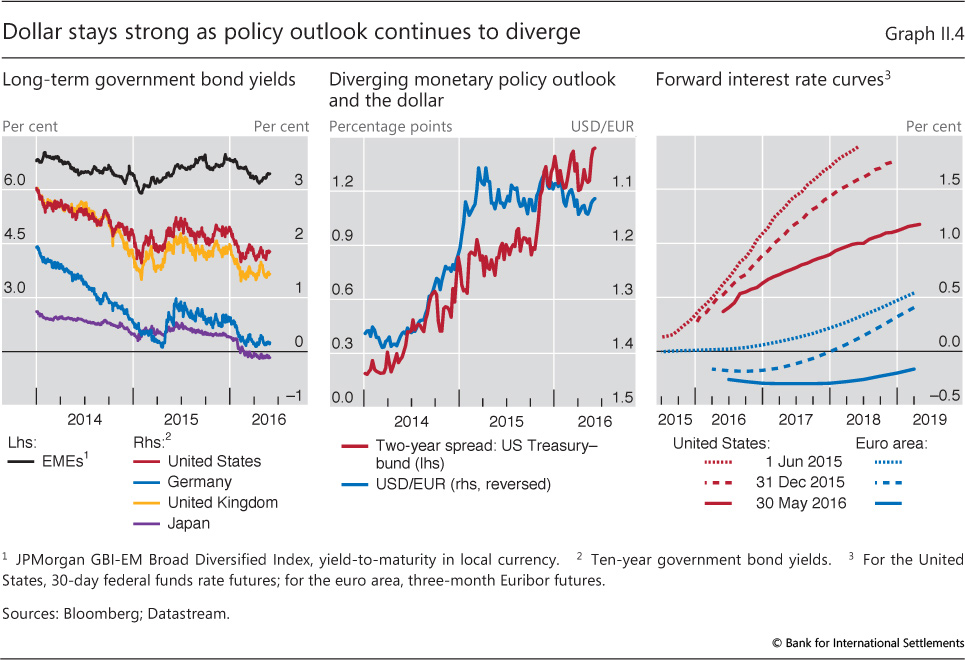
Markets stabilised in October 2015, but in most cases did not recoup their summer losses. Continued strong data for the United States reinforced the expectation that the Federal Open Market Committee would at last tighten policy at its December meeting. The likelihood of divergent monetary policies between the United States, on the one hand, and the euro area and Japan, on the other, contributed to renewed dollar strength (Graph II.4). However, when the hike did take place on 16 December, ending eight years of near zero nominal policy rates, markets took it in their stride, as the move had already been fully incorporated into expectations.
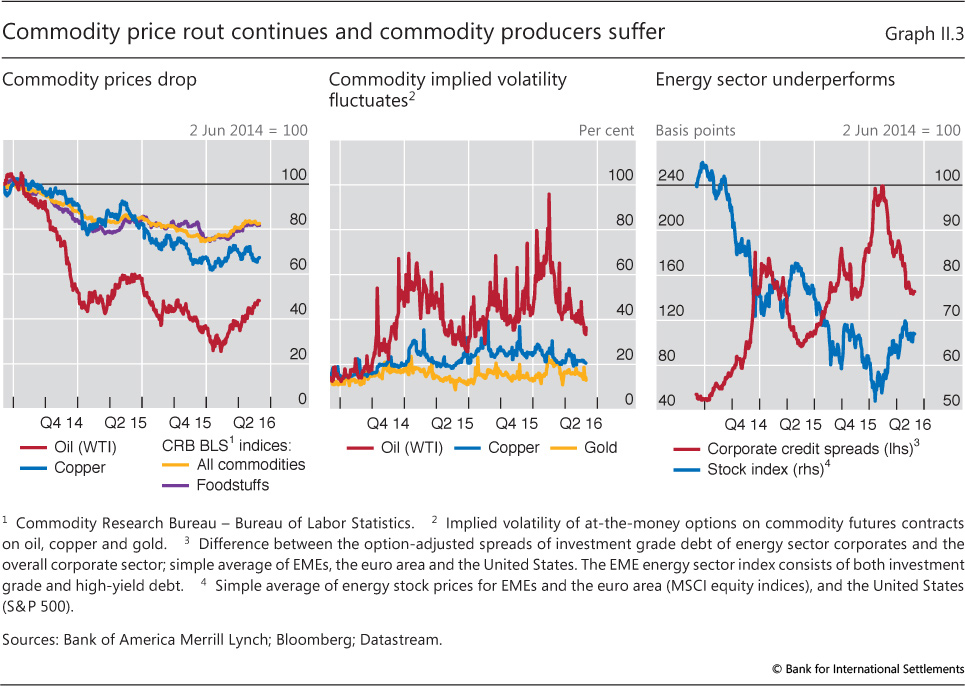
The new year nevertheless brought a second bout of turbulence. The triggering event was again economic news about China, as weak data signalled a sharper than anticipated growth slowdown. Moreover, the arrival of fresh data soon led to a downgrade in growth estimates for a number of other countries. From the start of the year to mid-February, commodity markets weakened, with oil prices falling below $30 per barrel, and major global equity indices dropping 10-20%. US high-yield spreads widened by almost 200 basis points over this period. The high-yield market was particularly vulnerable to turbulence since US energy producers had issued a large volume of lower-quality debt in recent years.
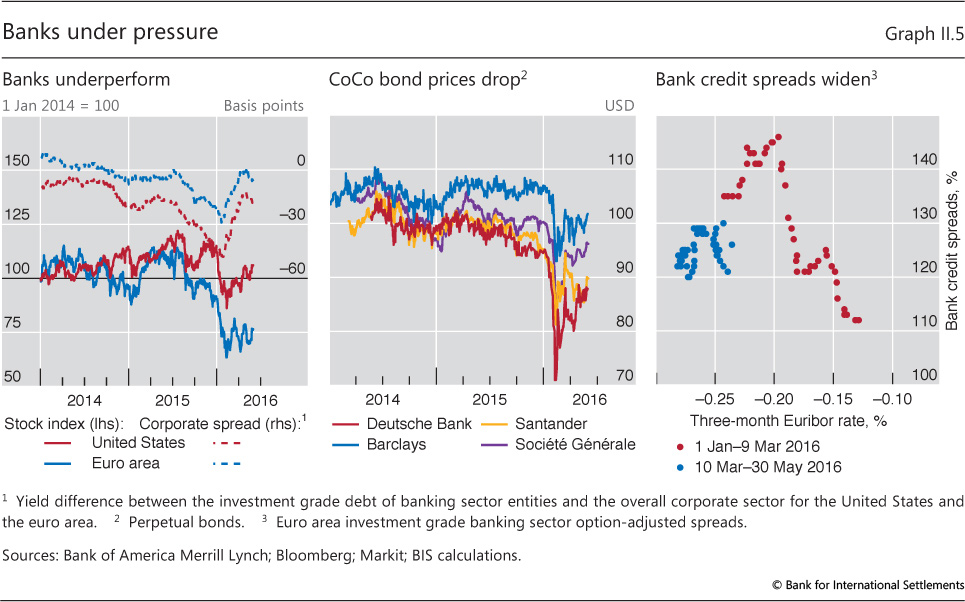
In January, banks came under particular pressure. Their credit spreads widened sharply and equity prices fell before partially recovering in the following months (Graph II.5, left-hand panel). Signs of stress were particularly evident in the pricing of European bank debt, with the prices of contingent convertible obligations (CoCos) diving precipitously (Graph II.5, centre panel). Clearly, investors were still learning about the risks associated with such relatively recent financial instruments. Bank profits, especially in Europe, were seen as coming under growing pressure as policy rates were cut further into negative territory and as an increasing proportion of European government bonds traded at negative yields (Chapter VI). Consistent with this development, ever deeper negative euro interbank rates initially went hand in hand with wider bank credit spreads (Graph II.5, right-hand panel). Bank credit spreads then partially recovered, following the ECB's announcement on 10 March of various policy measures, including the possibility for banks of borrowing from the ECB at its negative deposit rate under certain conditions.
Weaker growth led to expectations of a longer-lasting, and in some cases stronger, monetary policy stimulus. Government bond yields fell across the major economies. The expected path of Federal Reserve tightening shifted downwards. Central banks explored new stimulus measures, including expanded asset purchases by the ECB and a shift to negative policy rates by the Bank of Japan (Box II.A). But whereas in the past these measures might have buoyed markets, in early 2016 they met with an indifferent or even negative response. While the end-January announcement by the Bank of Japan of negative rates led at first to a rebound in the Japanese stock market and a depreciation of the yen, Japanese banks' stock prices soon fell sharply and the yen strengthened as investors seemingly began questioning whether monetary policy would be able to successfully stimulate the economy.
The market episodes of July-September 2015 and January-February 2016 shared a number of common elements. Weaker global stock and credit markets, and weakness in EME bonds and currencies, pointed to "risk-off" behaviour on the part of investors and expectations of slower growth. Commodity prices weakened, especially oil prices, highlighting the important role of oil producers in global equity and credit indices.
Low-rate environment drives asset valuations
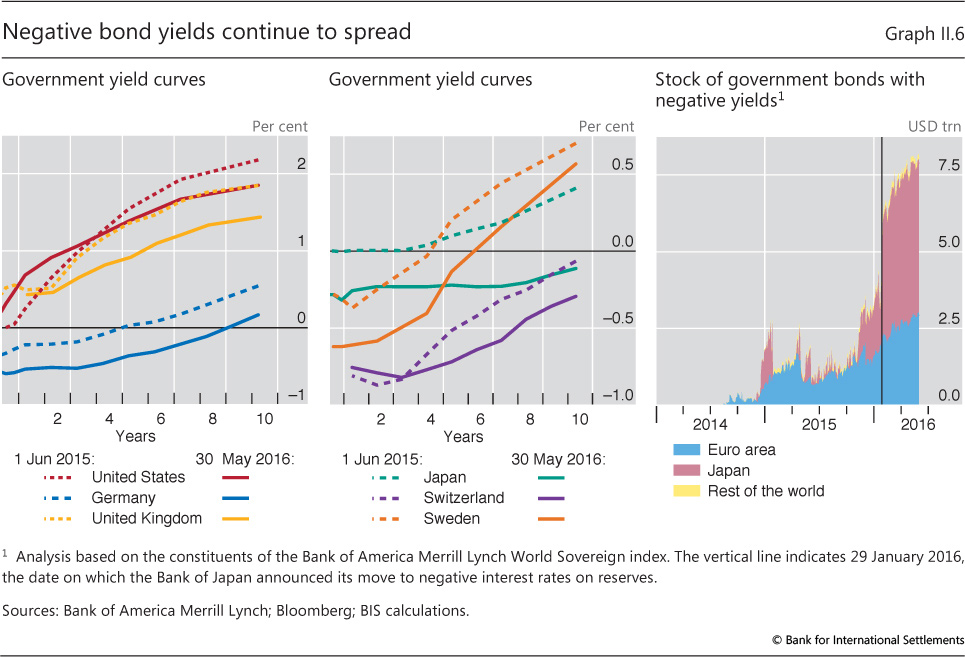
Government bond yields of advanced economies continued to fall during the period under review (Graph II.4, left-hand panel). By May 2016, medium- and long-term bond yields stood well below the already very low levels observed in June 2015, irrespective of whether monetary policy rates had been reduced (Germany, Japan, Sweden), left unchanged (Switzerland, UK) or raised (US) since then (Graph II.6, left-hand and centre panels). Moreover, having been given an upward jolt following the Bank of Japan's decision to move to negative rates, the stock of sovereign bonds trading at negative yields across the globe soared to new highs, reaching close to $8 trillion by end-May (Graph II.6, right-hand panel).
Box II.A
The transmission of negative policy rates: initial experience
Looking for additional tools to achieve their inflation or exchange rate targets, five central banks - Danmarks Nationalbank (DN), the European Central Bank (ECB), Sveriges Riksbank (RIX), the Swiss National Bank (SNB) and, more recently, the Bank of Japan (BoJ) - moved their policy rates below zero, traditionally seen as the lower bound for nominal interest rates in the presence of physical currency offering a zero nominal rate of return.
The experience to date suggests that modestly negative policy rates have been transmitted to money markets in much the same way as positive rates. The pass-through to short-term money market rates has been persistent and the impact on trading volumes - already depressed by central banks' abundant and cheap supply of reserves - appears to have been small, in general. Problems with instruments designed with only positive nominal interest rates in mind, such as constant net asset value money market funds, have so far not materialised.
The introduction of negative policy rates also coincided with a decrease in longer-maturity and higher-risk yields. Isolating their impact precisely is not easy, though, owing to the simultaneous introduction or expansion of central bank asset purchase programmes.
In contrast to what happened in money markets, the effect of negative policy rates on exchange rates was not uniform and in some cases coincided with bouts of volatility. After the introduction of negative policy rates, the DN, which maintains a nearly fixed exchange rate vis-à-vis the euro, saw the appreciation pressure on the krone subside. The SNB, after announcing in December 2014 that rates would be negative on some sight deposits, had to discontinue its exchange rate floor vis-à-vis the euro a month later. The SNB continued to accumulate foreign exchange reserves even after it further lowered the interest rate on sight deposit accounts to -75 bp. In Japan, the 2.8% depreciation of the yen vis-à-vis the US dollar upon announcement of negative policy rates proved transitory and was reversed in the following days.
While zero has not proved to be a technically binding lower bound for central bank policy rates, difficulties associated with their transmission to various parts of the financial system have become more apparent over time.
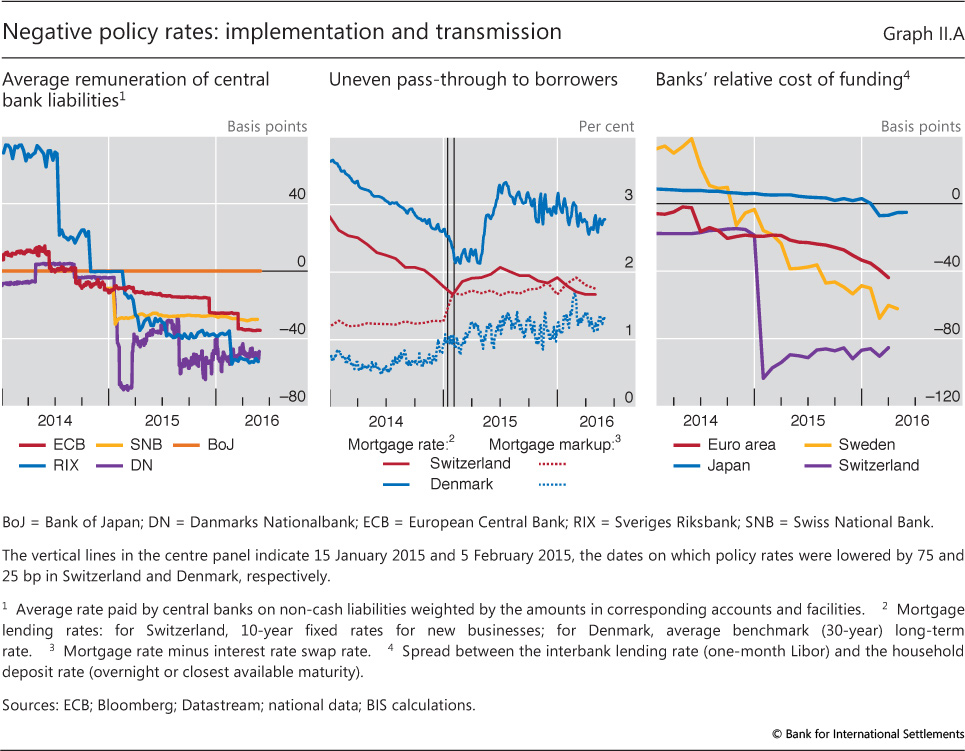
In all jurisdictions, banks, motivated by deposit withdrawal concerns, have been reluctant to pass negative rates through to retail depositors. Partly to limit the resulting impact on their net interest margins, some central banks introduced exemption thresholds for negative remuneration, thereby limiting banks' average cost of holding central bank liabilities (Graph II.A, left-hand panel). Initially, there was also uncertainty as to how banks would treat their "wholesale" depositors, but some banks are now passing on the costs in the form of negative wholesale deposit rates. In some cases, banks have used exemption thresholds akin to those that central banks have applied to their reserves.
In Switzerland, banks adjusted selected lending rates, notably mortgage rates, upwards, even as the policy rate was lowered to -75 bp (Graph II.A, centre panel). The Swiss experience suggests that banks' ability to cope with the relatively high cost of retail deposit funding (Graph II.A, right-hand panel) without increasing lending rates will affect the technical room to keep interest rates in negative territory. This ability depends, among other factors, on the degree of competition in the banking sector and the share of retail deposits in banks' funding mix (Chapter VI).
In Denmark, where mortgage loans are mainly financed with pass-through bonds rather than deposits, mortgage rates fell alongside money market rates, although mortgage markups edged up throughout 2015 (Graph II.A, centre panel). Yet, as most Danish mortgages have adjustable rates, there was uncertainty about the tax treatment and the mechanics of dealing with negative mortgage bond coupons. Also, some investors, notably insurers, were unwilling or unable to buy negative cash flow securities, creating a demand for instruments with interest payments floored at zero.
So far, negative policy rates have not led to an abnormal jump in the demand for cash. However, anecdotal evidence suggests that both financial and non-financial firms have started adapting to the new environment and are seeking to adopt innovations that would reduce the costs associated with physical currency use.
See M Bech and A Malkhozov, "How have central banks implemented negative policy rates?", BIS Quarterly Review, March 2016, pp 31-44.
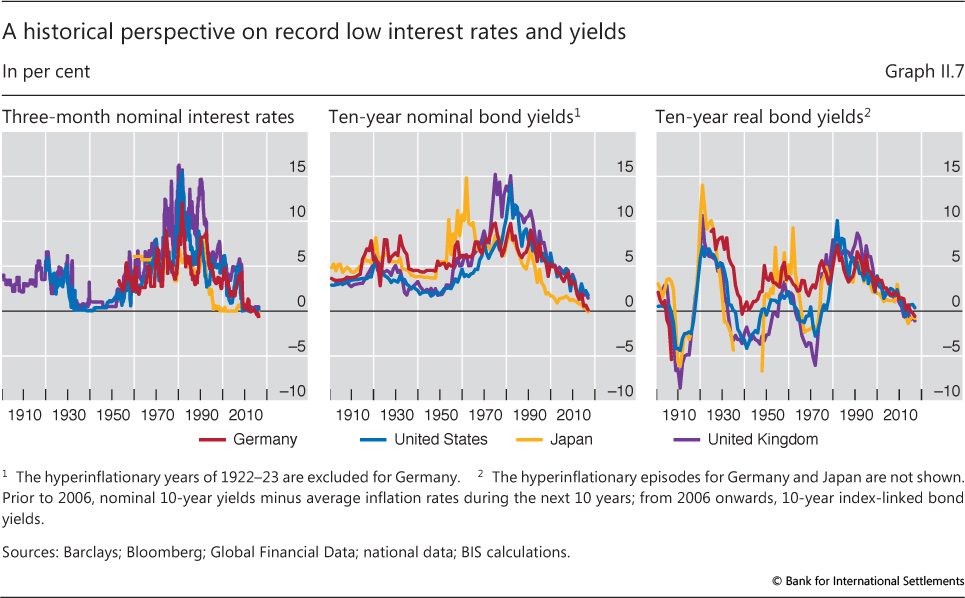
Such low levels of interest rates and yields are in most respects historically unprecedented. The near zero short-term interest rates seen in the United Kingdom and the United States today represent the lowest levels observed since the Great Depression, while current negative short-term rates in Germany and Japan are unparalleled (Graph II.7, left-hand panel). Nominal 10-year bond yields, at between -0.1 and 1.8% for these four countries, are also at or near record lows (Graph II.7, centre panel). And while current 10-year real yields are not unprecedented when compared with ex post real yields since 1900, they are at levels not seen since the inflationary 1970s (Graph II.7, right-hand panel).
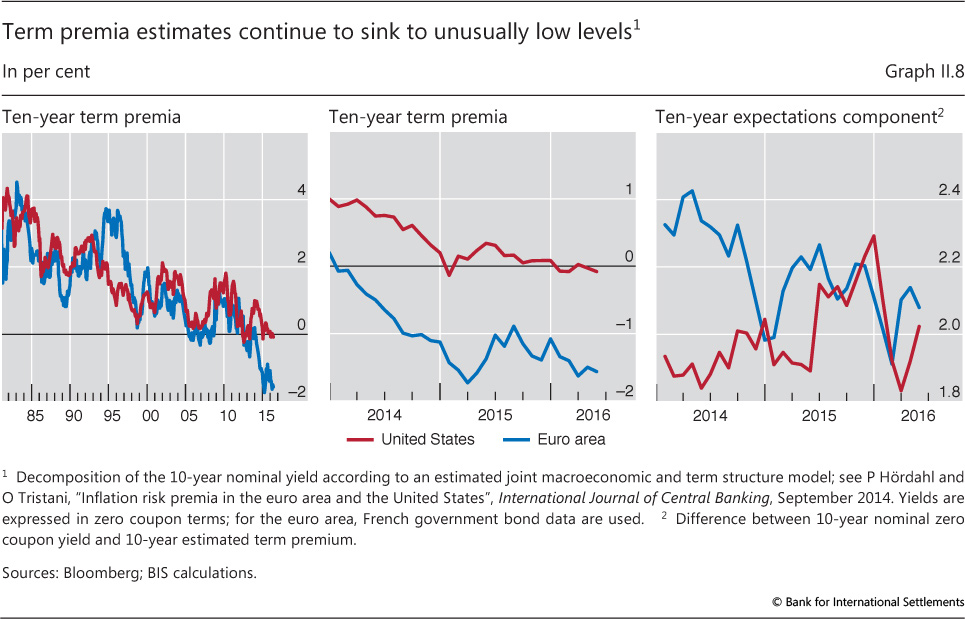
The historically low bond yields coincided with low estimated term premia. In fact, estimates indicate that a significant part of the decline in nominal and real bond yields in recent decades reflects a secular decline in term premia, which are also at historical troughs (Graph II.8, left-hand panel).
Sudden jumps in term premia led to sharp yield increases in the second quarter of 2015, in particular in the euro area (Graph II.8, centre panel). Euro area and US term premia estimates then stabilised before edging down again in the second half of the year. By contrast with historical experience, where US yield movements have tended to drive those in other currencies, US bond yields came under pressure when euro area bond yields fell, as investors chasing higher yields moved into US Treasuries. And during the turbulence of early 2016, a global flight to quality pushed down premia on government bonds further still.
Alongside term premia, expectations of future interest rates also played a role (Graph II.8, right-hand panel). Between May and December 2015, the expected average short-term interest rate in the United States over a 10-year period rose some 40 basis points. This rise came to a halt and was partly reversed in early 2016 as investors reassessed US monetary policy prospects. In the euro area, the expectations component played a smaller role but still contributed to lower yields.
Large-scale central bank purchases, possibly reinforced by financial institutions' behaviour, weighed heavily on yields. For example, by end-2015 the Eurosystem had increased its holdings of euro area government debt to almost 17%, while the Bank of Japan held around 32% of outstanding Japanese government bonds. Hedging by institutions such as pension funds and insurance companies may have further boosted demand for government securities. And banks increasingly favoured sovereign bond holdings, in part owing to financial regulatory reforms, but also due to increased demand for collateral in financial transactions.
In this environment, some observers have asked whether government bonds in the main currencies might be overvalued. Although it is difficult to define overvaluation in the context of government bonds, various views have informed the debate. Some have argued that both the natural real rate of interest and, to a lesser extent, expected inflation have fallen substantially for the foreseeable future in a number of advanced economies (Chapter IV). Others have noted that economic growth, productivity, inflation and other macroeconomic fundamentals could well revert to their pre-crisis levels. Even disregarding term premia, this second line of argumentation would view current bond market valuations as overly rich.
Unusually low prevailing term premia are another piece of the puzzle. Bond prices would be overvalued if zero or negative term premia turned out to be unsustainable. True, term premia may not necessarily return to their pre-crisis levels: for instance, inflation may be viewed as less of a long-term threat than in previous years, or investors' risk aversion may have changed. That said, it seems unlikely that deeply negative term premia such as the ones estimated for the euro area can persist indefinitely. The question then becomes when, and how fast, premia will normalise.
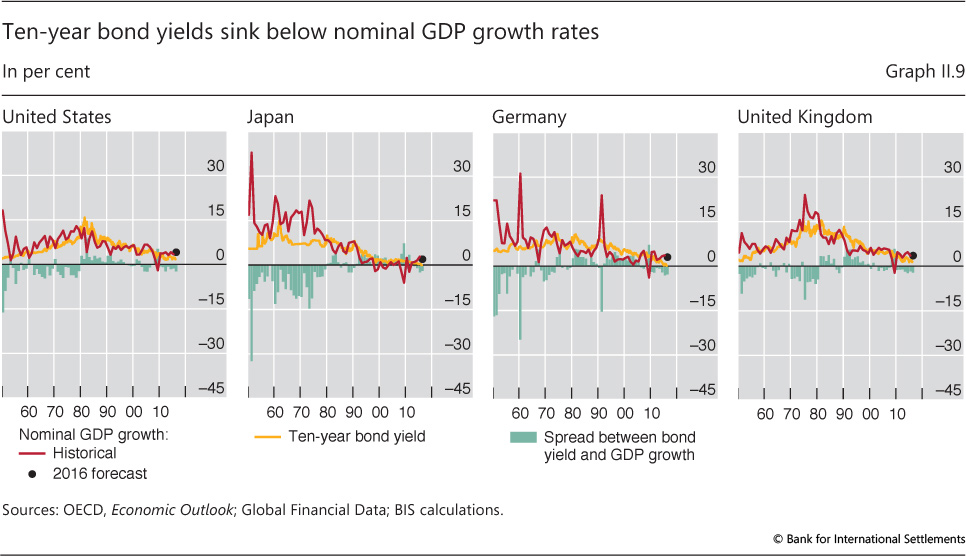
Comparing long-term bond yields with the evolution of nominal GDP suggests that yields are indeed currently on the low side. Over the past 65 years or so, the broad trends in nominal GDP growth and 10-year bond yields have lined up reasonably well across the United States, Japan, Germany and the United Kingdom (Graph II.9). Most likely, the real bond yields and expected inflation components of nominal yields have fluctuated in tandem with real GDP growth and inflation, respectively. Currently, bond yields are somewhat below nominal GDP growth in all four countries.
If, for whatever reason, bond yields are "too low", they could snap back at some point as market expectations adjust. The size and potential disruption of a reversal have less to do with the characteristics of day-to-day liquidity provision than with the incidence of forced sales and financial institutions' capacity to absorb the hit. Despite the higher frequency of large price moves in recent years, there is no convincing evidence of a structural decline in fixed income market liquidity (Box II.B). That said, there is no doubt that such liquidity will evaporate under stress, as it has always done in the past. Signs of liquidity illusion in the growing asset management industry suggest caution. At the same time, stronger bank balance sheets, lower broker-dealer leverage and better liquidity risk management should all support more robust liquidity and help contain any damage from periods of illiquidity (Chapter VI).
Alternatively, persistently low yields could end up having pernicious effects on the economy and become to some extent self-validating. By sapping banks' profitability and resilience, low yields may reduce banks' capacity to support the economy (Chapter VI). They may also distort financial and real economic decisions more generally, for instance by encouraging unproductive firms to maintain capacity or by inflating asset prices, thereby weakening productivity (Chapter III). And they may encourage further debt build-up, which could make it harder for the economy to withstand higher rates (Chapter IV).
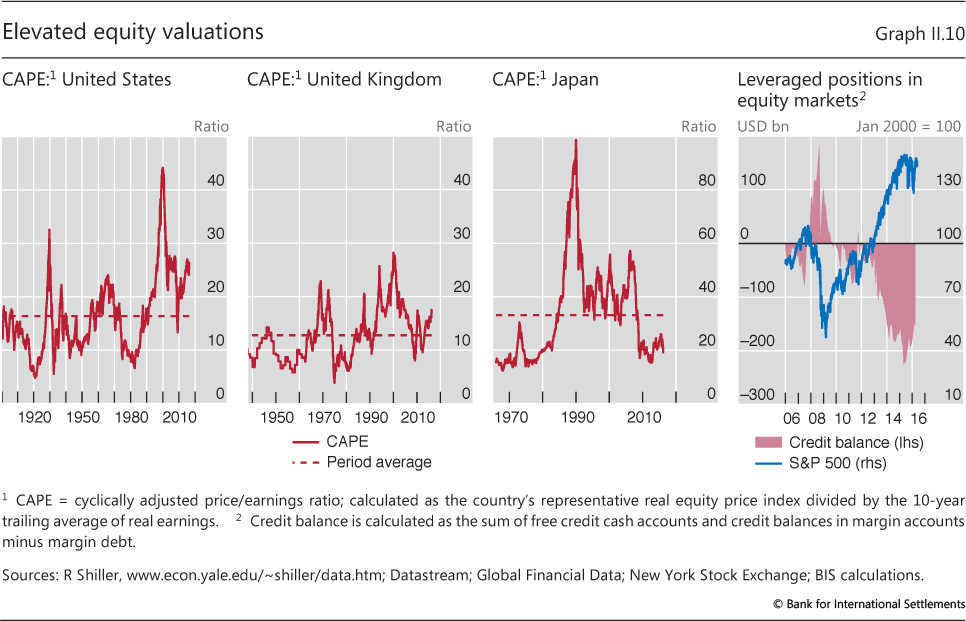
Equity valuations have also come under scrutiny. As bond yields fell globally post-crisis, equity prices rose, pushing up valuation metrics such as P/E ratios. Stocks naturally became increasingly attractive relative to bonds while lower real interest rates boosted the discounted value of future corporate earnings. Partly as a result, cyclically adjusted P/E ratios in the United States and the United Kingdom have stood well above their historical averages in the past few years (Graph II.10, first two panels) - a possible sign of stretched valuations. The corresponding P/E ratio for Japan has been below average, but that average has arguably been inflated by the financial bubbles of the 1980s (Graph II.10, third panel). Moreover, the run-up of US equities in recent years has coincided with sharply higher leveraged positions (Graph II.10, last panel). And equity prices have also been supported by very strong share buybacks, particularly in the United States. The nervousness observed in global equity markets over the past year, with repeated sharp price corrections, hints at investors' unease with current valuations.
Box II.B
Liquidity in fixed income markets
Some observers pointed to market developments in 2015 and 2016 as evidence of a structural decline in market liquidity, particularly in fixed income markets. Large swings in some market segments were seen as evidence that relatively small changes in positions had the potential to lead to outsize price shifts. Explanations for the apparently different conditions varied: some argued that post-crisis regulation had hampered banks' ability to provide liquidity, while others pointed to the growing influence of complex trading strategies such as high-frequency trading (HFT). This box takes a closer look at whether, and in what ways, fixed income market liquidity may have evolved. Chapter VI discusses potential drivers and policy implications.
Market liquidity can be defined as "the ability to rapidly execute large financial transactions at low cost with limited price impact". The concept's multifaceted nature suggests that liquidity should be measured by several indicators.
Most indicators do not show a significant structural decline of liquidity in fixed income markets, or indeed most other markets, in recent years. For one, bid-ask spreads, defined as the gaps between the prices at which dealers are willing to buy and sell securities, have been rather stable and tight in major sovereign bond markets (Graph II.B, first and second panels). By comparison, quoted depths (the amounts of securities available for trading at the best prices) and average transaction sizes have fallen in some markets, but are not unusually low by historical standards (Graph II.B, third and fourth panels).
What appears to have increased is the number of intense, and disorderly, but generally short-lived price movements. The "flash rally" of 15 October 2014, when the 10-year US Treasury yield fell by 20 bp and then rose by as much in a matter of minutes, is one such example. In other cases, adverse liquidity effects seemed to last longer. During the "bund tantrum" of May-June 2015, for example, uncertainties related to the ECB's asset purchase programme led to a sharp rise in government bond yields. The 10-year German bund yield, in particular, rose from 8 bp on 20 April to 98 bp on 10 June (Graph II.4, left-hand panel).
Although the explanations for these sudden changes in market conditions vary, the increased role of market participants outside the traditional dealer community, such as principal trading firms (PTFs), is likely to have been a major factor. The shift in trading activity from dealers to PTFs reflects the increasing use of electronic trading platforms and the proliferation of trading algorithms in a number of key fixed income markets such as those for major sovereign bonds. PTFs, on the one hand, have contributed to reducing trading costs and supporting liquidity during normal market conditions. On the other hand, their complex and often opaque trading strategies have raised questions about risks to market stability, and have created challenges for regulators and supervisors.
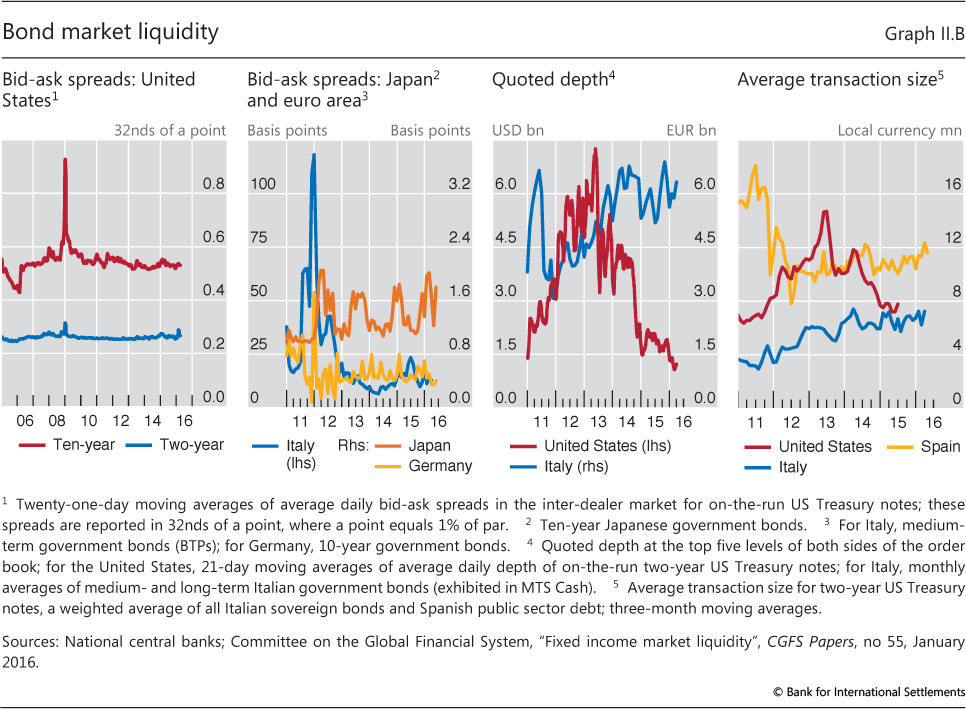
Overall, while stress events, such as the "flash rally" or the "bund tantrum", imposed costs on some participants, the system as a whole has continued to perform its primary functions - including price discovery, risk management and asset allocation - rather well. Indeed, the decline in dealers' risk tolerance and the improved pricing of risks, supported by the new regulatory environment, should bring the costs of liquidity provision more into line with the risks they generate for the financial system (Chapter VI).
This quotation is from Committee on the Global Financial System, "Fixed income market liquidity", CGFS Papers, no 55, January 2016. See R Riordan and A Schrimpf, "Volatility and evaporating liquidity during the bund tantrum", BIS Quarterly Review, September 2015, pp 10-11. US Department of the Treasury, Board of Governors of the Federal Reserve System, Federal Reserve Bank of New York, US Securities and Exchange Commission and US Commodity Futures Trading Commission, Joint Staff Report: The US Treasury market on October 15, 2014, 13 July 2015. See M Bech, A Illes, U Lewrick and A Schrimpf, "Hanging up the phone - electronic trading in fixed income markets and its implications", BIS Quarterly Review, March 2016, pp 79-94.
Corporate credit markets were subdued over the past year. Both investment grade and high-yield credit spreads were higher in May 2016 than a year before in the United States and the euro area as well as across EMEs (Graph II.1, centre panel), although euro area spreads benefited from expected ECB purchases of corporate bonds. In part, the general rise in spreads reflected the weakening economic outlook, and in particular the rapidly deteriorating creditworthiness of the energy sector (Graph II.3).
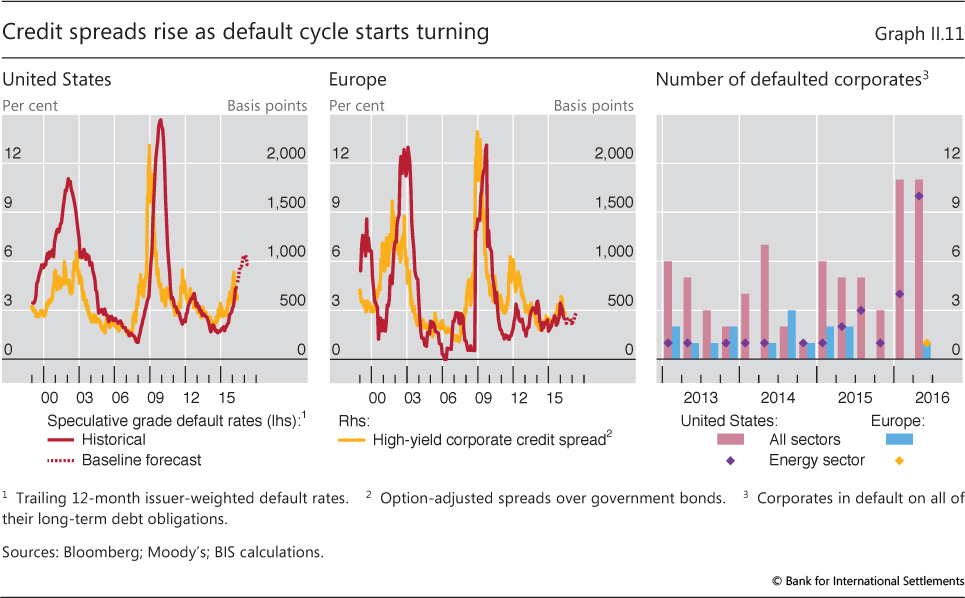
Signs of a turn in the default cycle helped widen corporate credit spreads. In the United States, the rise in the speculative grade default rate that had begun in early 2015 continued uninterrupted throughout the review period, and credit spreads followed upwards (Graph II.11, left-hand panel). For instance, according to Moody's estimates, having risen from 1.8% at the end of 2014 to 4.4% in April 2016, the default rate was projected to rise above 6% by the beginning of 2017. In Europe, the speculative grade default rate also edged up in the past year, albeit less than in the United States (Graph II.11, centre panel). The sharper rise in the US default rate was due partly to the relatively stronger importance of the energy sector there: a greater number of corporate defaults in the United States occurred among energy firms than in Europe, where only one energy sector default has been recorded in the last three years (Graph II.11, right-hand panel).
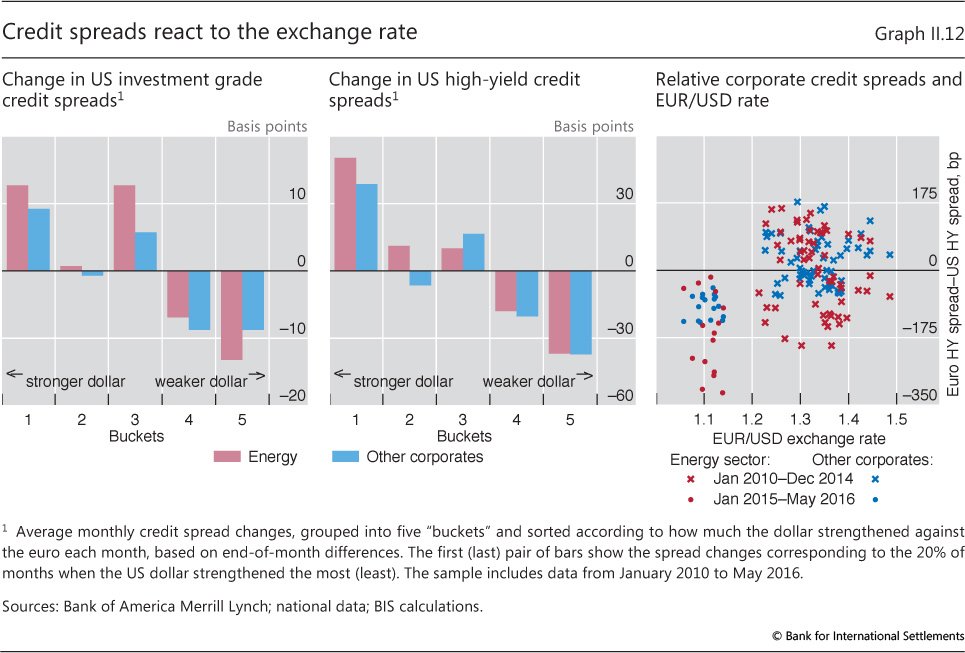
Exchange rate developments also appear to have played a role in the pricing of credit risk. In periods during which the dollar strengthened strongly relative to the euro, US investment grade and high-yield spreads tended to rise sharply, and vice versa (Graph II.12, left-hand and centre panels). This pattern was evident among corporates in both the energy and non-energy sectors. Moreover, from 2015 onwards, with the euro relatively weak vis-à-vis the dollar, euro high-yield credit spreads tended to trade significantly below those in the United States (Graph II.12, right-hand panel). In the preceding years, before the dollar had strengthened appreciably, euro credit spreads had been instead close to or higher than their US counterparts. While the strong influence of oil producers on US credit spreads has played a role, the relationship is also present among non-energy firms.
One possible explanation behind this pattern could be changing perceptions of the growth outlook - and hence of corporate credit quality - resulting from exchange rate swings. Similarly, a stronger dollar goes hand in hand with tighter US financial conditions (Chapter III). Another possibility is that easier monetary policy in the euro area tends to weaken the euro while at the same time inducing European investors to seek higher-yielding investments such as euro area corporate bonds.
Market anomalies spread
The years since the Great Financial Crisis have been marked by a number of anomalies in financial markets. Pricing relationships that in previous times would have been rapidly eliminated through arbitrage have instead proved surprisingly persistent.
Cross-currency basis swap spreads offer one example (Box II.C). Such spreads normally adjust to eliminate arbitrage opportunities between a forward position in a given currency and the same position as constructed by a foreign currency swap and a forward in a different currency. Indeed, this covered interest parity relationship is taken for granted in economics textbooks. The relationship broke down during the crisis, reflecting counterparty risk and funding liquidity shortages in certain currencies. Since the crisis, concerns about banks' credit quality and liquidity shortages have diminished - but the anomaly has persisted.
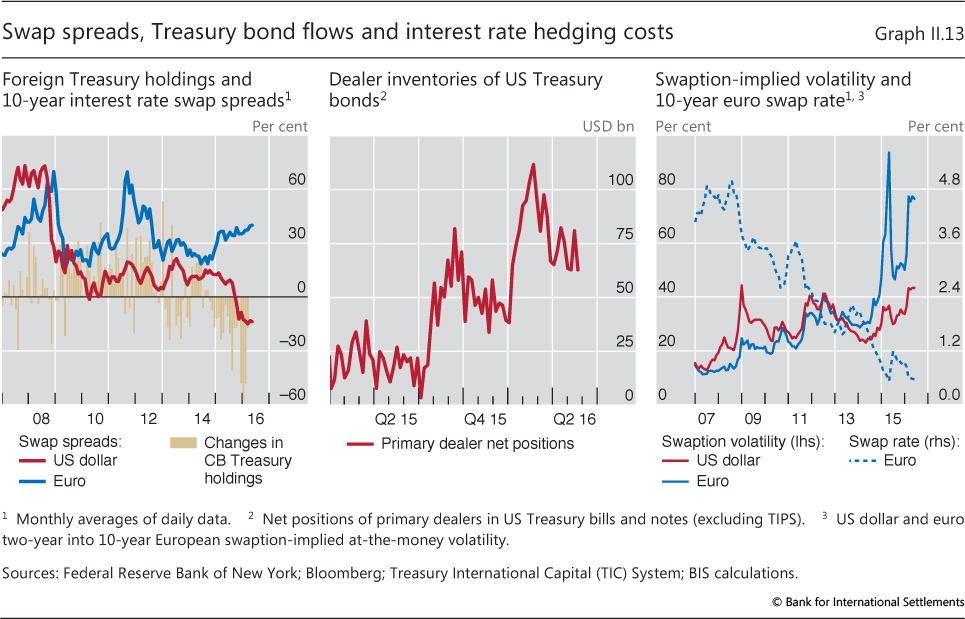
A second example is US dollar interest rate swaps (Graph II.13). Normally, the fixed rate offered on swaps against floating rate payments is a small, positive spread over US Treasury yields. After all, the counterparty credit risk of the banks involved in the transaction is somewhat higher than that of the US government. During the crisis, investors' flight to safety and growing counterparty risk concerns drove these spreads to high levels. But in 2010, and again in late 2015, the spreads were actually negative for US dollar swaps, while remaining positive for euro swaps (Graph II.13, left-hand panel).
These anomalies reflect a combination of factors.
One set of factors relates to supply and demand conditions in underlying asset markets. For example, central banks' large-scale purchases of government securities represented a new and largely price-insensitive source of demand. The end of Fed purchases, reinforced by sales of Treasury bonds by some EME official reserve holders, may have created temporary excess supply that drove US bond yields above dollar swap rates. An indication of these conditions is that dealers' inventories of US Treasuries soared as they stepped in to meet the supply (Graph II.13, centre panel).
A second, related set of factors involves hedging demand. Shifts in the perceived likelihood and timing of higher US rates will shift US dollar borrowers' demand for receiving fixed rates via swaps. The same is true for those attempting to hedge currency risk via cross-currency basis swaps. In currency swap markets, given exceptionally low yields, there have been signs that large institutional investors boosted their investments abroad on a currency-hedged basis, putting strains on the corresponding instruments' prices. The footprints of hedging demand have also been visible in the implied volatility of swaptions (options to enter into swaps), which jumped (particularly in euros) in early 2015 (Graph II.13, right-hand panel).
A third factor relates to a reduced willingness or ability to arbitrage, an activity that requires both capital and funding, and is balance sheet-intensive. Large dealer banks play a central role in maintaining these arbitrage relationships, either through their own position-taking or by providing funding to others such as hedge funds. In response to the large losses incurred on their trading activities during the Great Financial Crisis, banks in many jurisdictions have reappraised the risk/return trade-off of their business lines, including proprietary trading and market-making. Moreover, structural reforms, such as the US Volcker rule, as well as bank capital and liquidity requirements, have been tightened to enhance bank resilience and induce a more accurate pricing of risks, reducing the scope for banks to tightly price away arbitrage opportunities (Chapter VI).1
Box II.C
Understanding the cross-currency basis: why does covered interest parity not hold?
One of the most puzzling recent anomalies has been the re-emergence of the cross-currency basis (the basis) or, equivalently, the widespread violation of covered interest rate parity (CIP). With a non-zero basis, cross-currency swap counterparties face interest rates that do not match prevailing cash market rates, even though currency risk has been fully hedged: those borrowing dollars by swapping out of yen or euros pay much more than the prevailing US money market rates, while those swapping out of Australian dollars pay less (Graph II.C.1, left-hand panel).
As traditional thinking goes, this should open up an arbitrage opportunity, because those with access to both money markets, typically banks, can "collect the basis" by lending the currencies that command a premium in cross-currency swaps. Hence, in the past, CIP violations were confined to periods of market stress. During the turmoil of 2007-2012, the basis widened when banks that needed dollars lost access to wholesale funding owing to credit risk concerns and the withdrawal of US money market funds. The basis then narrowed again when central banks provided US dollar funding and bank credit risk improved. However, since mid-2014, CIP deviations have re-emerged even as counterparty risks and wholesale funding strains have faded.
How can this be? Such anomalies can persist when strong investor demand runs into the market's capacity to conduct arbitrage. The demand to raise US dollars in cross-currency funding markets stems largely from banks' own use of swaps to hedge foreign currency loans and bond holdings as part of their business models, and from institutional investors' desire to hedge their US dollar bonds. At the same time, limits to arbitrage appear to have arisen from banks' reduced ability or willingness to use their balance sheets to take the other side of the trades in the forward/swap markets, which would have kept the basis near zero. A difficulty in taking this framework to the data is that banks are involved at all stages: swapping out of home currencies to fund US dollar lending, hedging US dollar bond holdings, supplying US dollars via swaps to collect the basis, and simply making markets in currency swaps. Still, the available evidence is broadly consistent with it.
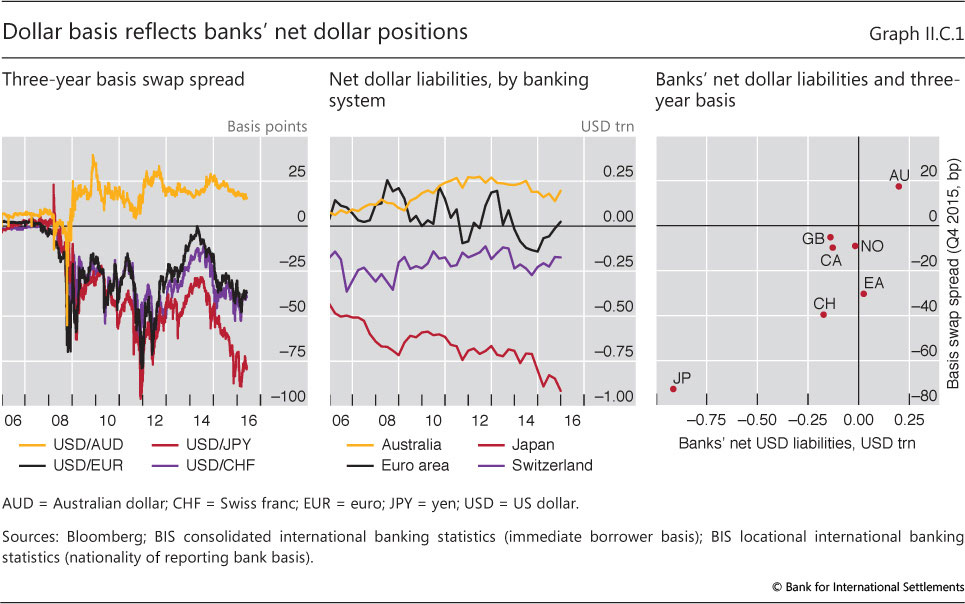
Drivers of supply-demand imbalances. First, banks' own demand to hold foreign currency assets on a hedged basis - or to fund domestic currency assets with hedged foreign currency - pushes the basis away from zero. In the yen and the euro, banks' funding of dollar assets reinforces the pressures on the basis stemming from institutional investors' hedging of dollar securities. Hence, Japanese and euro area banks pay up for dollar funding in the form of the basis. (This is exactly the opposite of an arbitrageur who collects that basis by supplying dollar funding via swaps.) In contrast, Australian banks raise foreign currency abroad to fund domestic currency mortgages, thus supplying US dollars via swaps to Australian institutional investors that need to borrow dollars to hedge their dollar bonds. As a result, some BIS reporting national banking systems have more on-balance sheet dollar liabilities than dollar assets, eg Australian banks, while others have more assets than liabilities, eg Japanese and Swiss banks (Graph II.C.1, centre panel). And indeed, the sign and size of BIS reporting banks' "dollar funding gaps" are closely associated with the sign and size of the respective basis against the US dollar (Graph II.C.1, right-hand panel).
Second, record high demand for swapping out of low-yielding euro and yen assets on the part of institutional investors and corporate bond issuers has increasingly put pressure on the basis. Term- and credit-spread compression in the euro area and Japan, spurred by central banks' asset purchases, has led institutional investors there to seek yield in US dollar bonds hedged back into euros or yen. Such spread compression has at the same time drawn US firms into issuing euro bonds (€220 billion outstanding in 2015), often to swap back into dollar liabilities, adding to the pressure. As a result, the cost of swapped US dollar funding has increased, widening the basis (Graph II.C.1, left-hand panel).
Limits to arbitrage. The record demand for dollar fund-raising via swaps has been met with global banks' reduced willingness to arbitrage. Before 2007-08, banks not only swapped currencies to meet their own business models' cash currency mismatches but also served as active arbitrageurs. They would keep the basis near zero by borrowing short-term in one currency, exchanging the funds in the currency market and lending the proceeds short-term, thereby offsetting a customer's forward position. Moreover, they also used these short-term operations to offset medium-term customer hedges. Post-crisis, however, shareholders and regulators have constrained operations that blow up balance sheets and entail mark-to-market risk as well as, depending on the underlying asset, a degree of credit risk. Another limit to arbitrage arises from slow-moving capital, as the capacity of other financial institutions, such as supranational bond issuers that can issue US dollar bonds (to then swap the dollars for other currencies to collect the basis), falls far short of closing the arbitrage opportunity.
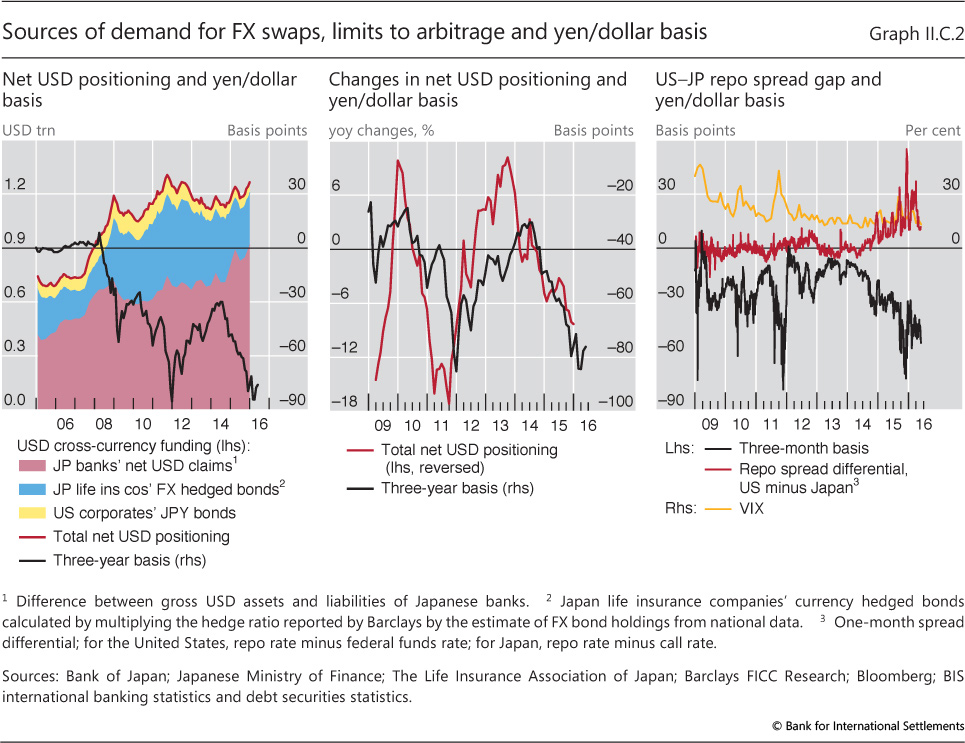
A detailed example: yen/dollar basis. Yen/dollar is the most extreme and persistent basis of the major currencies. First, Japanese banks' overseas expansion (and the use of the US dollar as a vehicle currency to swap into higher-yielding regional currencies) has substantially increased their estimated dollar funding gap, defined as dollar assets in excess of on-balance sheet dollar liabilities (Graph II.C.2, left-hand panel). The Japanese banks' US dollar funding gap has also been pushed up by the build-up of US dollar securities positions held for other investors in their trust accounts, with the portion hedged for currency risk putting further pressure on the basis. In this way, Japanese banks' business models reduce their capacity to serve as counterparties to non-bank hedgers in cross-currency markets and to arbitrage the basis. Adding to this, Japanese life insurers' search for yield overseas has led them to increase FX-hedged investments in US dollar-denominated bonds (with average hedge ratios of 60-70%). The associated upsurges in total demand for US dollars via swaps have been pushing out the yen/dollar basis (Graph II.C.2, left-hand and centre panels).
The role played by constraints on bank balance sheets in limiting arbitrage becomes visible in specific circumstances. First, because repo markets are an important source of arbitrage funding, the diverging repo spreads in US dollars and yen have made it increasingly costly to fund the CIP arbitrage involved in lending dollars against yen. This has led to a wider basis (Graph II.C.2, right-hand panel, rising red line and falling black line). Second, as reporting and regulatory ratios provided at quarter-end gained importance in 2014, repo spreads in dollar and yen money markets started to exhibit quarter-end jumps. In particular, counterparties in the US dollar money market became less willing to lend their dollars at quarter-ends. These spikes in the relative cost of dollars in repos drove down the swap basis at three-month and shorter maturities. Higher US dollar funding costs via shorter-term swaps at quarter-ends also put pressure on pricing of longer-maturity swaps, leading to more costly US dollar swap funding over the quarter.
This box is based on C Borio, R McCauley, P McGuire and V Sushko, "Whatever happened to covered interest parity? Understanding the currency basis", forthcoming, 2016. See N Baba, F Packer and T Nagano, "The spillover of money market turbulence to FX swap and cross-currency swap markets", BIS Quarterly Review, March 2008, pp 73-86; L Goldberg, C Kennedy and J Miu, "Central bank dollar swap lines and overseas dollar funding costs", Economic Policy Review, May 2011, pp 3-20; and T Mancini-Griffoli and A Ranaldo, "Limits to arbitrage during the crisis: funding liquidity constraints and covered interest parity", Working Papers on Finance, no 1212, University of Sankt Gallen, 2012. Nor have central banks drawn much on swaps to provide dollar funding to non-US banks; see https://apps.newyorkfed.org/markets/autorates/fxswap. See the survey conducted by D Gromb and D Vayanos, "Limits to arbitrage", Annual Review of Financial Economics, vol 2, July 2010, pp 251-75.
1 See L Andersen, D Duffie and Y Song, "Funding value adjustments", mimeo, 10 March 2016, who argue that well documented pricing "anomalies" in derivatives markets can be traced back to so-called funding value adjustments that incorporate the cost of funding the cash or collateral needed to enter or maintain unsecured derivatives positions - a reflection of more comprehensive collateralisation and wider bank funding spreads post-crisis.