The global economy: realignment under way?
Abstract
Global growth of GDP per working age person slightly outpaced its historical average and unemployment rates generally fell in the year under review. Perceptions of economic conditions, however, were defined by further falls in commodity prices, large swings in exchange rates and lower than expected headline global growth. These developments hint at a realignment of economic and financial forces that have unfolded over many years. In EME commodity exporters, the downturn in the domestic financial cycle mostly compounded the fall in export prices and currency depreciations, with economic conditions becoming weaker. In general, tighter access to dollar borrowing amplified these developments. The anticipated rotation of growth failed to materialise, with activity in advanced economies not picking up as much as needed to offset slower EME growth, despite some upturn in domestic financial cycles in the advanced economies most affected by the Great Financial Crisis. Lower oil and other commodity prices have not yet triggered the expected fillip to growth in importers, possibly because some parts of the private sector are still nursing weak balance sheets. The scars of repeated financial booms and busts and debt accumulation also hang over global potential growth: factor misallocation appears to be holding back productivity, with debt overhang and uncertainty seemingly restraining investment.
Full text
The global economy continued to expand in the year under review, with unemployment generally falling and global growth of GDP per capita around its historical average. That said, sharp falls in commodity prices and their subsequent partial recovery, large exchange rate moves and lower than expected headline global GDP growth shaped perceptions. These developments are often seen as the confluence of unrelated negative shocks. But this triplet is, to an important extent, the result of an economic and financial process that has unfolded over many years.1 Before reviewing these three developments and the realignment they represent, it is useful to take stock of their connections and the path taken to the current juncture.
The genesis of much of the latest developments lies in the boom years leading up to the Great Financial Crisis. Stable, low-inflation growth in the 2000s encouraged easy monetary and financial conditions in the major economies and ample global liquidity. Easy financing fuelled domestic financial booms in advanced economies, with credit and property prices soaring. Strong growth in emerging market economies (EMEs), particularly in China as it reformed and opened its economy, added to buoyant global demand. Resource-intensive industries in EMEs, including manufacturing and construction, expanded rapidly, pushing demand for commodities ever higher. The surge in commodity prices, and in commodity producers' exchange rates, encouraged ample and cheap international borrowing, in turn contributing to the vast investment in commodity production capacity.
The financial crisis brought only a brief pause to these dynamics. The onset of severe balance sheet recessions in the countries at the core of the crisis, prominently the United States and parts of Europe, led to highly expansionary monetary and fiscal policies not only in these economies, but also in those exposed to them through trade and financial channels, including China. The resulting demand boost triggered a resurgence in the commodity boom as resource-intensive industries expanded in key economies, supported by readily available finance. As the crisis-hit countries recovered only slowly from the balance sheet recession, highly expansionary monetary policy remained in place for an extended period even as fiscal policy tightened somewhat. The persistently easy global liquidity conditions induced spillovers to commodity exporters and other EMEs, boosting broad-based domestic financial booms in those countries.
More recently, the commodity "supercycle" has turned and global liquidity conditions have begun to tighten even as crisis-hit economies have continued to grow at a moderate pace. In the past year, weakness in construction and manufacturing slowed the growth of resource demand. This softer demand, coupled with supply expansion, ushered in further commodity price drops, with significant economic consequences. For some countries, maturing or turning domestic financial cycles coincided with tighter external financial conditions linked to an appreciating US dollar. Large exchange rate depreciations have the potential to cushion countries against external developments, but their beneficial effect can be offset by the corresponding tightening of financial conditions, as they boost the foreign currency debt burden. With EMEs accounting for a larger share of the global economy than ever before, their strains can have larger spillbacks on other economies.
This chapter reviews the lower than expected growth, commodity price falls and exchange rate moves in the context of the financial and real forces that delivered this triplet. The first section discusses growth in the global economy, countries' evolving financial cycles and the elusive realignment. While growth has been lower than expected, particularly in EME commodity exporters, the state of the economy appears much brighter based on growth adjusted for demographic change and labour market outcomes. The subsequent sections examine the commodity price falls - the proximate cause of lower growth in many commodity producers and EMEs - and the associated exchange rate moves. These two relative price changes can set the basis for more sustainable growth in the long run, but the short-run drag may be significant. The potential spillovers from EMEs are discussed next. While EMEs' increasing share of growth and trade means they are a greater source of spillovers through trade, financial spillovers largely still emanate from advanced economies. Notably, though, such financial spillovers can build up in EMEs, raising the potential for pernicious spillbacks to advanced economies. Finally, the chapter explores the causes and policy implications of slower structural growth. The slowing of working age population growth is weighing heavily on growth potential, but other headwinds from the shadows of financial booms should eventually recede. These headwinds make it all the more important to pursue policies that can deliver sustainable growth.
The missing rotation
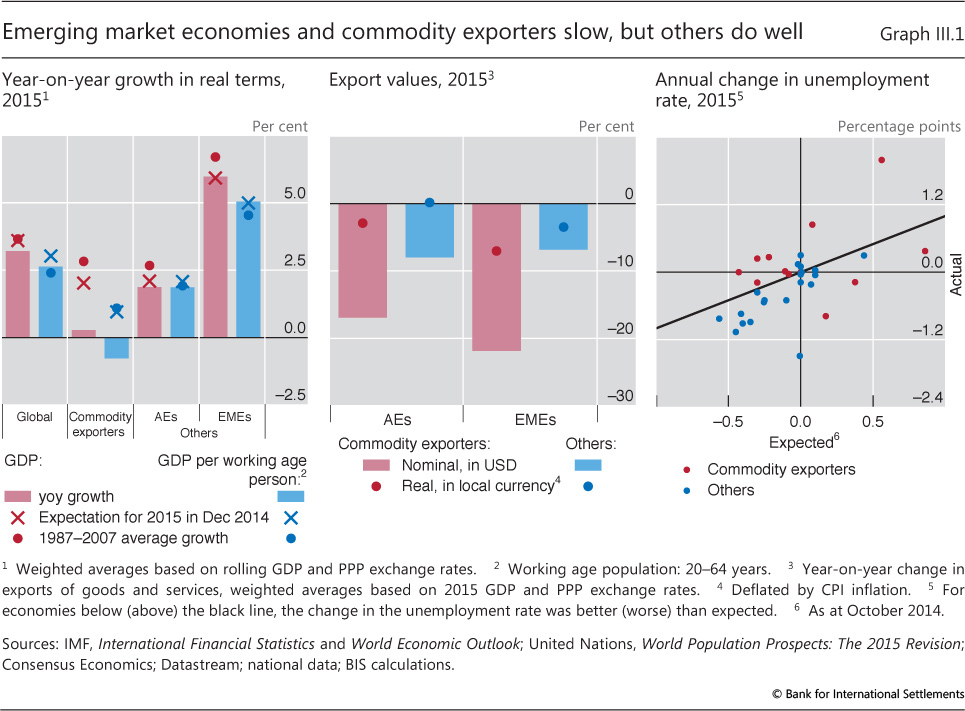
Global growth in 2015 was lower than expected, and the near-term outlook weakened (Chapter II). Global GDP expanded by 3.2% in 2015, less than the 3.6% expected as at December 2014, which would have been close to the 1987-2007 average (Graph III.1, left-hand panel). However, taking account of demographic forces, growth of GDP per working age person was actually slightly above its historical average. The anticipated rotation in growth, part of the broader realignment, failed to materialise as the slowdown in some EMEs, in particular commodity exporters, was not fully offset by a pickup in advanced economies. The financial cycle turned down in some economies adversely affected by these economic forces, but remained in an upswing in others (see Box III.A for a discussion of the measurement of the financial cycle). Growth in most economies was underpinned by domestic consumption.
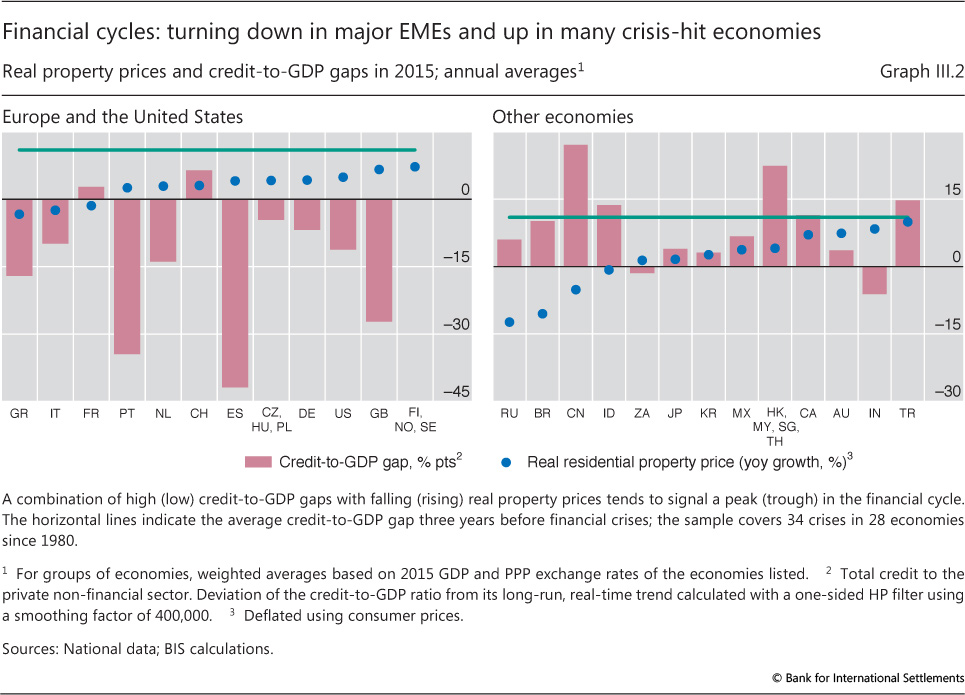
In countries at the centre of the financial crisis, including the United States, the United Kingdom and Spain, growth remained moderate in the wake of the balance sheet recession, but the financial cycle generally turned up. In the United States, growth was 2.4% in 2015 and continued at a similar pace in early 2016, constrained by US dollar appreciation. Real property price and credit growth picked up, gradually closing the credit-to-GDP gap (Graph III.2, left-hand panel). The euro area saw GDP expand by 1.6% in 2015, up from 0.9% in 2014. This pace of growth continued in early 2016 as the financial cycle kept recovering in most euro area economies, with increasing real property prices and credit-to-GDP gaps still negative. With consolidation efforts behind, fiscal headwinds waned.
In other advanced economies, developments varied. The expansion in Japan slowed in the second half of 2015 despite the fall in commodity import prices, with growth of 0.6% for the year. Canada returned to growth in the second half of 2015 after a mild recession triggered by a collapse in resource investment.
Box III.A
The concept and measurement of the financial cycle
The broad concept of the financial cycle encapsulates joint fluctuations in a wide set of financial variables, including both quantities and prices (see also Box IV.A in the 84th Annual Report). An obvious analogy is to the business cycle. The business cycle is often identified with movements in GDP, yet despite many years of research there is no universal agreement on which method to use. These can include an analysis of the unemployment rate or identifying turning points in a range of monthly indicators (as done by the NBER Business Cycle Dating Committee). Identifying the financial cycle is more challenging as there is no single aggregate measure of financial activity, even though a consensus has started to emerge that credit aggregates and asset prices, especially property prices, play a particularly important role. Methodologically, two different approaches have been proposed to measure the financial cycle more formally (the first two methods described below). In addition, insights from other strands of the literature can be used to pinpoint peaks and troughs (the third and fourth methods below). While the exact dates of turning points differ, the four methods discussed in this box generally coincide in identifying periods of expansion and contraction.
The turning point method dates the financial cycle with the same technique used by the NBER to date business cycles. Cyclical peaks and troughs are identified in real credit, the credit-to-GDP ratio and real property prices. Drehmann et al (2012) identify a turning point in the financial cycle if all these three series turn within a three- to six-year window.
The filter method uses a statistical filter to extract cyclical fluctuations of real credit, the credit-to-GDP ratio and real property prices and combines them into a single series. Specifics differ, but Drehmann et al (2012), for instance, rely on a bandpass filter to extract cyclical fluctuations between eight and 32 years in each of the series. They then take an average of the medium-term cycles in the three variables.
The early warning indicator (EWI) method builds on the financial crisis early warning indicator literature. In particular, large deviations of the credit-to-GDP ratio from a long-run trend have been found to provide a reliable single early warning signal. And the financial cycle is seen to turn once real residential property prices start to fall. On the flip side, a trough occurs when the credit-to-GDP gap is negative and property price growth turns positive, even though there is more uncertainty as property price growth sometimes fluctuates around zero for some time.
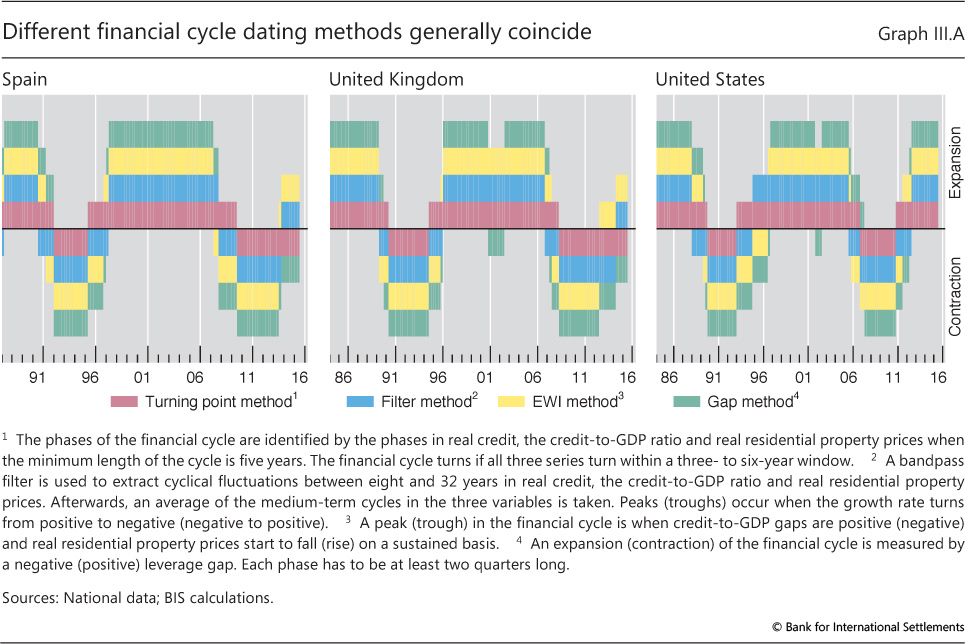
The gap method exploits insights from Juselius and Drehmann (2015) to decompose the financial cycle into two key variables that jointly pin down sustainable levels in the credit-to-GDP ratio. The first is the leverage gap, which is the deviation from the long-run equilibrium relationship between the credit-to-GDP ratio and key asset prices (real residential and commercial property prices and equity prices). The second is the debt service gap, which is the deviation from the long-run equilibrium relationship between the credit-to-GDP ratio and the average lending rate on outstanding debt. By embedding the gaps in a vector autoregressive system, the authors find that they are the key link between financial and real developments. Most importantly, a high debt service gap - when a high fraction of income is used to pay interest and amortise debt - significantly reduces expenditure. The leverage gap, on the other hand, is the key determinant of credit growth, boosting it when it is negative, ie when asset prices are high relative to credit-to-GDP ratios. Given that it embeds both credit and asset price dynamics, a negative (positive) leverage gap is associated with the expansion (contraction) of the financial cycle.
As an illustration, the expansion and contraction phases of the financial cycle for Spain, the United Kingdom and the United States generally coincide based on the four methods outlined above (Graph III.A). While close, the exact timing of turning points differs across methodologies. Otherwise, the only difference between methodologies emerges during the dotcom bust, after which the gap method identifies a contraction in the financial cycle in the United Kingdom and the United States, in contrast to the other approaches. This most likely arises because this is the only method that also includes information from equity prices, which were more volatile at the time.
While the four different methods provide a coherent picture of the financial cycle, in particular in retrospect, it is clear that none is sufficient to perfectly classify countries into different phases. For instance, currently all methods suggest that the financial cycle is expanding in the United States, but there remains more ambiguity for Spain and the United Kingdom. Given the heterogeneity in financial booms and busts, including owing to structural developments, it could be useful to rely on a broader range of indicators, including credit spreads, risk premia, default rates and proxies for risk perceptions and risk appetite.
See M Drehmann, C Borio and K Tsatsaronis, "Characterising the financial cycle: don't lose sight of the medium term!", BIS Working Papers, no 380, June 2012; and M Terrones, M Kose and S Claessens, "Financial cycles: What? How? When?", IMF Working Papers, no WP/11/88, April 2011. See D Aikman, A Haldane and B Nelson, "Curbing the credit cycle", The Economic Journal, vol 125, no 585, June 2015, pp 1072-109; and P Hiebert, Y Schuler and T Peltonen, "Characterising the financial cycle: a multivariate and time-varying approach", ECB Working Paper Series, no 1846, September 2015. See C Borio and M Drehmann, "Assessing the risk of banking crises - revisited", BIS Quarterly Review, March 2009, pp 29-46; C Detken, O Weeken, L Alessi, D Bonfim, M Boucinha, C Castro, S Frontczak, G Giordana, J Giese, N Jahn, J Kakes, B Klaus, J Lang, N Puzanova and P Welz, "Operationalising the countercyclical capital buffer: indicator selection, threshold identification and calibration options", European Systemic Risk Board, Occasional Paper Series, no 5, June 2014; and M Schularick and A Taylor, "Credit booms gone bust: monetary policy, leverage cycles, and financial crises, 1870-2008", American Economic Review, vol 102, no 2, April 2012, pp 1029-61. The leverage and debt service gaps are identified by the cointegration relationship between the component series. See M Juselius and M Drehmann, "Leverage dynamics and the real burden of debt", BIS Working Papers, no 501, May 2015.
As commodity prices slumped and growth slowed in many EMEs, the domestic financial cycle remained in an upswing in many of them but turned down in others. In China, growth eased to 6.9% in 2015 and continued at a similar pace in early 2016, with the financial cycle in retreat as property prices fell after a large, sustained increase in the credit-to-GDP ratio (Graph III.2, right-hand panel). The downturn in manufacturing and construction in China sapped commodity demand. Commodity price declines saw trade values and growth plunge for commodity exporters, although exchange rate depreciations cushioned the size of export falls in local currency terms (Graph III.1, centre panel). In India, growth picked up a little to 7.6% as the financial cycle gained momentum. In both Brazil and Russia, GDP contracted sharply, by 4%, and the financial cycle downturn compounded the drop in export prices and large currency depreciations. In other EMEs, including Turkey and Mexico, the financial cycle remained in an upturn.
The reduction in spare capacity in the United States and expected gradual monetary policy tightening boosted dollar appreciation. This coincided with signs of tighter global liquidity conditions, as US dollar borrowing outside the United States tapered off in late 2015. As capital inflows ebbed, commodity exporters and EMEs saw large currency depreciations into the first months of 2016. Subsequently, capital inflows resumed, and currencies recovered some of the earlier losses.
Overall, labour markets presented a more optimistic view of economic developments than did GDP. Labour markets tightened in most economies by more than expected in 2015 despite growth a bit below expectations (Graph III.1, right-hand panel). Commodity-exporting economies were the exception, with unemployment rates typically increasing by more than anticipated, in some cases significantly. There has been a substantial tightening in most labour markets since the crisis and in some there is only moderate slack, although unemployment rates remain high in many European economies, particularly for the young.
The fairly bright overall picture painted by labour markets contrasts with the view that "anaemic" growth characterises the still "ongoing" recovery. That pessimistic interpretation seems rooted in the expectation of a return to pre-crisis headline (as opposed to per working age person) output growth if not to the pre-crisis output path. The questions these contrasting impressions raise about the state of the economy are critical for guiding the policy response (see below).
Large shifts in relative prices require big adjustments
The large exchange rate shifts and further commodity price falls represent sizeable changes in the relative prices that have guided investment and financing decisions for the best part of 15 years. If these changes persist, they will require significant restructuring in many economies. The transitions and realignments are likely to be a drag on growth in the near term. But they should eventually allow renewed and, above all, more sustainable and resilient growth, both in advanced economies and EMEs.
Commodity prices continued to fall
Oil prices have plummeted since mid-2014, overtaking the drops in other commodity prices, which have been declining for almost five years (Graph III.3, left-hand panel). The prospect of weaker demand, on top of steadily growing supply, hit crude markets hard: oil prices extended the slide of the second half of 2015, falling sharply to below $30 per barrel in mid-January 2016, a price not seen since 2003. In real terms, this was the largest decrease over any two-year period since the oil price became market-determined in the early 1970s. By May, the price had rebounded, but Brent was more than 50% below the high plateau observed between mid-2010 and mid-2014. The price declines for base metals and foodstuffs have been smaller over the past year, not least because their prices had already dropped substantially.
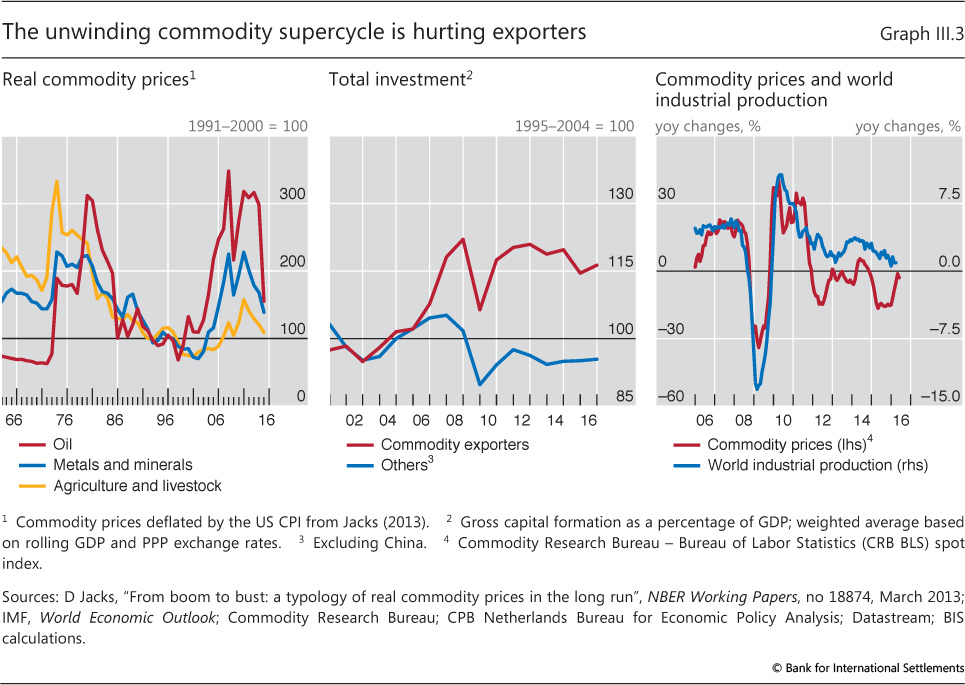
The surge in real commodity prices from the early 2000s and the subsequent decline have traced a supercycle comparable to the one in 1973-86. The most recent boom was driven by the robust growth of resource-intensive industries in China and other EMEs, supported by global liquidity conditions. The surge was only briefly interrupted by the sharp price drops at the peak of the crisis in late 2008. Highly stimulative monetary and fiscal policies put in place with the onset of the crisis and the resulting debt-fuelled spending, notably in China, swiftly brought commodity prices back to soaring heights. By late 2009, the real prices of all commodities were again at levels comparable to (or higher than) those seen in 2008.
Continued buoyant investment in infrastructure and construction, boosted by cheap and readily available borrowing and rapid growth in manufacturing, sustained the surge in the demand for raw materials. This lifted investment and growth more generally in commodity-exporting economies, both advanced and emerging (Graph III.3, centre panel). The resulting increased capacity came on line as demand growth moderated, especially in manufacturing (Graph III.3, right-hand panel). Thus, prices dropped, repeating the classic "hog cycle" typical of commodity markets.
For oil, the increase in demand was broader than for most other commodities, but the confluence of easy financing conditions and supply expansions was every bit as prominent. New firms borrowed heavily to increase shale oil production in the United States. From 2006 to 2014, oil and gas companies' bonds and syndicated loans grew at an annual rate of 14%. The high level of debt can have persistent effects. As credit conditions tighten, highly leveraged producers may maintain, or even increase, output even as the oil price falls in order to meet interest and debt repayments. Moreover, they will be more inclined to hedge exposure in derivatives markets. Dynamic hedging by their counterparts may add downward pressure to the spot market for some time. Increased supply has clearly contributed to the sharp price drop since mid-2014, reflecting not only the resilience of US shale oil production but, crucially, OPEC's reluctance to curtail output - a game changer.
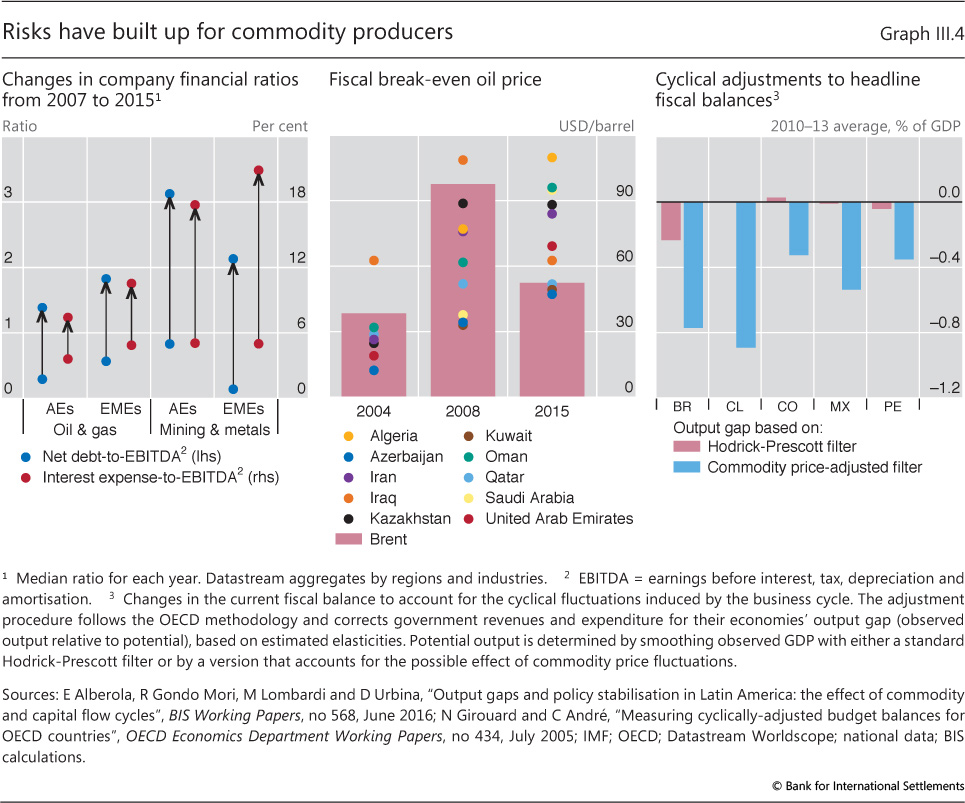
The borrowing surge extended beyond oil and gas firms to other commodity producers. The debt issued by a broad range of commodity firms in advanced economies increased at an annual rate of 12% from 2005 to 2015. For EME firms, the growth was even higher, at 17%. In total, by December 2015 commodity firms had $4 trillion of debt outstanding globally. As their revenues sank, the debt service burden grew, despite historically low interest rates (Graph III.4, left-hand panel). In some cases, debt sustainability could come into question. But for many economies, the biggest risk may derive from sharp economic contractions induced by firms' and households' spending retrenchment and, critically, strongly procyclical fiscal policy.
Waiting for the fillip to growth from lower commodity prices
For the world as a whole, the net impact of lower commodity prices induced by a cheaper and more ample supply of a key production input should be positive. But the size and timing are uncertain and depend on demand patterns.
Commodity-importing economies should benefit through terms-of-trade gains. Consumers, in particular, have historically boosted their expenditure. However, in the past year the expected fillip to growth failed to materialise to the extent expected. One reason could be that highly leveraged consumers used at least part of the income windfall to reduce debt. Indeed, over the period of falling oil prices household consumption growth picked up by about 1.5 percentage points less in the economies where household debt had increased most rapidly between 2000 and mid-2014 relative to those where it had risen more moderately. For firms, the uncertainty that has constrained investment in recent years may have contributed to the muted response.
For commodity producers, most of which are EMEs, the lower commodity prices are undoubtedly a net headwind. One clear channel is the sharp decline in investment. In 2015, investment fell by 2.5% for a selection of commodity-exporting EMEs, a major pullback from the 4.1% growth expected for 2015 as of January 2014, when commodity prices were much higher. And over the course of 2015, expected investment growth for 2016 was also cut from 3.3% to -0.5%. This would add to the reduction in consumer spending, as terms-of-trade losses sap real incomes.
Procyclical government spending was another headwind for EME commodity exporters. Tax revenue sinks directly with the lower income from governments' commodity assets and royalties, and indirectly with weaker economic activity. Historically, it has not been possible to smooth out this revenue shortfall with debt, as investors' confidence in the sovereign wanes and both sovereign and corporate bond spreads widen. This time around, governments in commodity-exporting countries had partly saved the gains early in the boom. But as growth sputtered post-crisis despite commodity prices remaining high, fiscal consolidation stalled and debt stabilised or even increased. Overall, as prices fell, oil exporters with increased spending commitments were badly hit: the oil prices required to achieve fiscal balance soared (Graph III.4, centre panel).
The fiscal problem reflects in part the inherent difficulty of assessing fiscal positions during the boom, which depends on imprecise estimates of the cyclical component of output or the "output gap". Much like what happens with credit booms (Chapter V), a commodity price upswing may artificially boost potential output estimates, thereby concealing weak fiscal positions. The right-hand panel of Graph III.4 presents real-time estimates of cyclical adjustments to structural fiscal balances for a group of large Latin American commodity exporters, based on standard measures of the output gap alongside those adjusted for the commodity cycle.2 When corrected for commodity price fluctuations, structural fiscal deficits during 2010-13 are significantly larger than those standard methods suggest. Fiscal policies were too loose during the boom years.
Floating (and sinking) exchange rates
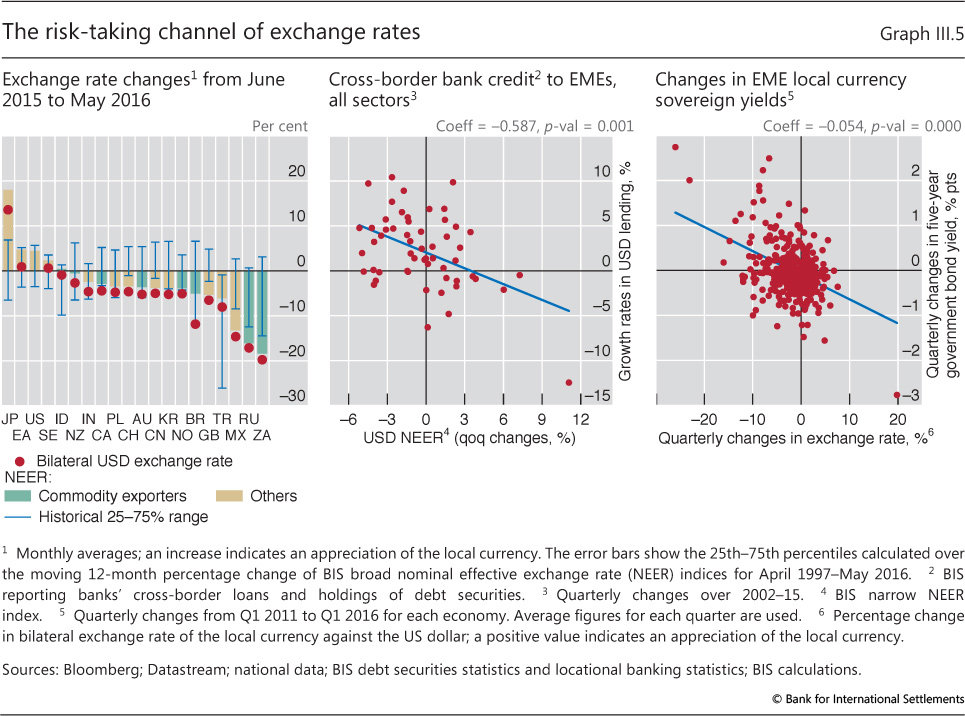
The past year saw further large exchange rate shifts driven by the US dollar. For some EMEs, these shifts were outside the interquartile range of yearly changes of the past 20 years (Graph III.5, left-hand panel). In nominal effective terms, the dollar appreciated by 9% from May 2015 to January 2016, but then retraced some of this, so that the appreciation over the year to May was just 4%. Many currencies depreciated against the dollar and in nominal effective terms. The euro and yen nominal effective exchange rates appreciated by 5% and 18% over the year to May despite further monetary easing. EMEs and commodity exporters saw the largest depreciations. The currencies of Russia, South Africa and Brazil depreciated by 16%, 18% and 5%, respectively, in nominal effective terms, in part reflecting domestic factors. The renminbi depreciated slightly in nominal effective terms and vis-à-vis the dollar.
These exchange rate shifts may affect macroeconomic outcomes through at least two channels. The first works through changes in balance sheets and financial risk-taking.3 A depreciation tends to weaken the balance sheets of entities that have net foreign currency liabilities. This may induce spending cuts. It also worsens credit conditions more broadly as their (bank and non-bank) lenders' risk-taking capacity diminishes, curtailing credit to others as well. The second channel works through trade (expenditure switching): a depreciation should improve net exports and add to domestic absorption, at least if the central bank does not raise rates to fend off inflation. Thus, exchange rate changes transfer demand from the appreciating to the depreciating jurisdictions.
The risk-taking channel looms large for EMEs
Greater financial integration has probably increased the influence of the exchange rates of major international funding currencies on global financial conditions, especially in EMEs. This is highlighted by the substantial growth in the stock of US dollar-denominated debt of non-banks outside the United States, to $9.7 trillion at end-2015, with $3.3 trillion of this to EMEs, a doubling since 2009.4
The exchange rate risk-taking channel has both a quantity and a price dimension. Research has documented a relationship between local currency appreciation against the dollar and increasing bank leverage, credit growth and bond portfolio inflows, as well as declining sovereign yield spreads against US Treasuries and CDS spreads.5
The quantity side works through changes in the credit supply to domestic firms when the value of their local currency changes. As a local currency depreciation shrinks the collateral value of domestic firms' assets to foreign lenders, this reduces the latter's capacity to extend credit - for instance, through a value-at-risk (VaR) constraint.6 While the mechanism is stimulative for appreciations, the retrenchment may be larger and more abrupt for the depreciations that follow prolonged appreciations, because of a build-up of a large stock of liabilities and currency mismatches during the upswing. The expansionary effect for EMEs is illustrated in the centre panel of Graph III.5. A 1% depreciation of the dollar is associated with a 0.6% increase in the quarterly growth rate of US dollar-denominated cross-border lending.
The price dimension works through widening credit spreads when the domestic currency depreciates and risk-taking decreases. This relationship between exchange rates and financial conditions is illustrated in the right-hand panel of Graph III.5. When the local currency appreciates, EME local currency sovereign yields fall. Currency appreciation and looser financial conditions go hand in hand.
This risk-taking channel is potent for EMEs but has no apparent role in advanced economies (Box III.B). An exchange rate depreciation (against the international financing currencies) leads to a contraction of GDP in EMEs, but not in advanced economies. Moreover, the impact in EMEs is quick but recedes somewhat with time.
The trade channel is more potent in advanced economies than EMEs
An exchange rate depreciation stimulates output through the trade channel, but its efficacy can depend on a number of factors. For example, the channel will be more potent the larger the trade share of GDP and the more responsive prices of tradeable goods are to the exchange rate. The trade channel is found to be important for both EMEs and advanced economies, even when controlling for the financial channel (Box III.B). For both groups of countries, the stimulus builds over time: the boost to growth is smaller in the short than in the long run. Overall, this evidence suggests that for EMEs the risk-taking channel is a significant offset to the trade channel, especially in the short run.
Recent studies generally suggest that trade exchange rate elasticities have declined in response to changes in trade structures, including currency denomination, hedging and the increasing importance of global value chains. For instance, a World Bank study finds that manufacturing export exchange rate elasticities almost halved between 1996 and 2012, with almost half of this decrease due to the spreading of global supply chains.7 An OECD study also finds small trade elasticities: in G3 economies, a 10% depreciation increases the trade balance only 0.4-0.6 percentage points.8 By contrast, a recent IMF study argues that exchange rates continue to have a sizeable effect on the value of net exports - with a 10% depreciation improving the trade balance by 1.5 percentage points. That said, the same study does find some evidence that the price elasticity of trade volumes has declined in recent years.9
Two interrelated financial factors may explain the lessening in trade sensitivities in advanced economies: the simultaneous nature of deleveraging and the lingering effects of the crisis. For instance, recent research finds that a boom in household debt tends to go hand in hand with currency appreciation, a stronger increase in imports and a bigger deterioration in net trade. After the bust, depreciation and a boost to net exports typically help offset the deleveraging-induced drag on growth. But this mechanism may be substantially weaker when several countries deleverage simultaneously.10 In addition, a depreciation may also have smaller effects on exports in the aftermath of a financial crisis if lack of funding, resource misallocations and high uncertainty constrain the output response.
Box III.B
Exchange rates: stabilising or destabilising?
Economists have extensively studied the stabilising role of exchange rates through the adjustment of relative prices and the trade balance. Recent literature has also identified various financial channels through which exchange rates can affect economic activity. This box presents initial evidence that these financial effects are economically significant for output in EMEs.
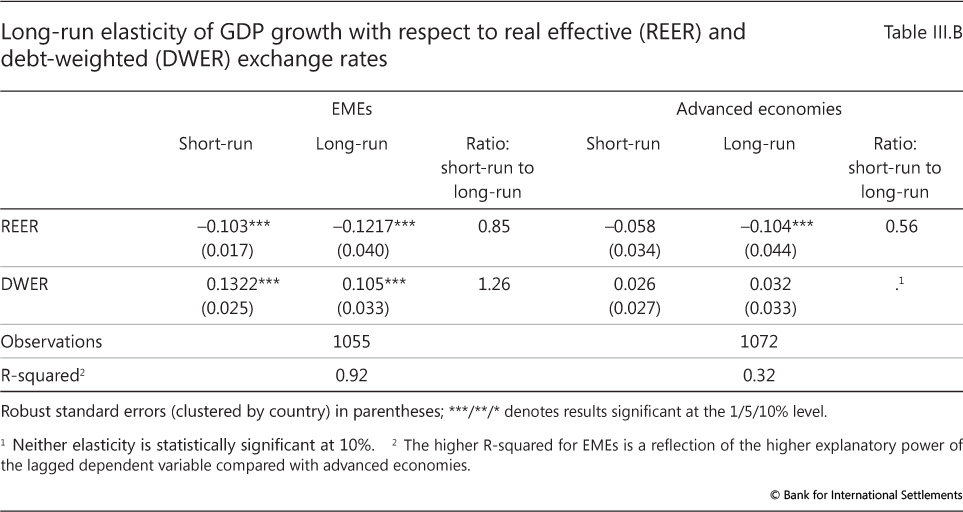
A simple model can shed some light on the relative importance of the trade and financial channels for advanced and emerging economies. The model is an autoregressive distributive lag (ARDL) specifying GDP as a function of both the trade-weighted real effective exchange rate (REER) and a debt-weighted nominal exchange rate (DWER). The DWER for each country weights its bilateral exchange rates against each of the five major global funding currencies (US dollar, euro, Japanese yen, pound sterling and Swiss franc) by the shares of these global funding currencies in that country's foreign currency debt (both domestic and international). This is a conceptual improvement over the practice of using the US dollar bilateral exchange rate to capture financial effects, because it acknowledges the relative importance of other funding currencies in the liability structure of each country.
The sample comprises a quarterly panel of 22 EMEs and 21 advanced economies over the period 1980-2015. In addition to the two exchange rate indices, various controls are included to limit endogeneity concerns.
Table III.B displays the short- and long-run elasticities of GDP growth with respect to the two exchange rate measures separately for EMEs and advanced economies. There is strong evidence of the stimulative effects of exchange rate depreciations through the trade channel: for both groups of countries, the elasticity of the trade-weighted exchange rate is negative. The magnitudes are also similar, indicating that a 1 percentage point REER depreciation leads to an increase in GDP growth of 10-12 basis points on average in the long run. By contrast, only EMEs show evidence of the financial channel: a 1 percentage point depreciation of the DWER implies a 10 basis point decrease in their GDP growth in the long run. The corresponding effect is much smaller and not statistically significant for advanced economies.
The ratios of short- to long-run elasticities reported in Table III.B indicate that the financial channel overshoots in the short run and has a larger short-run impact than the trade channel. For EMEs, the short-run elasticity of the DWER is larger than its long-run elasticity, implying that the initial impact fades somewhat over time. By contrast, for both EMEs and advanced economies, the REER long-run elasticity is larger than the short-run elasticity, meaning that the trade channel effect builds with time. For EMEs, the DWER's short-run elasticity is larger in absolute magnitude than that of the REER. This result provides tentative evidence for EMEs that in the short run, the effects of the financial channel dominate those of the trade channel so that an equal depreciation of the DWER and REER may be initially contractionary. For EMEs, a depreciation seems to provide only a small boost to GDP, and only after some quarters.
The panel is unbalanced and restricted by data availability, especially in the early part of the sample.
The full model specification is as follows:
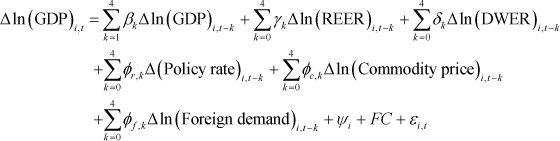
Foreign demand is measured as an export-weighted sum of foreign GDP. FC denotes a dummy variable representing the financial crisis (2008-09) and  is a country fixed effect. The model was also estimated country by country using variation only in the time dimension. Results were qualitatively similar. In terms of magnitude, the median elasticities were higher than the ones obtained with the panel regressions. For instance, for EMEs the long-run median REER elasticity is -0.28 and the long-run DWER elasticity is 0.31.
Changing interdependence
With growth in some EMEs slowing and financial strains increasing, it is crucial to understand the extent to which these developments can spill over globally. Spillovers from EMEs to advanced economies have increased over time, as EMEs have accounted for a larger share of global trade and output growth - around 80% since 2008. While financial linkages have deepened, financial spillovers to EMEs remain more potent than those in the opposite direction. Spillovers depend not just on the size of interlinkages but also on the nature of the shocks (common or country-specific) and on various shock absorbers. The current global slowdown and risks resulting from the previous run-up in EME external debt and recent tightening global liquidity conditions are a case in point.
Increasing trade spillovers from EMEs
Increased trade is an important channel of greater spillovers from EMEs to advanced economies. EMEs now account for around 45% of global trade, up from just over 30% in 2000. The intensity of spillovers will depend on the size and nature of an economy's trade flows. Of particular note, China's rapid growth and increased trade openness have seen it account for a growing share of many countries' exports, particularly commodity exporters (Graph III.6, top panel).
These spillovers are changing as China rebalances from investment-led growth towards a more service-oriented economy. Slower growth in construction and industry (the secondary sector) and a fall in the corresponding output prices resulted in virtually no growth in nominal value added for this sector in 2015. This is already having large spillovers to both commodity producers and capital goods exporters through drops in the value of their exports (Graph III.1, centre panel). Growth that is more services-intensive has smaller spillovers, given that services account for only around 10% of imports despite being around half of GDP.
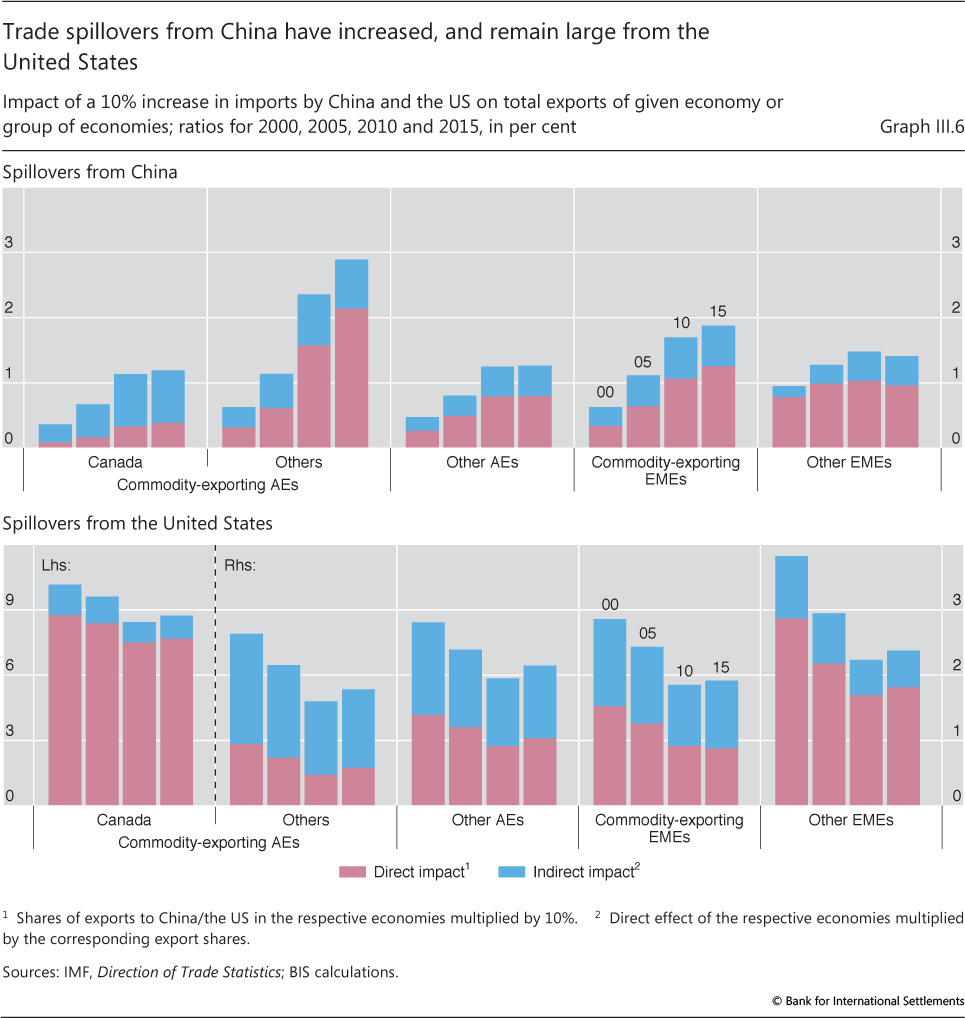
In contrast to the significant rise in exports destined for China, the share of most countries' exports to the United States has remained stable or declined a little over the past 15 years (Graph III.6, bottom panel). Despite this, US demand is still more important than China's for most countries' exports.
Trade spillovers can also occur through a third country that imports intermediate inputs used in the production of its own exports. As a result, for many advanced and commodity-exporting EMEs the indirect impact of a reduction in US imports is large relative to the direct effect (the blue bars are large relative to the red bars in the bottom panel of Graph III.6). Spillovers from other major advanced economies also remain important for both advanced and emerging market economies.
Larger spillovers and spillbacks through the financial channel
Financial spillovers from EMEs have increased along with their international liabilities and assets and other financial links. True, EMEs still appear to be more a destination than a source of financial spillovers. However, financial spillovers to EMEs can cause a gradual accumulation of imbalances which can later result in substantial spillbacks to advanced economies.
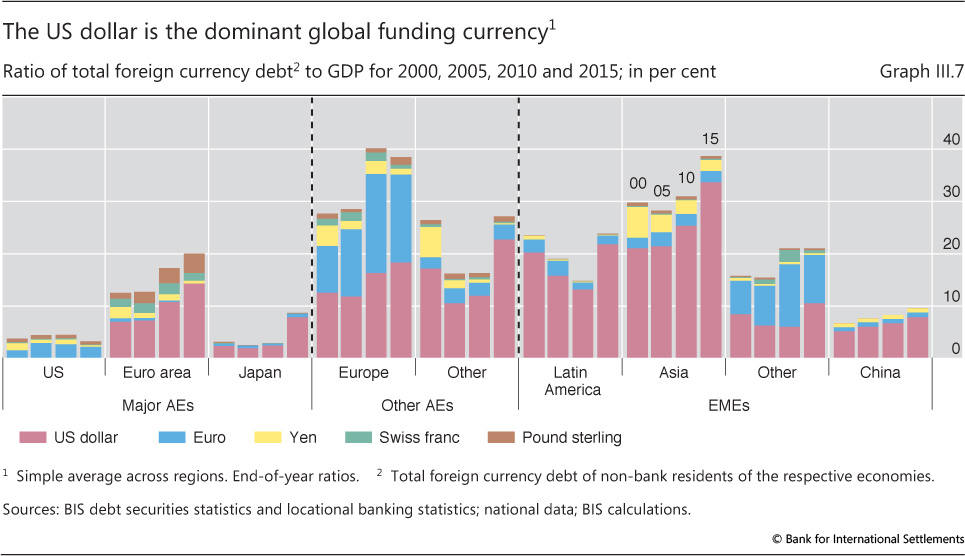
A critical channel for financial spillovers, particularly to EMEs, is external borrowing, especially in international funding currencies. Most of this borrowing is in US dollars, increasing the importance of US financial conditions (Graph III.7). While other advanced economies also borrow in foreign currencies, more of that borrowing tends to be hedged, reducing vulnerabilities. Swings in the availability and cost of external borrowing can amplify domestic leverage and have outsize effects when borrowers face financial distress.
The accumulation of a large stock of foreign currency-denominated debt in EMEs has heightened the potential for spillbacks to advanced economies. Low US interest rates and a depreciating dollar have boosted credit, asset prices and growth in EMEs for quite some time. A turn in global liquidity conditions induced by prospects of higher US interest rates could trigger a reversal of easy liquidity conditions, as appeared to be the case during the period under review before markets regained their balance following the turbulence in early 2016 (Chapter II).
Spillovers to advanced economies from EME ownership of specific advanced economy assets, such as sovereign bonds, have increased. The reduction in holdings of US bonds was arguably one factor contributing to moves in US yields over the past year (Chapter II). By contrast, spillovers to advanced economies through wealth effects from direct ownership of EME assets are generally small, in line with the share of EME assets in advanced economy portfolios.
Larger spillovers can occur through the impact on advanced economies' asset prices. The sensitivity of equity prices to sharp moves in Chinese equity prices over the past year (Chapter II) highlights the growing importance of this channel.
A dose of growth realism
Since the financial crisis, headline GDP growth in both advanced and emerging market economies has consistently fallen short of forecasts and pre-crisis norms. The resulting debate on the causes and implications of seemingly lacklustre growth is a critical backdrop for policy considerations. Whether growth is indeed underwhelming cyclically or structurally, and whether this results from deleveraging (part of the so-called debt supercycle - outsize financial booms gone wrong), factor misallocation, secular stagnation, technological slowdown or some other cause, influences not just the appropriate policy response but what policies can plausibly achieve. Unrealistic expectations of an economy's growth potential, structural and cyclical, can lead to excessive reliance on demand management policies. The end result may be an economy that bears the costs of activist policies without the anticipated benefits.
An economy's growth potential is conventionally thought to be determined by the expansion in aggregate supply, with demand having only a short-term influence. However, secular stagnation posits that protracted weak demand has been a persistent constraint on growth.11 This section assesses growth potential in the light of the explanations above, by considering the key determinants of supply and demand. The causes of low growth are varied, but not least among them is the impact of the run-up in debt and its legacy.
Slower growth of supply
To a large extent, most economies' weaker growth in recent years reflects slower expansion of supply attributable to the factors of production, labour and capital, and to productivity.
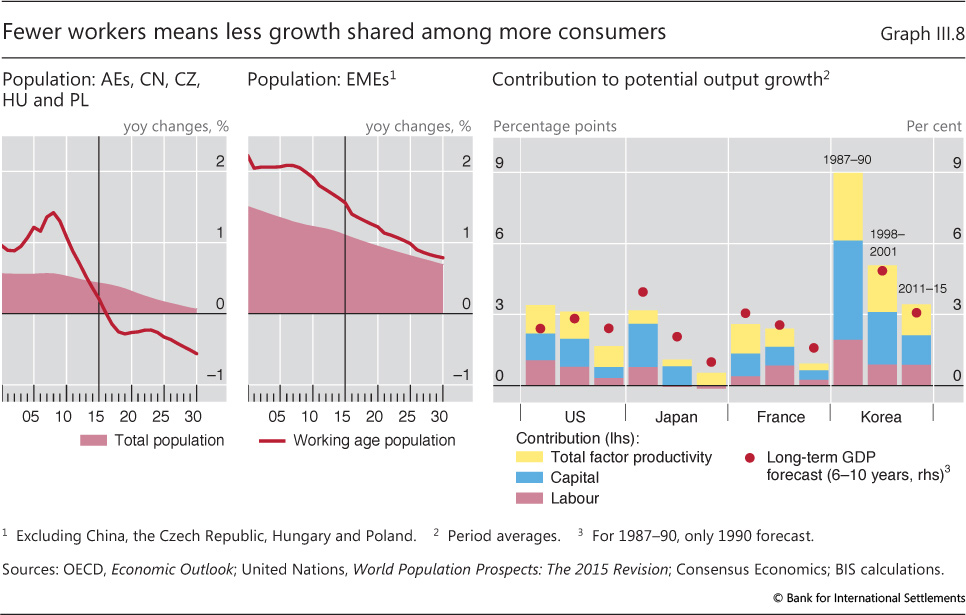
The structural decline in labour force growth due to demographic factors is reducing potential output growth in almost all countries. The effect is large: while global GDP growth was 0.5 percentage points below its 1987-2007 average in 2015, growth of global GDP per working age person was actually 0.2 percentage points above its average (Graph III.1, left-hand panel). In Europe and other advanced economies, the baby boom generation is now reaching retirement. As a result, working age population growth is slowing sharply, by close to 1 percentage point in just a decade, and is already negative (Graph III.8, left-hand panel). In China, its decline is even more extreme, in excess of 2 percentage points. In other EMEs, working age population growth has also slowed, but remains positive (Graph III.8, centre panel). Even accounting for the partly offsetting influence of greater labour force participation - resulting from various policies, such as higher retirement ages, social trends and better health - labour's contribution to potential output growth has fallen (Graph III.8, right-hand panel).
Slower accumulation of physical capital through investment has also contributed to weaker potential output growth post-crisis in advanced economies, but not in EMEs. Despite exceptionally easy financial conditions, firms in advanced economies have been unwilling to invest. A major reason for this appears to be uncertainty about future demand and thus profitability.12 For some firms, cash hoarding and borrowing in order to buy back shares or pay dividends point towards this apparent dearth of attractive investment opportunities.13 For others, the hangover from the run-up in debt appears to be restraining investment. While new finance has been cheap, and easy to obtain for most firms, the need to reduce the high leverage built up pre-crisis has weighed on investment in some countries.
A productivity growth slowdown over the past decade has also contributed to slower potential output growth. In addition to the impact of lower investment, some evidence suggests that one factor may be the persistent impact of the credit boom-induced misallocation of labour into weaker productivity growth sectors.14 In addition, the current exceptionally easy financial conditions can create incentives for banks to evergreen loans, keeping otherwise unproductive firms alive. Those conditions may be detrimental to a swift reallocation of capital and labour, and distort competition across the economy.15 A final, often cited factor might be a slowdown in technological progress, but this is less useful for explaining the decline in productivity growth that has also been seen in countries not at the technological frontier.16
Is demand structurally deficient?
GDP growth has been disappointing post-crisis. A key question is whether this is drawn-out cyclical weakness resulting from the after-effects of excess leverage, or reflects structurally deficient demand, which could interact harmfully with supply side factors.
Some structural factors have clearly weighed on demand growth. For instance, population ageing has meant that more people are in pre-retirement cohorts that tend to have higher saving rates. Rising wealth and income inequality in some countries may also foster an increase in savings. In addition, firm investment demand may be weaker because of the relative growth of less capital-intensive industries.
However, a number of observations are at odds with the secular stagnation hypothesis. Notably, job creation and the general improvement in labour markets post-crisis argue against demand growth being deficient. It is also hard to see secular stagnation as a global phenomenon. Many EMEs have low capital stocks, and so their potential demand for investment is substantial. Even in its original context for the United States, secular stagnation sits at odds with the large US current account deficit at the time, which saw domestic demand outstripping supply while global growth was also strong with full employment.
Moreover, other factors contributing to weak demand may be persistent, but will subside with time. Following the substantial run-up in household debt pre-crisis, households in many advanced economies have sought to reduce their leverage or at least take on less new debt, temporarily increasing their saving rate. Further, persistently low interest rates may have weakened demand from households whose income relies heavily on interest earnings, or which are trying to attain a savings target, in particular for retirement.
Finally, supply side constraints may themselves have been weakening demand, akin to how weak demand can undercut supply through skill loss and slower capital accumulation. For instance, if resources are able to shift towards their best use more flexibly, this can unlock effective demand as incomes and investment rise. And increasing competition or allocating credit more effectively can stimulate both supply and demand. Thus, the legacy of the previous unsustainable financial boom may have been weighing on demand also through these channels.
The reality of slower growth, unless-?
Assessing the persistence of other recent headwinds has important implications for the growth that can realistically be achieved in coming years.
Some headwinds to growth will probably subside with time. The stock of debt increased greatly in many economies in the run-up to the Great Financial Crisis, and in others in the years since. But the resulting headwinds from deleveraging and factor misallocation will gradually wane, boosting potential growth. The sharp shifts of exchange rates and commodity prices are likely to impede growth in some economies for some time, but this too will subside.
Other headwinds, however, are not expected to disappear. Ageing populations will continue to weigh on output growth. The slowdown in working age population growth is substantial and powerful. Abstracting from offsets from higher labour force participation, it is reducing GDP growth by 1 percentage point over a decade for a range of countries.
Setting adequate policy priorities requires realistically assessing possible outcomes. For many economies, potential growth is already lower than in earlier decades, and will continue to be so in the coming years (Graph III.8, right-hand panel). To counteract these headwinds, it is essential to implement long-run supply side reforms in order to boost productivity growth (see the 83rd and 84th Annual Reports). This would also help to reduce the burden on monetary policy to sustain economic activity across the globe.
1 See J Caruana, "Credit, commodities and currencies", lecture at the London School of Economics and Political Science, 5 February 2016.
2 The real-time estimates of the output gaps used for the cyclical adjustment are based on country data available at the time of estimation; cyclical adjustment is then conducted according to the OECD methodology described in N Girouard and C André, "Measuring cyclically-adjusted budget balances for OECD countries", OECD Economics Department Working Papers, no 434, July 2005. For further details on the methodology, see E Alberola, R Gondo Mori, M Lombardi and D Urbina, "Output gaps and policy stabilisation in Latin America: the effect of commodity and capital flow cycles", BIS Working Papers, no 568, June 2016.
3 On the risk-taking channel of the exchange rate, see V Bruno and H S Shin, "Global dollar credit and carry trades: a firm level analysis", BIS Working Papers, no 510, August 2015. For a more comprehensive discussion of the risk-taking channel of monetary policy transmission, see C Borio and H Zhu, "Capital regulation, risk-taking and monetary policy: a missing link in the transmission mechanism?", Journal of Financial Stability, vol 8, no 4, December 2012, pp 236-51.
4 These data are discussed in R McCauley, P McGuire and V Sushko, "Dollar credit to emerging market economies", BIS Quarterly Review, December 2015, pp 27-41.
5 For evidence of impact on capital markets, see B Hofmann, I Shim and H S Shin, "Sovereign yields and the risk-taking channel of currency appreciation", BIS Working Papers, no 538, January 2016.
6 Even for firms with dollar-denominated revenue, a stronger dollar may coincide with weaker revenue, as in the case of oil firms where a stronger dollar tends to go together with weaker oil prices.
7 See S Ahmed, M Appendino and M Ruta, "Depreciations without exports? Global value chains and the exchange rate elasticity of exports", World Bank, Policy Research Working Papers, no 7390, August 2015.
8 See P Ollivaud and C Schwellnus, "The post-crisis narrowing of international imbalances: cyclical or durable?", OECD Economics Department Working Papers, no 1062, June 2013.
9 See IMF, "Exchange rates and trade flows: disconnected?", World Economic Outlook, October 2015, pp 105-38.
10 See A Mian, A Sufi and E Verner, "Household debt and business cycles worldwide", NBER Working Papers, no 21581, September 2015.
11 For a broad discussion of secular stagnation, see the papers in C Teulings and R Baldwin (eds), Secular stagnation: facts, causes and cures, VoxEU, August 2014.
12 See eg R Banerjee, J Kearns and M Lombardi, "(Why) Is investment weak?", BIS Quarterly Review, March 2015, pp 67-82; M Bussière, L Ferrara and J Milovich, "Explaining the recent slump in investment: the role of expected demand and uncertainty", Bank of France, Working Papers, no 571, September 2015; and M Leboeuf and R Fay, "What is behind the weakness in global investment?", Bank of Canada, Staff Discussion Paper 2016-5, February 2016.
13 See A van Rixtel and A Villegas, "Equity issuance and share buybacks", BIS Quarterly Review, March 2015, pp 28-9.
14 See C Borio, E Kharroubi, C Upper and F Zampolli, "Labour reallocation and productivity dynamics: financial causes, real consequences", BIS Working Papers, no 534, January 2016.
15 For an analysis of zombie lending and its consequences in Japan, see R Caballero, T Hoshi and A Kashyap, "Zombie lending and depressed restructuring in Japan", American Economic Review, vol 98, no 5, December 2008.
16 On the technological slowdown, see eg R Gordon, "Is US economic growth over? Faltering innovation confronts the six headwinds", NBER Working Papers, no 18315, August 2012. However, there is no consensus that technological innovation has slowed, with others arguing it will persist or even accelerate; see eg J Mokyr, "Secular stagnation? Not in your life", in C Teulings and R Baldwin (eds), Secular stagnation: facts, causes and cures, VoxEU, August 2014; and E Brynjolfsson and A McAfee, The second machine age: work, progress, and prosperity in a time of brilliant technologies, WW Norton & Company, 2016.