Equity issuance and share buybacks
(Extract from pages 28-29 of BIS Quarterly Review, March 2015)
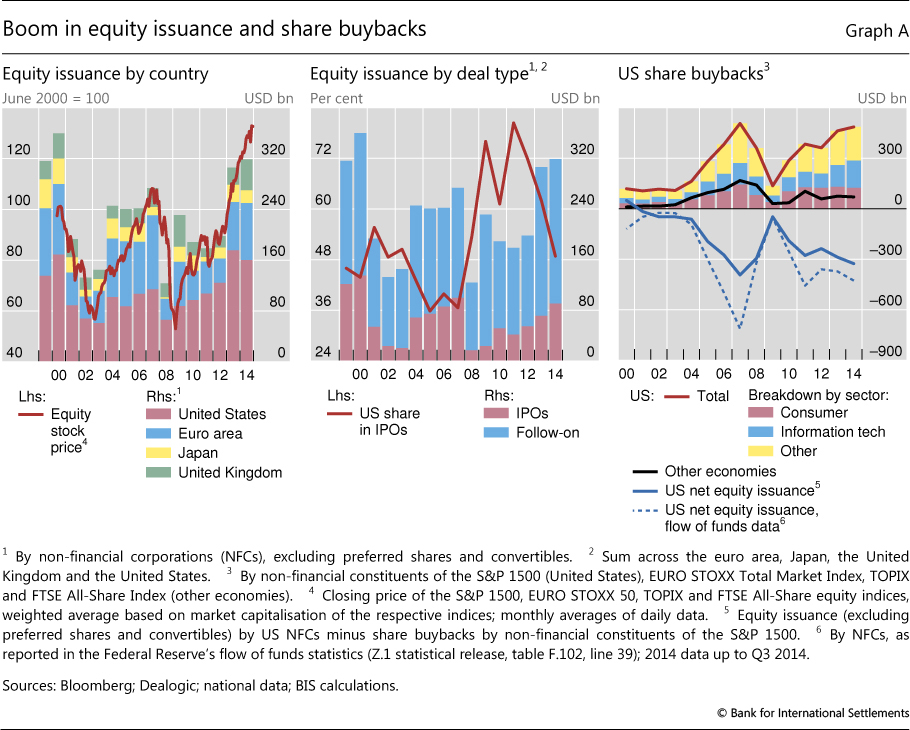
Non-financial corporations have been issuing large amounts of equity in gross terms in recent years. Against the backdrop of rising stock prices, those from the four largest advanced economies - the euro area, Japan, the United Kingdom and the United States - raised $625 billion in new equity during 2013-14, up 66% from the previous two years (Graph A, left-hand panel). US corporations raised more than half of the amount, while those in the euro area accounted for around one fourth. Issuance by firms that are already quoted ("follow-on" or secondary offerings) accounted for 74% of the total (Graph A, centre panel), and that of initial public offerings (IPOs) was 26%, around the same as in the previous two years. US non-financial corporations remained IPO leaders, but their share declined rather sharply, from around 70% at end-2012 to just below 50% at end-2014 (Graph A, centre panel, red line). UK firms, in particular, gained prominence.
Even as US non-financial corporations issued equity en masse, the amount raised on a net basis actually fell, as share buybacks exceeded issuance. Indeed, after a steep rise, in 2014 share buybacks approached their pre-crisis peak (Graph A, right-hand panel, red line). Such share repurchases totalled almost $950 billion in 2013-14. As a result, the corresponding share capital fell by at least $610 billion on net (Graph A, right-hand panel, blue line). And this figure is an underestimate, as it compares total equity raised by the aggregate US non-financial corporate sector as covered by Dealogic with share buybacks for the non-financial companies included in the S&P 1500 index only. The official US flow of funds statistics, which cover all non-financial corporations in the US and are methodologically more broadly based, show a larger decline in net new equity raised for 2013-14 (Graph A, right-hand panel, blue dashed line).
Since the mid-1980s, corporations have increasingly turned to share buybacks rather than dividends as a way to return cash to shareholders. The initial motivations were tax advantages and protection against the risk of hostile takeovers, although managements also used buybacks to signal the undervaluation of a firm.
 More recently, they have been associated more with management compensation policies, the reduction of free cash flows and outright share price support. Share repurchases have now overtaken aggregate dividends as the main form of corporate payout in the United States. The active use of share repurchases started much later in Europe. Despite their more rapid growth over the past decade, the value of European firms' share buybacks is still only a fraction of that of their US counterparts. And the total amount of buybacks by non-financial corporations included in broad stock price indices for the euro area, UK and Japan was $145 billion in 2013-14 (Graph A, right-hand panel, black line) - almost seven times smaller than that by US firms. Large IT firms (including Apple, IBM, Cisco, Oracle and Microsoft) accounted for around 30% of all share repurchases in the United States (Graph A, right-hand panel).
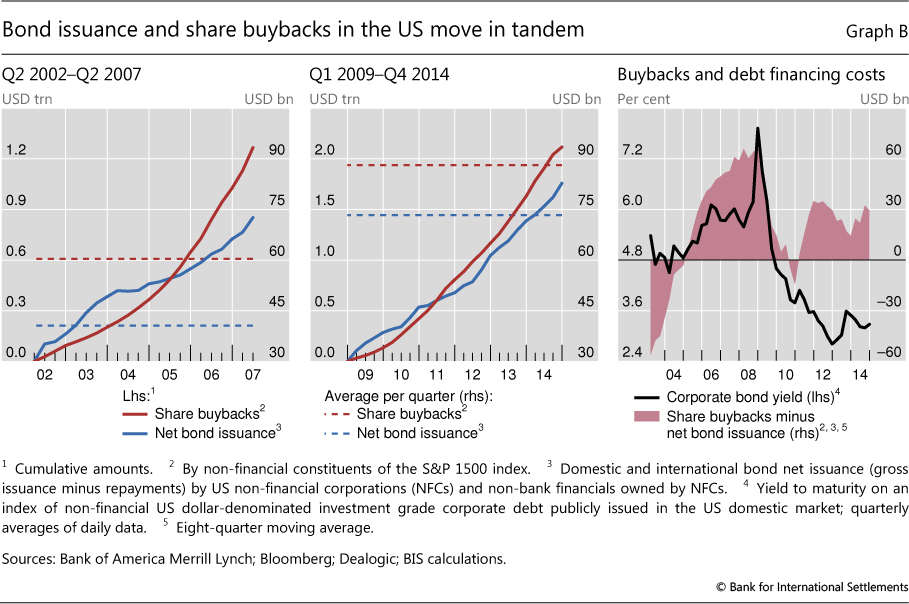
Share buyback booms in the United States have typically coincided with surges in net bond issuance, suggesting that the former have been financed, at least in part, through the latter. During the past 15 years, there have been two periods of rapidly growing share repurchases: Q2 2002-Q2 2007 and Q1 2009-Q4 2014 (Graph B, left-hand and centre panels). The net amount of bonds issued during these episodes moved in tandem with that of total buybacks (blue and red lines) and was supported by low or declining interest rates (Graph B, right-hand panel). All in all, Graph B suggests that when debt financing costs are favourable and equity markets are rallying, US non-financial corporations issue bonds heavily and use some of the proceeds to finance stock repurchases. During 2009-14, the average quarterly amount of net bond issuance was almost twice that during the previous boom (Graph B, left-hand and centre panels, dashed blue lines). US non-financial corporations repurchased $2.1 trillion in shares and raised $1.8 trillion in net bond financing in this period, compared to $1.3 trillion and $850 billion, respectively, during 2002-07.
Our calculations of net issuance do not include the effects of the exercise of stock options (positive net issuance) and debt or cash-funded mergers and acquisitions (negative net issuance). The latter probably accounts for why the US flow of funds data show a larger decline in net equity issuance. See ECB, "Share buybacks in the euro area", Monthly Bulletin, May 2007, pp 103-11; and D Skinner, "The evolving relation between earnings, dividends, and stock repurchases", Journal of Financial Economics, vol 87, 2008, pp 582-609. On the "signalling" hypothesis, see T Vermaelen, "Common stock repurchases and market signalling", Journal of Finance, vol 53, 1981, pp 139-83.