When the financial becomes real
Abstract
Plummeting oil prices and a surging US dollar shaped global activity in the year under review. These large changes in key markets caught economies at different stages of their business and financial cycles. The business cycle upswing in the advanced economies continued and growth returned to several of the crisis-hit economies in the euro area. At the same time, financial downswings are bottoming out in some of the economies hardest-hit by the Great Financial Crisis. But the resource misallocations stemming from the pre-crisis financial boom continue to hold back productivity growth. Other countries, less affected by the crisis, notably many EMEs, are experiencing different challenges. The shift in global conditions has coincided with slowing output growth and peaks in domestic financial cycles. There is the danger that slowing growth in EMEs could expose financial vulnerabilities. Better macroeconomic management and more robust financial structures, including longer debt maturities and reduced exposure to currency risk, have increased resilience. But the overall amount of debt has increased and the shift from banks to capital market funding could raise new risks.
Full text
Plummeting oil prices and a surging US dollar shaped the global macroeconomic environment in the year under review. These large changes in conditions in key markets caught economies at different stages of their business and financial cycles.
Supported by falling energy costs, the business cycle upswing in the advanced economies continued. The shift in exchange rates dampened US growth while aiding a return to growth in the euro area. Although financial conditions eased further in the countries hardest-hit by the crisis, the shadow of the pre-crisis financial boom lingered on. The resource misallocations linked to the past rapid credit expansion continued to hold back productivity growth. The legacy of high public debt limited governments' fiscal room for manoeuvre, while ageing societies further complicate the adjustments necessary to make fiscal positions sustainable.
In several respects, conditions were quite different in many emerging market economies (EMEs) that had been less affected by the crisis. Falling commodity export revenues and rising costs of servicing dollar debt coincided with slowing growth and peaks in domestic financial cycles. In the past, the combination of slowing growth and maturing credit booms in EMEs often ended in serious financial stress, especially when global financial conditions were tight. Better macroeconomic management and more robust financial structures, including longer debt maturities and reduced exposure to currency risk, have increased resilience. But higher overall private sector debt, both loans from the domestic banking system and capital market finance from abroad, could offset the gains from a sounder debt structure.
This chapter begins by reviewing the shifting growth patterns over the past year. It then assesses the long-lasting impact of earlier financial booms on growth in advanced economies and concludes by examining financial vulnerabilities in EMEs in the light of recent financial booms and slowing growth.
Shifting growth patterns
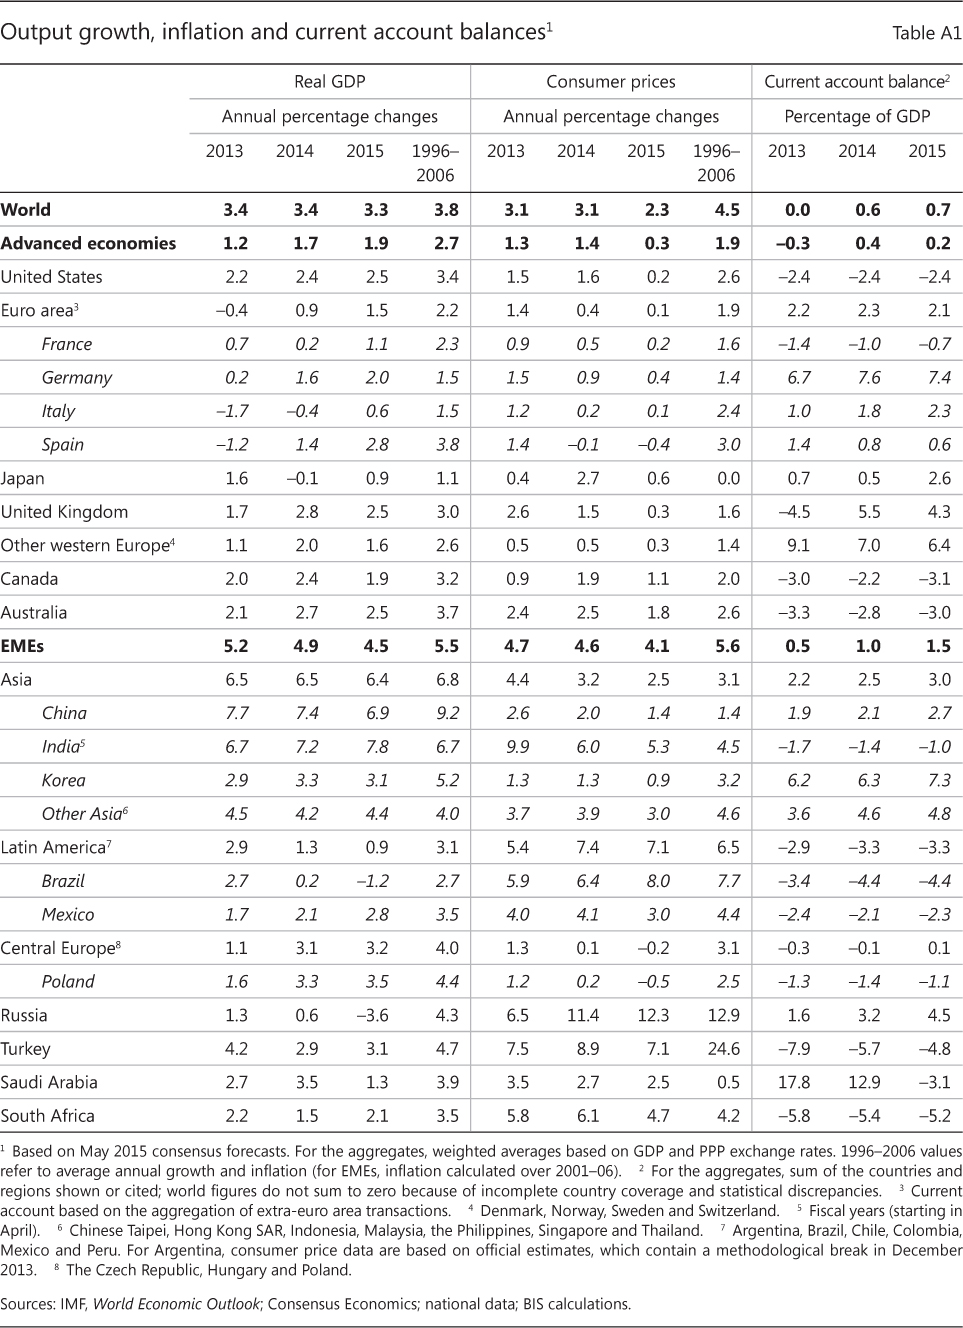
Over the past year, the global economy grew at close to its long-term average rate. World GDP expanded by 3.4% in 2014 (Annex Table A1), roughly in line with the average since 1980. However, this figure masks significant shifts in growth momentum across countries.
The upswing in the advanced economies continued (Graph III.1, left-hand panel). Further expansion in the United States and the United Kingdom contrasted with a return to modest growth in the euro area and a gradual recovery in Japan. The US economy grew by 2.4% in 2014, supported by rapidly declining unemployment. Output contracted in the first quarter of 2015, in part due to weaker exports. Output in the euro area expanded by 0.9% in 2014, and forecasters expect the recovery to gain pace in 2015. Growth returned to Spain and Portugal, and the Italian economy is expected to pick up in 2015. Japanese consumption dropped markedly after the April 2014 sales tax increase. Other advanced economies grew by an average 2.4%, albeit with widening differentials across countries.
Economic activity in EMEs lost further momentum. Growth weakened by around 0.3 percentage points to 4.9% in 2014, with the trend continuing into 2015. But again, this hides significant cross-country differences. Private demand growth in China slowed further, in part due to a softer real estate sector. This contrasted with accelerating activity in India and Korea. Growth in most other Asian EMEs slowed in 2014 but is expected to pick up in 2015. The Brazilian economy contracted in the second half of 2014, even as most other Latin American economies performed better. Growth in central and eastern Europe accelerated by 2 percentage points to 3.1%.
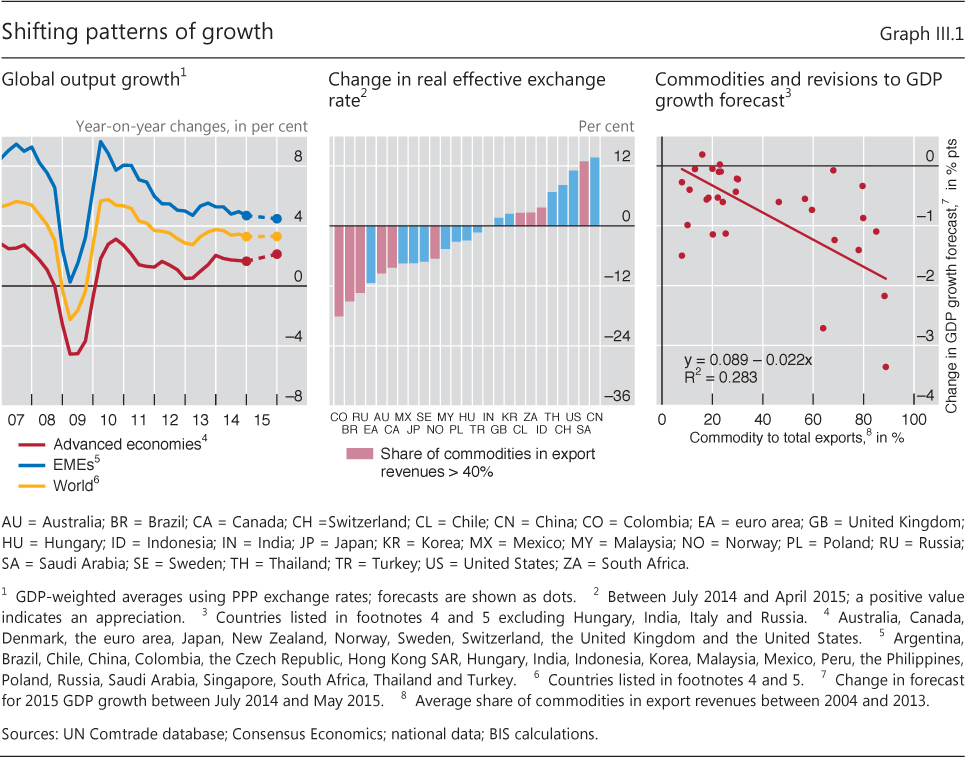
Plummeting oil prices and the US dollar appreciation influenced growth around the world from mid-2014 onwards. In late May 2015, crude oil prices were 40% lower in dollar terms year on year (Chapter II). Between July 2014 and April 2015, the US dollar trade-weighted real exchange rate appreciated by around 10%, while the euro depreciated by a similar magnitude and the yen by 7.5% (Graph III.1, centre panel).
The macroeconomic impact of these large price swings is yet to fully play out. Lower oil prices due to increased supply should boost economic activity through lower input costs and higher real incomes. Indeed, the oil price drop boosted consumer confidence in major advanced economies and contributed to the recent increase in consumption in the euro area. By contrast, changes in exchange rates mainly redistribute growth. US export growth decreased from 4% year on year in the second quarter of 2014 to 3% in the first quarter of 2015 against the backdrop of a stronger dollar.
Many EMEs have already felt stronger effects. Economic activity in commodity-producing economies has weakened. Between July 2014 and May 2015, downward revisions to 2015 growth forecasts were larger for countries more dependent on commodity exports (Graph III.1, right-hand panel). Lower commodity prices have led to investment cuts, particularly in the oil and gas sector. Moreover, commodity exporters have lost fiscal revenues.
In addition, commodity exporters experienced some of the largest real exchange rate depreciations. This supports exports and could eventually boost investment in export industries and help rebalance activity. The currencies of most commodity importers also fell against the US dollar, although not necessarily in trade- weighted terms. In fact, some economies, particularly in emerging Asia, saw real exchange rate appreciations, which depressed net exports.
The broad US dollar appreciation has also increased the costs of servicing dollar debt. Dollar credit outside the United States has increased markedly in recent years, to $9.5 trillion by the end of 2014 (Chapter V). While more than half of this debt is owed by borrowers resident in advanced economies, residents in EMEs have borrowed more than $3 trillion. The importance of currency mismatches in EMEs is explored in more detail in this chapter's final section.
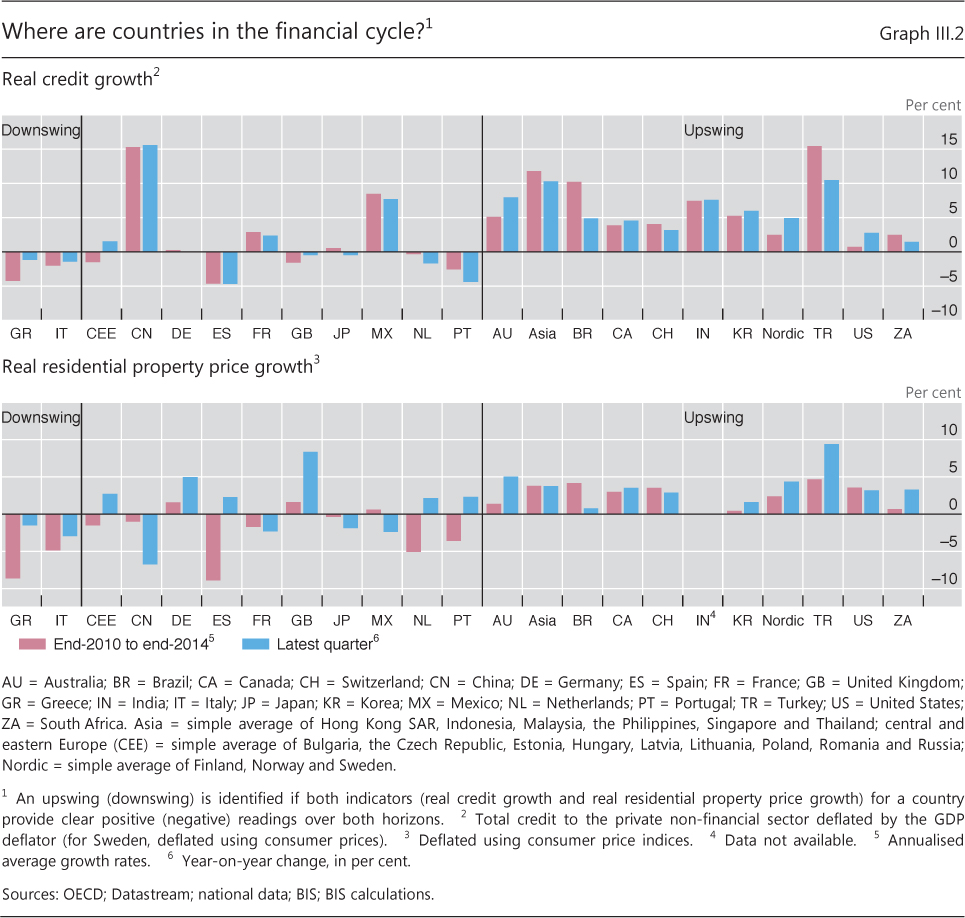
The shift in growth patterns caught economies at different stages of the financial cycle.1 In many of the economies that experienced a home-grown bust, financial cycles are turning up again. Both credit and property prices rebounded in the United States (Graph III.2). In the United Kingdom, credit to the private sector continued to fall but property prices grew vigorously. Credit also continued to fall in Greece, Italy and Spain, although the decline in property prices slowed or, in the case of Spain, reversed.
Unusually accommodative global monetary and financial conditions have fuelled financial booms in many of the smaller advanced and emerging market economies that were relatively unscathed by the Great Financial Crisis (Chapter V). Some of these booms are now showing signs of peaking. Real credit growth slowed in many EMEs, including many emerging Asian economies as well as Brazil and Turkey. In addition, property prices are signalling the turning of financial cycles in several economies. This is particularly evident in China, where residential property prices declined by nearly 7% over the past year in real terms (Graph III.2, bottom panel). Residential property prices also declined in Mexico, and their growth rate has weakened substantially in Brazil - a sign that the financial booms are maturing. By contrast, weaker commodity prices have not yet dented the financial booms in Australia, Canada and Norway, which experienced strong credit and property price growth over the past four quarters.
The current configuration of business and financial cycles poses different challenges for advanced economies and many EMEs. For the former, in particular the countries at the centre of the crisis, the issue is how to ensure healthy long-term growth without a new credit boom-bust cycle. For the latter, the key is how to ensure financial and economic stability amidst weaker growth and peaking financial booms.
Growth and the financial cycle in the advanced economies
The interaction between the financial cycle, on the one hand, and aggregate demand and production, on the other, goes some way towards explaining the lacklustre recovery in many advanced economies in recent years (see also the 84th Annual Report).
Financial cycles affect spending directly through both debt service burdens and the impact of leverage (Box III.A). During financial booms, increases in asset prices boost the value of collateral, making borrowing easier. At the same time, more debt means higher debt service burdens, especially if interest rates increase, which constrains spending. As long as asset prices keep rising, leverage-financed spending may offset this effect, but once the financial boom runs out of steam, falling asset prices raise leverage and thus make it more difficult for households and firms to borrow, compounding the drag from higher debt service burdens. After a financial bust, it takes time for spending to normalise. Even if interest rates fall quickly, as in 2008-09, high debt keeps debt service burdens up. And depressed asset prices generate credit constraints that ease only gradually. In fact, the interaction of leverage and debt service burdens explains the evolution of US spending in the aftermath of the Great Financial Crisis fairly well.
Overall, at the current stage of the financial cycle, financing constraints seem to be of minor importance for corporate investment. Instead, recent BIS research suggests that the cross-country pattern mostly reflects high uncertainty about the economy's future evolution.2 Strong debt-financed merger and acquisition activity and, in the United States, high levels of share buybacks also point to accommodative financial conditions for the corporate sector.3 That said, firms in some countries, most notably smaller firms in the euro area, still find access to bank credit more restrictive than pre-crisis, although this constraint eased during the period under review.4
Box III.A
Financial cycles and the real economy
The financial cycle has shaped the evolution of many economies both before and after the Great Financial Crisis. Recent work casts further light on some of the underlying dynamics, highlighting two variables: aggregate leverage (the stock of credit relative to asset prices) and debt service burdens (interest payments plus amortisations relative to income). While the impact of leverage has been widely explored, the role of the debt service burden has not received much attention, despite sizeable negative effects on private sector expenditure growth.
Two long-run relationships between credit, GDP, asset prices and interest rates tie down aggregate leverage and the aggregate debt service burden. First, a relationship between the credit- to-GDP ratio and real asset prices anchors aggregate leverage. This relationship works through collateral constraints: in the long run higher real asset prices support a higher credit-to-GDP ratio. A second long-run relationship exists between the credit-to-GDP ratio and interest rates. For the same amount of income, higher levels of debt can be carried when interest rates are lower. This relationship defines the sustainable level of the debt service burden.
Deviations from the long-run anchors of leverage and the debt service burden influence output significantly. Developments in the United States around the Great Financial Crisis are an example. In the early 2000s, asset prices were high and interest rates were low relative to outstanding debt levels, allowing households and corporates to borrow more. Asset prices outpaced credit growth, keeping aggregate leverage well below long-run values (Graph III.A, left-hand panel). This provided ample room for more credit, which also raised expenditure. But this boost was gradually offset by a growing negative drag on disposable income from increasing debt service burdens. This explains why output in the mid-2000s grew at around average, despite rapidly expanding credit. When the financial boom ran out of steam and asset prices began to fall, aggregate leverage increased strongly, constraining the private sector's borrowing capacity. This depressed expenditure even further, leading to a severe recession. Monetary policy responded by lowering interest rates, which gradually fed into lower debt service costs, reducing the drag on demand.
The dynamics of adjustment to deviations of leverage and the debt service burden from their long-run values embedded in this simple model do a surprisingly good job of matching the evolution of economic activity in the United States during the Great Recession and after. Even when the model is estimated only up to the fourth quarter of 2005, an "out of sample" forecast projects expenditure growth as falling to -1% per quarter at the end of 2009, a downturn of similar magnitude to the Great Recession. It also points to a drawn-out recession and recovery, with private sector expenditure growth returning to historical norms only in early 2012, not far from the actual outcome (Graph III.A, right-hand panel).
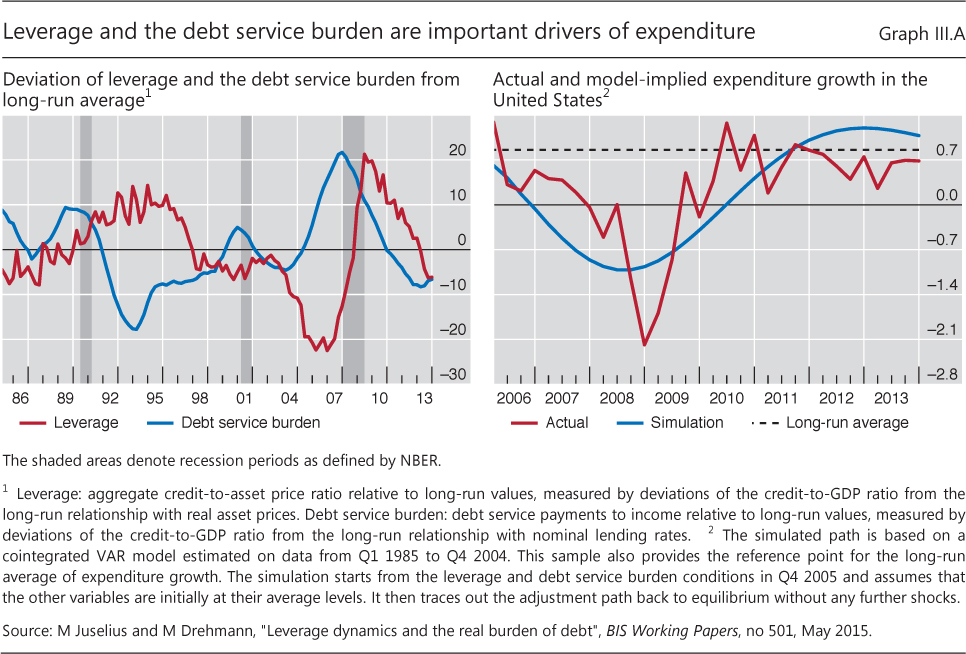
See M Juselius and M Drehmann, "Leverage dynamics and the real burden of debt", BIS Working Papers, no 501, May 2015. The long-run relationships are estimated by a cointegrated vector auto-regression (VAR) model on US data (1985-2013) that includes the credit-to-GDP ratio, the average lending rate on the stock of credit, real residential property prices, real commercial property prices and real equity prices. The effects of leverage and the debt service burden on the economy are estimated by using an expanded VAR system that includes the growth in credit, private sector expenditure, other expenditure and asset prices, all in real terms, as well as the average lending rate on the stock of credit. Importantly, the model embeds the conduct of monetary policy revealed by the data up to that point.
Credit boom-induced resource misallocations stifle productivity
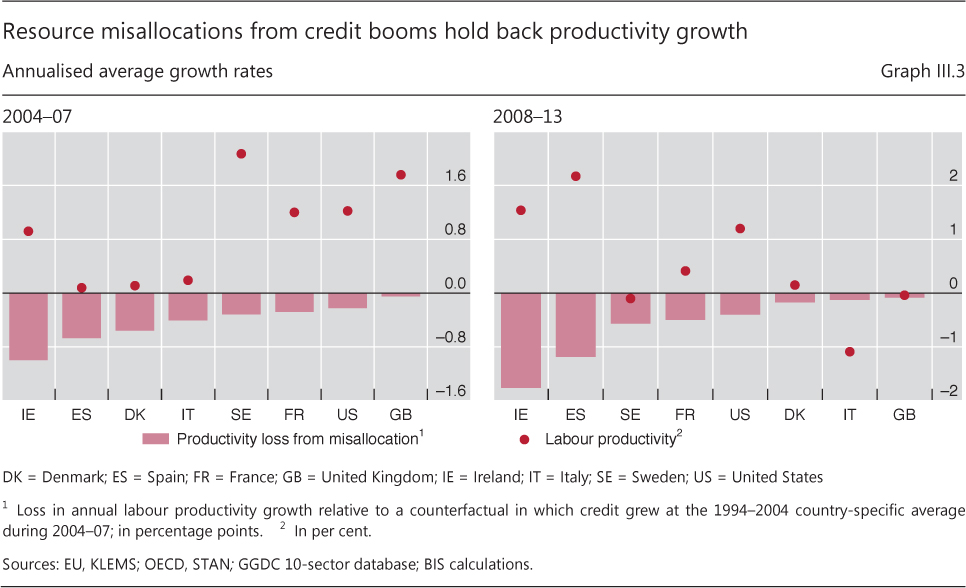
More fundamentally, earlier financial booms may still weigh on long-term growth prospects through their damaging effect on productivity growth. Financial booms typically go hand in hand with significant resource misallocations (Box III.B). In particular, labour is diverted to booming sectors with relatively low future productivity growth. Preliminary estimates suggest that the misallocation during the credit boom between 2004 and 2007 reduced annual labour productivity growth by around 0.2 percentage points in the United States, 0.4 percentage points in Italy, around 0.7 percentage points in Spain and around 1 percentage point in Ireland compared with a counterfactual in which credit to GDP grew at its 1994-2004 country-specific average (Graph III.3, left-hand panel).
The impact of these misallocations became even larger in subsequent years, once the boom turned to bust. Similar estimates suggest that productivity growth in 2008-13 would have been approximately 1.8 percentage points higher in Ireland, 1.2 percentage points higher in Spain, 0.5 percentage points higher in France and 0.4 percentage points higher in the United States, had the pre-crisis credit-to-GDP ratio grown at its 1994-2004 rate (Graph III.3, right-hand panel). Thus, the fallout from credit booms may well have exacerbated the trend decline in productivity growth in advanced economies (see the 84th Annual Report). By the same token, lower productivity growth in recent years need not be permanent.5
High public debt reduces growth, and ageing will make this worse
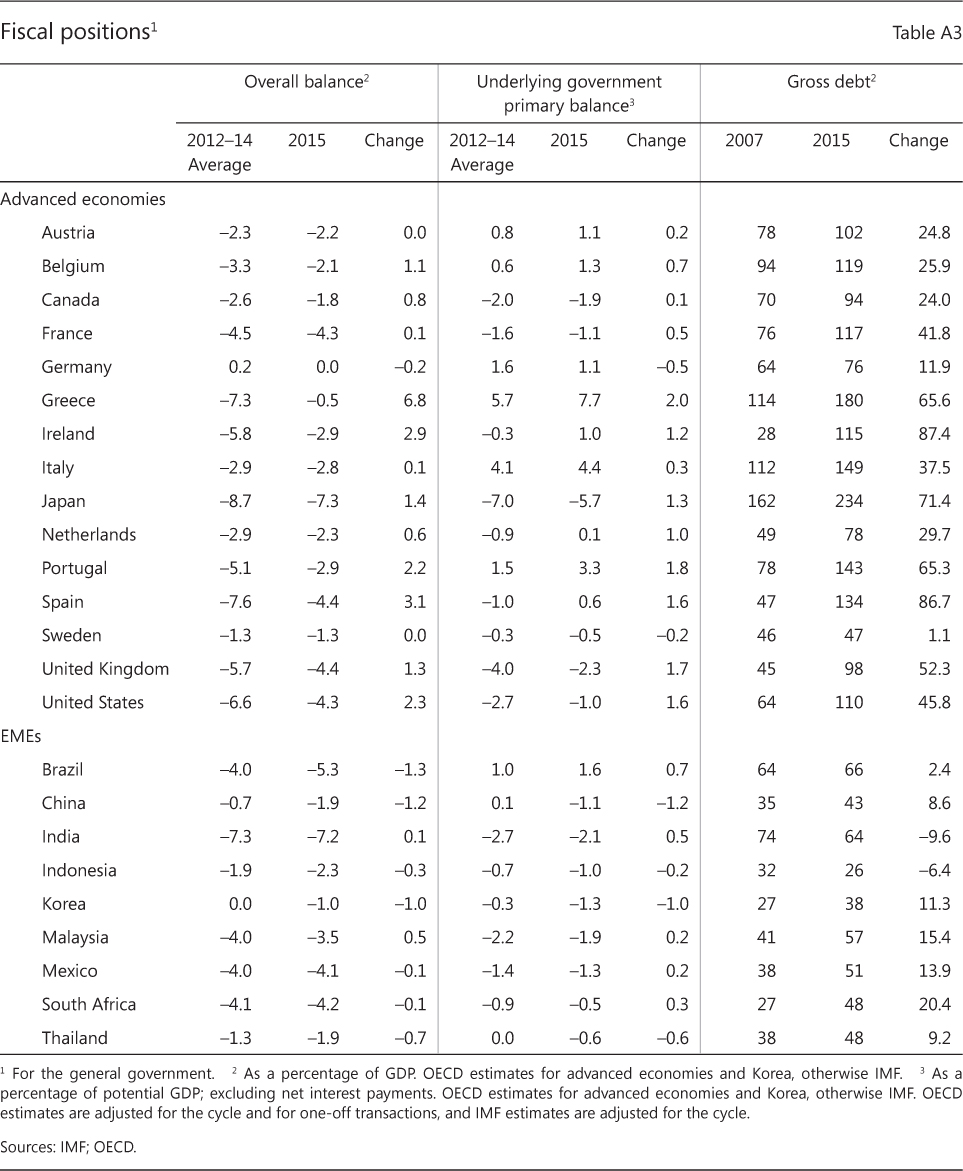
Another drag on long-term growth in most advanced economies is the level of public debt.6 Already generally high pre-crisis, this has ballooned since 2007. The average ratio of gross public debt to GDP is expected to reach 120% in the advanced economies at the end of 2015, well above the pre-crisis average of 75% (Annex Table A3). Some countries have much higher debt ratios, for instance Japan (234%), Greece (180%) and Italy (149%). While most countries have taken steps to strengthen fiscal positions, with fiscal balances forecast to improve by around 1.6% of GDP in 2015 compared with 2012-14, this has not yet set them on a sustainable long-term path.
With much higher public debt compounded by demographic pressures, governments now have little fiscal room for manoeuvre. To illustrate, Graph III.4 (left-hand panel) presents simulations of debt-to-GDP ratios that extrapolate age-related expenditure by applying current entitlements to population projections.7 Age-related spending will eventually put debt on an upward path. The simulations show that, under current plans, debt will initially decline in Germany and the United Kingdom and stabilise in the United States, but age-related spending will eventually reverse the trend - even at current, extraordinarily low effective interest rates. In Japan, the ratio will continue to rise, despite the modest expected increase in age-related spending. The expected debt service burden can act as a tax on private investment and labour. The result is lower investment, lower growth and, for a given tax rate, lower tax revenues.
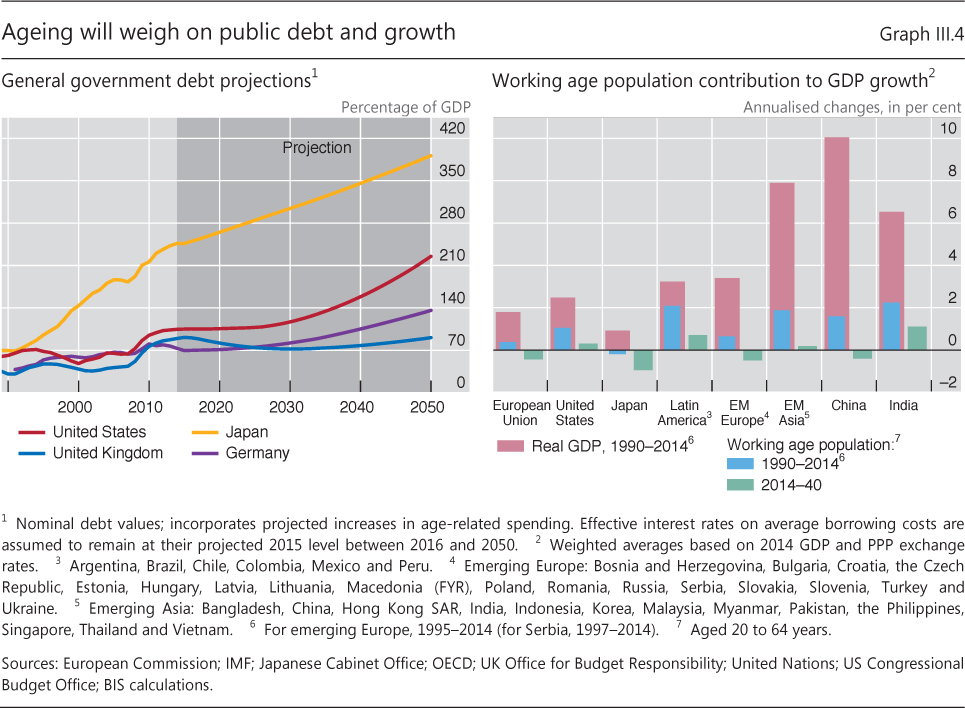
Ageing is not just an issue for advanced economies, however. In an increasing number of EMEs, ageing populations will weigh on growth and public finances. Between 1990 and 2014, the rapidly expanding working age population accounted for around one third of GDP growth in the United States and European Union, and for significantly more in Latin America (Graph III.4, right-hand panel). By contrast, between 2014 and 2040 its projected decline will lower GDP growth every year, by around 1 percentage point in Japan and around 0.5 percentage points in the European Union, emerging Europe and China.
Sustaining economic growth in the face of population ageing poses formidable challenges for policymakers. A wide range of measures can mitigate the ageing-related decline in the workforce. Labour participation, especially in older age categories and among women, can still increase. Given that jobs now tend to be less physically demanding, there is room for longer careers. In addition, structural reforms that directly address the decline in trend productivity growth, ranging from lighter regulation to better education, could enhance the quality, and hence productivity, of the labour force (see the 83rd Annual Report, Chapter III).
How strong are EMEs?
On the surface, the current configuration of credit booms, downward growth revisions and tighter dollar funding conditions looks similar to that which preceded previous episodes of serious financial stress in EMEs. However, a proper assessment of potential vulnerabilities should also take into account the important changes that have taken place in EMEs in recent years, strengthening their resilience.
While past EME financial crises were quite diverse, they shared some common elements.8 First, they followed periods of upbeat investor sentiment that turned into gloom when a change in external conditions exposed weaknesses in underlying growth models. Second, a combination of loose financial conditions in advanced economies and insufficient exchange rate flexibility had contributed to overly accommodative domestic monetary and financial conditions and real exchange rate appreciations. This in turn had helped stoke asset price booms and a surge in credit, much of it short-term and denominated in foreign currency. Third, the interaction of disappointing growth and fragile debt structures turned what might have been a cyclical slowdown into a financial crisis, with serious economic and social costs. Exchange rates came under huge pressure. When countries devalued, high foreign currency debt magnified the burden on borrowers. At the same time, short debt maturities forced countries into large and immediate adjustments to meet debt service obligations. Questions about the private and government sectors' ability to honour their debts paralysed capital markets and economic activity. Finally, crises triggered severe contagion to other EMEs.
How does the current situation compare with that prevailing before previous episodes of stress? Developments in the real economy and financial vulnerabilities more specifically are considered in turn.
Disappointment risk
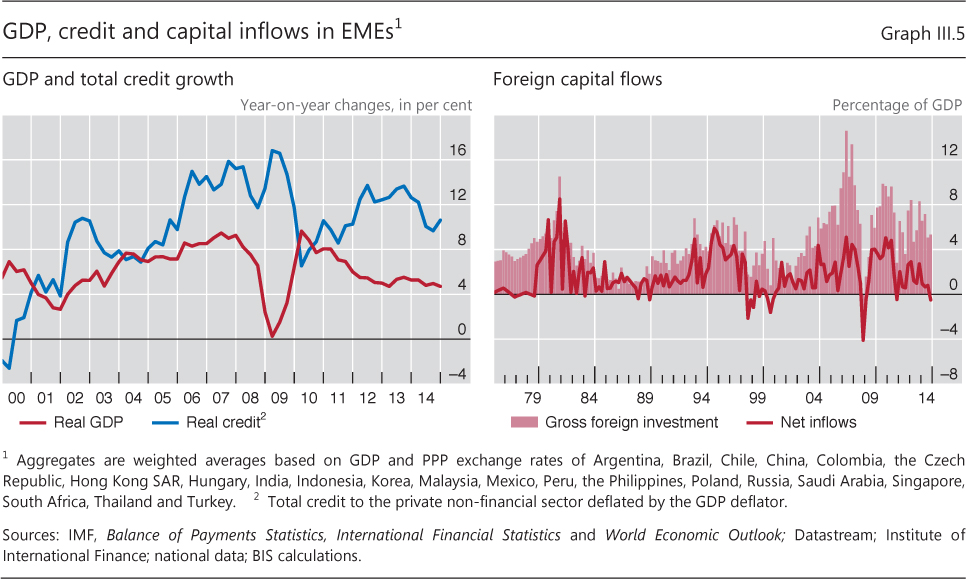
EMEs have experienced one of the longest high-growth spells on record. Since 2002, output has expanded by an average of over 6% per annum (Graph III.5, left-hand panel). The rate was close to 10% for China, around 6% for emerging Asia excluding China, and 3.5% in Latin America and central and eastern Europe. The Great Recession interrupted the growth spurt only briefly, with the notable exception of some central and eastern European countries. Growth fell to 3% in 2009 but bounced back to 9% in 2010. Since then, however, growth has declined gradually, albeit with significant cross-country variation.
Some moderation from these very high rates is probably unavoidable. But a slowdown could cast doubt on EMEs' underlying economic strength for at least three reasons. First, high commodity prices or strong capital inflows may have led to overly optimistic estimates of potential output. Second, the resource misallocations that can arise during financial booms could have weakened productivity. Third, the heavy debt service burdens from credit booms can weigh on medium-term growth.
Disappointing growth was key in both the Latin American debt crisis of 1982 and the Asian financial crisis of 1997-98. Both followed a strong growth spell that came to a halt earlier than many had expected. In Mexico and Chile, as well as in most other Latin American countries, growth had relied heavily on commodity production and ran out of steam once the terms of trade dropped and interest rates rose rapidly in the early 1980s. In Asia, growth had been heavily geared towards manufactured goods exports and real estate. To some extent, the boom faltered when deteriorating terms of trade exposed the low profitability of much of the investment.
Then, as now, rapid growth coincided with financial booms, fuelled by large capital inflows and accommodative monetary policy both domestically and abroad (see also Chapter V). The past 10 years have seen the largest gross foreign investment as a percentage of the recipient economy's GDP in over a century, higher than those before the 1982 debt crisis or the Asian financial crisis (Graph III.5, right-hand panel). These inflows have fuelled domestic credit and asset price booms (Graph III.5, left-hand panel). Since 2004, real credit has grown by around 12% per year and real property prices have increased by around 40% on average.
Rising commodity prices and domestic financial booms have undoubtedly boosted output, but it would be unwise to treat these effects as permanent. Higher interest rates in the advanced economies, in particular in the United States, could quickly feed into higher domestic rates in EMEs and tighter domestic financial conditions, for example by reducing investors' incentives to reach for yield (see Chapter V for a discussion of international policy spillovers). And the oil price collapse has shown how quickly conditions in commodity markets can change.
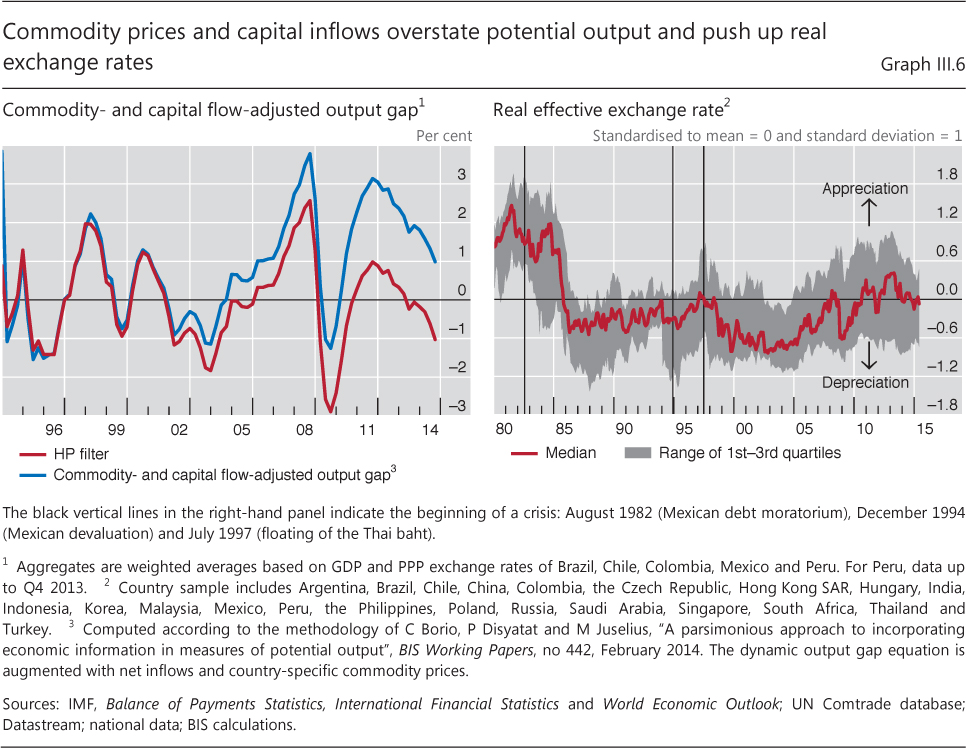
Estimates of the difference between actual and potential output ("output gaps") that correct for the cyclical effect of higher commodity prices and capital flows illustrate this point. They indicate that traditional measures could have overestimated potential output by around 2% on average across Brazil, Chile, Colombia, Mexico and Peru since 2010 (Graph III.6, left-hand panel) Therefore, reversals in these factors could well result in disappointing growth outcomes.
The financial booms of the last 10-15 years could also weigh on growth in the medium term. Historically, credit booms and real exchange rate appreciation in EMEs have coincided with resource shifts from the tradable to non-tradable sectors. For instance, during the late-1970s boom the non-commodity tradable sector grew only half as fast as GDP in Mexico and Chile. When the commodity boom ended, the non-commodity tradable sector was small and hence unable to absorb the resources shed by the contracting sectors. Such resource misallocations can substantially weaken productivity growth and require painful adjustment.
Real trade-weighted exchange rates also appreciated visibly during the recent boom, although with significant variation across countries (Graph III.6, right-hand panel). Between early 2009 and mid-2013, the median real effective exchange rate relative to historical averages in EMEs increased to its highest level in three decades. However, it has since fallen to a level close to its long-term average. Whether this indicates that a correction has already happened or heralds further exchange rate shifts is not clear.
Financial vulnerabilities
Without the amplification through financial channels, the underlying weaknesses in EMEs in Latin America in the early 1980s or Asia in the 1990s would not have resulted in severe crises. Large debts and fragile financial structures made them vulnerable to external and internal shocks. When growth slowed and global financial conditions tightened, it became increasingly difficult to refinance this debt, often exposing vulnerabilities in domestic banking sectors.
The short maturity and currency denomination of debt magnified these problems. When the countries eventually devalued, soaring debt burdens in domestic currency terms challenged the ability of the private and/or government sectors to honour their debts. The need to repay external lenders in foreign currency triggered balance of payments crises. In addition, tighter external financing conditions and a plunging exchange rate generated a domestic credit crunch, which also affected sectors without any currency mismatches.
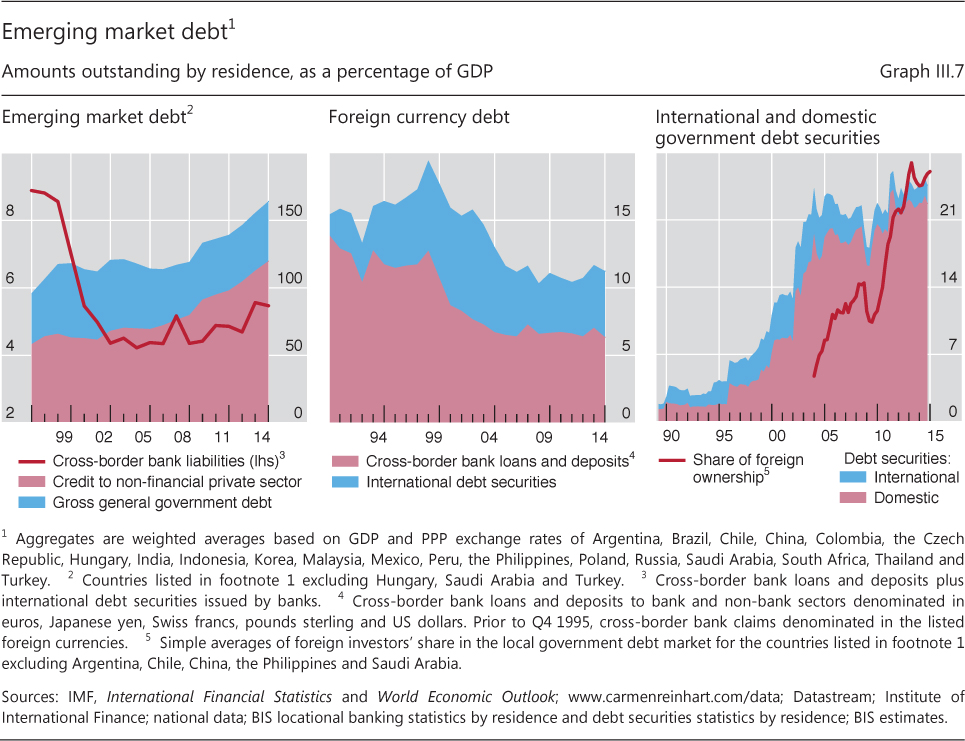
Today, high debt has raised the vulnerability of EMEs. The combined debt of the government and non-financial private sectors is around 50% higher in relation to GDP than at the time of the Asian financial crisis in 1997 (Graph III.7, left-hand panel). Government debt has fluctuated around 45% of GDP since the mid-1990s, whereas credit to the private non-financial sector increased from around 60% of GDP in 1997 to around 120% in 2014. The role of EME banks' cross-border funding in this boom has been limited, declining from around 9% of GDP before the Asian financial crisis to around 5% in 2014.
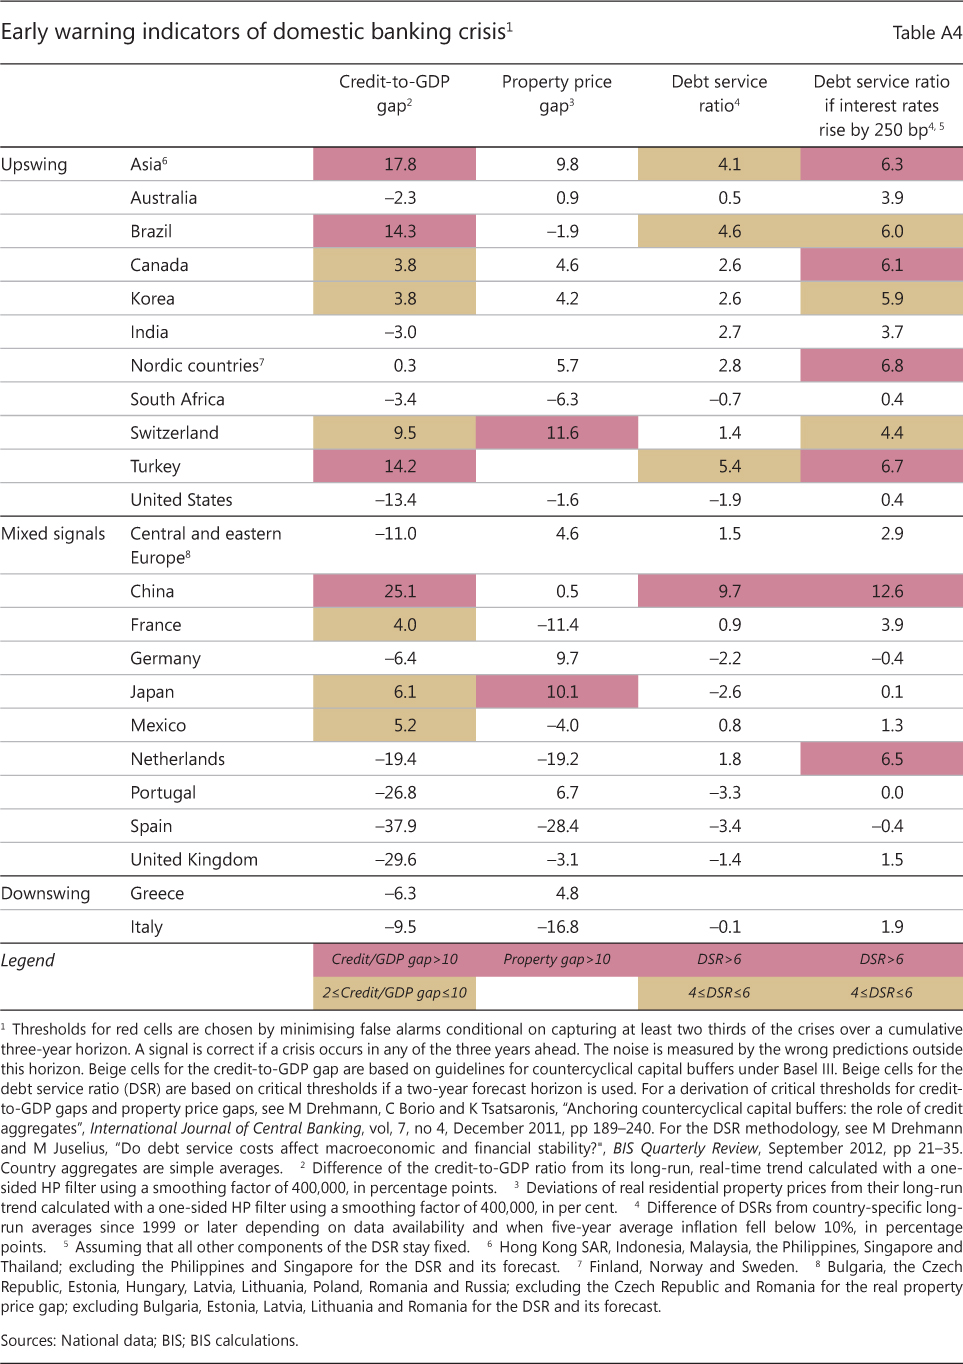
Early warning indicators of banking stress point to risks arising from strong credit growth (Annex Table A4). Credit gaps - the deviation of private sector credit from its long-term trend - are well above 10% in countries as diverse as Brazil, China, Indonesia, Singapore and Thailand. In the past, two thirds of all readings above this threshold were followed by serious banking strains in the subsequent three years.9 True, despite rapid credit growth, low interest rates have kept debt service ratios around their long-term level in most countries, albeit with some notable exceptions. Households and firms in Brazil, China and Turkey spend significantly more on servicing their debt than in the past. But, more generally, an increase in interest rates would push up debt service ratios in other countries as well, especially in Asia.
By contrast, the risks arising from foreign currency debt appear to be somewhat lower. On average, the ratio of foreign currency cross-border bank borrowing and international debt securities to GDP has decreased relative to 1997 (Graph III.7, centre panel). This has been driven by a decline in the ratio of cross-border bank loans, from over 10% of GDP to around 6% in 2014. Excluding China, foreign currency debt is currently around 14% of GDP, compared with nearly 20% in 1997.
Box III.B
Financial booms and labour misallocation
Aggregate productivity growth can essentially reflect two broad factors: first, and most obviously, technical progress and more and better human and physical capital in the various industries; second, reallocations of capital and labour from poorly performing sectors to those that perform well. This box provides evidence that credit booms tend to undermine this second factor. During periods of strong credit growth, labour increasingly flows into sectors with low future productivity gains (typically sectors that are particularly credit-intensive even though they may not be very productive in the long run). This depresses productivity growth - and thus potential output - even long after credit has stopped growing.
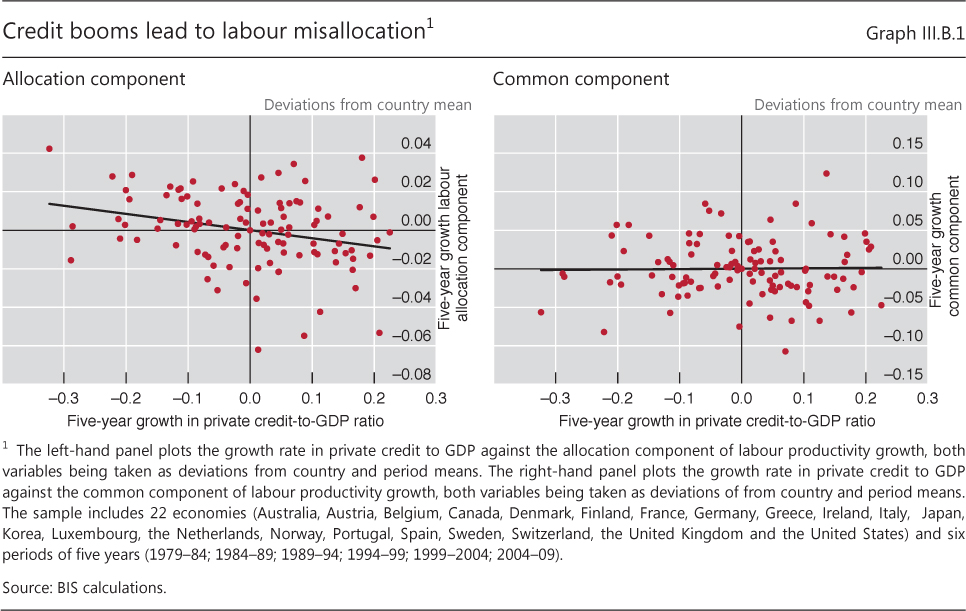
Aggregate productivity growth can be decomposed into a common component and an allocation component. The common component measures economy-wide productivity growth assuming a fixed sectoral composition, ie no labour flows across sectors. The allocation component measures the contribution of labour reallocation across sectors, ie whether labour flows into sectors with higher productivity growth. Here, we compute this decomposition for a panel of 22 economies since 1979 and over non-overlapping five-year periods. We then analyse how each of these components relates to growth in the ratio of private credit to GDP.
Empirical estimates suggest that financial booms, as reflected in rapid growth in the private credit-to-GDP ratio, coincide with a lower allocation component. This means that labour flows into sectors with lower productivity growth (Graph III.B.1, left-hand panel). By contrast, the common component appears to be unrelated to private credit (Graph III.B.1, right-hand panel). Credit expansions may still boost output growth through higher demand and investment, but not productivity growth. To gain a sense of the economic significance, consider the US experience. Between 2004 and 2007, labour productivity grew by 1.2% per year, but labour reallocations made a negative 0.3 percentage point contribution. Over the same period, private credit to GDP grew by 4.5% per year. Taking the estimates at face value, if credit to GDP had grown by only 1.5%, the drag on productivity growth would have been eliminated.
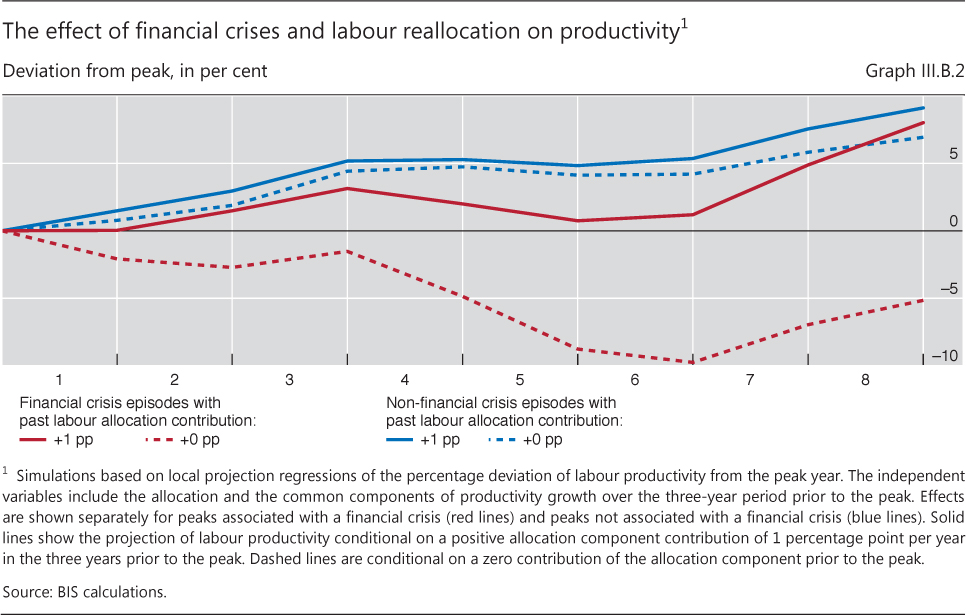
Labour reallocations can also affect the subsequent evolution of aggregate productivity, particularly following financial crises. To illustrate this, we focus on turning points in GDP to working population and explore if the path of aggregate productivity following the turning point depends on labour reallocations prior to the turning point. Two conclusions emerge. First, past labour reallocations towards high productivity gain sectors contribute positively to subsequent aggregate productivity (solid lines vs dashed lines in Graph III.B.2). Second, labour reallocations have a much larger effect after a financial crisis hits the economy (solid red line vs dashed red line in Graph III.B.2). In this case, past misallocations generate a significant and long-lasting drag on aggregate productivity growth (a 10 percentage point cumulative shortfall after five years). In the US case, for instance, our estimates suggest that the labour reallocations over the period 2004-07, interacting with the following financial crisis, shaved US productivity growth by 0.45 percentage points every year between 2008 and 2013. Thus, financial booms can lead to stagnant productivity as a result of the interaction between resource misallocations and financial crises that they induce.
For details, see C Borio, E Kharroubi, C Upper and F Zampolli, "Labour reallocation and productivity dynamics: financial causes, real consequences", mimeo, 2015.
Similarly, government debt structures have become less fragile. Governments increasingly issue bonds in local markets (Graph III.7, right-hand panel). As a result, the share of international debt securities has decreased from around 40% of the total in 1997 to around 8% in 2014.
That said, this does not insulate economies from foreign influences. For one, local currency long-term interest rates in EMEs tend to co-move closely with those in the major reserve currencies (Box V.C in Chapter V). In fact, the share of domestic government debt held by foreign investors has surged from around 9% in 2005 to over 25% on average in EMEs. In Mexico, Indonesia, Poland and Peru, this share is over 35%. Large portfolio reallocations could lead to large swings in asset prices.
Moreover, risks from currency mismatch, mainly from corporate borrowing, remain in some countries despite the overall decline in EME foreign currency debt. Foreign currency debt in the form of debt securities and cross-border bank lending is in the region of 30% of GDP in Hungary, Chile and Turkey, with between a third and a quarter in banks (Graph III.8, left-hand panel), but is also relatively high in Peru, Mexico, Poland, the Czech Republic and Korea. It is unclear to what extent this gives rise to currency mismatches, as data on financial hedges are patchy. Much of the foreign currency debt securities issuance by EME non-financial corporations has been by firms producing tradable goods (Graph III.8, right-hand panel), which may have foreign currency revenues that provide a natural hedge for their foreign currency obligations.
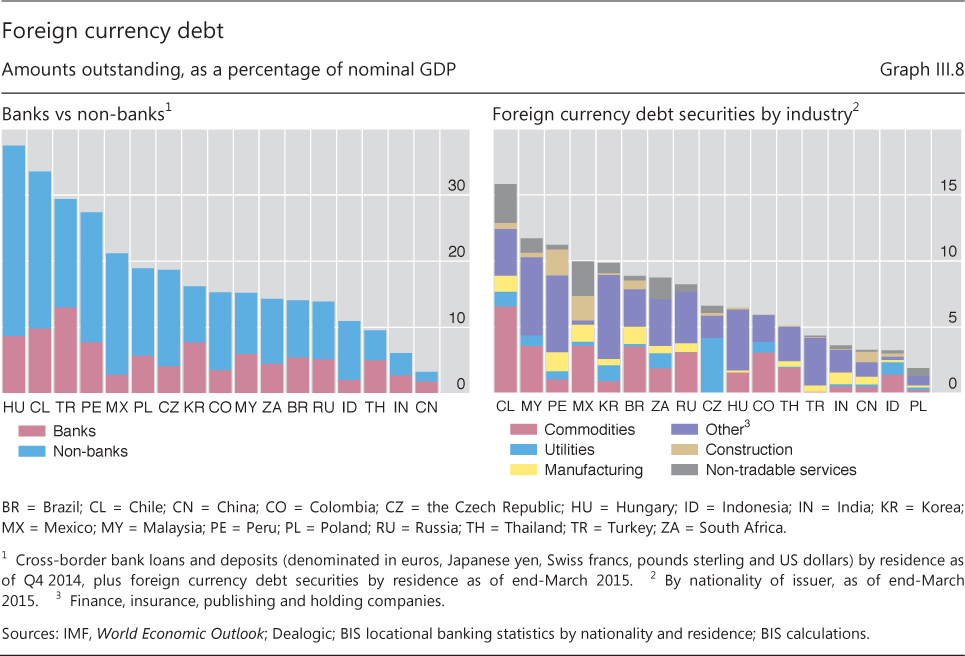
But natural hedges may not be that effective if export revenues drop when the currency of denomination strengthens, as is often the case for commodity revenues. And financial hedges may also be vulnerable at times of very large exchange rate changes. For instance, many EME corporates suffered heavy foreign exchange losses in the aftermath of the Lehman bankruptcy in 2008, partly because of the popularity of contracts that left them exposed to big currency moves.10
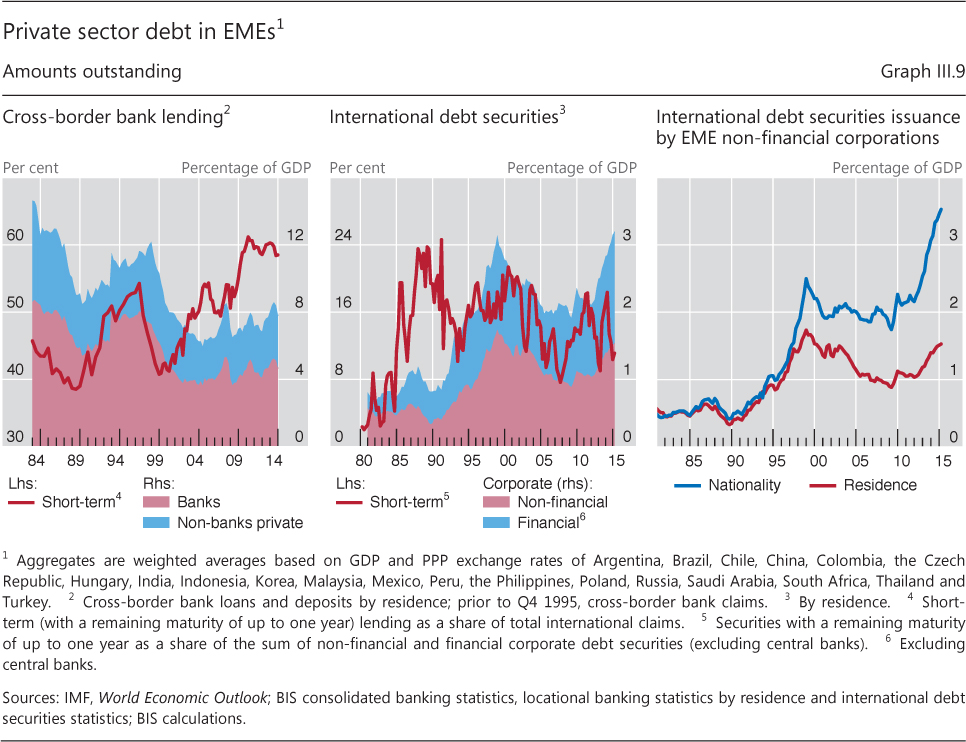
Finally, the shift of private borrowing from banks to markets has uncertain consequences. Banks still account for the bulk of domestic lending, but their share in cross-border lending has fallen significantly since the Great Financial Crisis (Graph III.9, left-hand panel). In contrast, amounts outstanding of private sector debt securities from EMEs increased to over 3% by early 2015 (Graph III.9, centre panel), although with great variation across countries. In addition, non-financial firms issued debt securities worth 2% of GDP through their offshore affiliates (Graph III.9, right-hand panel). On the one hand, this shift has reduced rollover risk. The share of debt securities with a remaining maturity of less than one year is now around 10%, compared with 60% for cross-border bank debt. The share of short-term bank debt is particularly high in China. On the other hand, the behaviour of footloose investors may amplify price dynamics under stress (see below).
Lines of defence
Since the late 1990s, EMEs have worked hard to strengthen various lines of defence to limit the risk of financial stress and manage it more effectively if it arises.
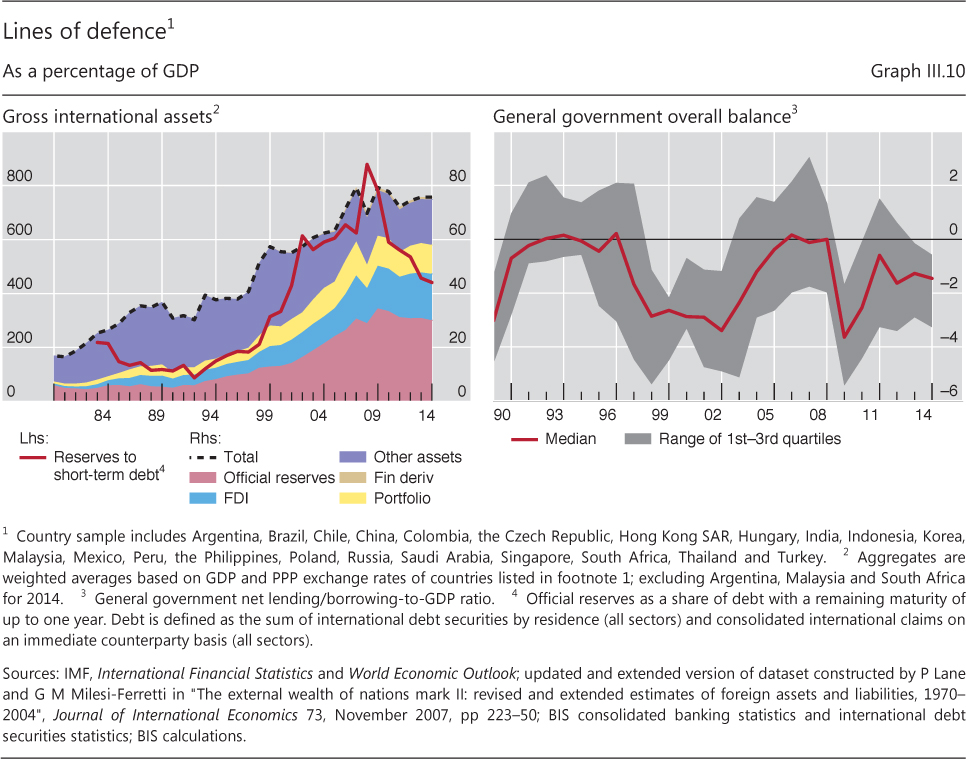
A first possible line of defence against external crises is larger private sector asset holdings abroad. Foreign assets held by the private sector in EMEs increased from around 30% of GDP in the mid-1990s to around 45% by 2014 (Graph III.10, left-hand panel). However, liquidating private sector external assets in times of stress may be difficult in practice. First, assets and liabilities are usually held by different people. Second, assets may be illiquid. Finally, foreign asset holdings may be adversely affected by the very same market conditions that trigger stress.
Perhaps the most visible line of defence is official foreign exchange reserves, which have risen massively. Official reserves in EMEs increased from around 10% of GDP in the mid-1990s to around 30% in 2014, although they have declined slightly more recently. To be sure, reserve holdings vary greatly across countries. For example, Saudi Arabia currently has around 100% of GDP in official reserves; China, Peru, Malaysia, Thailand and Hungary between 30 and 45%; Chile, Mexico, India, Turkey and South Africa between 10 and 20%; and Argentina around 5%. Still, reserve holdings generally exceed short-term liabilities. In addition, they have been complemented on an ad hoc basis by central bank foreign exchange swap lines and by other facilities, such as the IMF's Flexible Credit Line.
While such larger war chests no doubt provide considerably more protection than in the past, there are still questions about how effectively they can be deployed. In particular, it can be challenging to channel official reserves to the right places to plug liquidity gaps in the private sector. Moreover, authorities may be reluctant to intervene for a variety of reasons, including a desire to avoid setting the wrong incentives or being seen to run out of ammunition too quickly.
More fundamentally, greater macroeconomic flexibility from improvements in policy frameworks should have increased EMEs' resilience. On the monetary side, the shift from policy frameworks centred on fixed exchange rates to inflation targeting should give additional scope to better manage credit booms and associated vulnerabilities. More flexible exchange rates also increase a country's ability to adjust to changes in the economic environment. Over the past year some EMEs, especially in Latin America, have experienced very large exchange rate depreciations without this triggering a crisis.
Even so, these changes have not fully insulated countries from external developments. As discussed in Chapter V, exchange rate flexibility has only partially shielded EMEs from monetary policy spillovers in advanced economies. And the recent experiences of Brazil and Turkey, both of which raised policy rates at a time of slowing activity, illustrate the constraints on domestic monetary policy in the face of large capital outflows related to the tightening of monetary policy in advanced economies.
The capacity of fiscal policy to absorb shocks appears limited. Fiscal deficits are larger than in 2007 (Graph III.10, right-hand panel). Moreover, the median general government financial deficit of 1.5% of GDP in 2014 masks significant differences: Brazil and India have budget deficits of more than 6% of GDP. And financial booms are likely to have flattered public accounts. As discussed in more detail in last year's Annual Report, this reflects an overestimation of potential output and growth, the revenue-rich nature of financial booms and the build-up of contingent liabilities that may need to be addressed in the bust. The experience of countries such as Spain and Ireland, whose fiscal positions looked deceptively strong ahead of the Great Financial Crisis, is a clear case in point.
Financial and real contagion
Today, EMEs are much more integrated into the global economy and financial system than before. Therefore, any serious financial strains, were they to materialise, would have larger repercussions globally than in the past.
Past financial crises in EMEs triggered widespread contagion. First, global investors withdrew from countries that shared some of the characteristics of the countries at its epicentre. For example, in 1997 the spectre of the crisis spread from Thailand to Indonesia, and then to Malaysia, the Philippines and Korea. Second, common lenders transmitted strains. For example, in the Latin American debt crisis contagion spread through the US banking system, which was heavily exposed to the region.
It is not yet clear to what extent changes in financial structure have changed the potential for contagion. The growing presence of regional banking in Asia today could have increased the likelihood of direct contagion in the region. Between 2007 and 2014, the share of banks in Asia and the Pacific in international claims on emerging Asia increased from around a third to nearly three fifths, while that of euro area banks declined to 15%, less than half its 2007 level. By contrast, there is some evidence from the "taper tantrum" that global investors in emerging markets have become more discriminating (see the 84th Annual Report, pp 29- 30). This should reduce contagion from perceived - rather than actual - similarities. However, investors might differentiate less during a broader retrenchment.
One key change is the increased importance of actions by asset managers and investors in EME bond funds. The shift from bank lending to market finance and the associated longer maturities, along with the higher share of domestic currency debt, mean that some risk has moved from debtors to creditors. There is evidence that both asset managers and the ultimate owners of the assets tend to behave in a correlated manner, buying when prices go up and selling when they fall, limiting the benefits of a more diversified investor base (Chapter VI).11 Collective action problems with diverse investors may also make it harder for policymakers to stem large withdrawals than in the case of withdrawals by international banks.
More importantly, contagion need not be confined to other EMEs: the 1982 Latin American debt crisis led to significant problems in the US banking system. Today, borrowers from EMEs account for 20% of the foreign exposures of BIS reporting banks (on a consolidated, ultimate risk basis) and for 14% of all outstanding debt securities. Any losses on these exposures are bound to have important consequences for at least some large creditors. Similarly, EMEs make up 20% of the market capitalisation of the MSCI Global, a broad equity index.
Furthermore, the effects would not be limited to financial channels. EMEs have been the main drivers of global growth in recent years, quite unlike in previous periods. They account for approximately half of world GDP in PPP terms, compared with around one quarter at the time of the Latin American debt crisis, and a third before the Asian financial crisis in 1997. Their contribution to global growth has increased from around 1 percentage point in the 1980s to over 2 points since the early 2000s. The collapse of global trade between 2008 and 2009 by more than 20% clearly illustrates how financial crises can affect real economic activity.
Taken together, there are a number of reasons to believe that EMEs are more resilient today than in the 1980s and 1990s: macroeconomic frameworks are sturdier; exchange rate flexibility has increased; financial system infrastructure is more robust and prudential regulation more stringent. The lines of defence are stronger, most visibly in the growth of foreign exchange reserves. And the development of local currency bond markets has reduced government overreliance on foreign currency debt.
Yet some other developments call for caution. Credit has grown very rapidly, often exceeding levels that have been followed by serious banking strains in the past. And a solid macroeconomic performance may not insulate EMEs from foreign shocks. Foreign currency debt levels are lower relative to GDP, but concentrated in the corporate sector, where currency mismatches are harder to measure. Mobilising reserves effectively to counter liquidity shortages in specific sectors or support domestic currencies may prove challenging. Finally, the shift from bank finance to foreign asset managers may have altered market dynamics in ways that are not well understood.
1While there is no consensus definition of financial cycles, they are generally measured by the co-movement of a broad set of financial variables. The most parsimonious representation is in terms of credit and property prices, but other measures of risk-taking may add further information. The interactions between these variables can have major macroeconomic consequences. For instance, banking crises or periods of considerable financial distress often follow financial-cycle peaks, as confirmed in many countries by the Great Financial Crisis. See BIS, 84th Annual Report, Chapter IV, for further elaboration.
2See R Banerjee, J Kearns and M Lombardi, "(Why) Is investment weak?", BIS Quarterly Review, March 2015, pp 67-82.
3See A van Rixtel and A Villegas, "Equity issuance and share buybacks", BIS Quarterly Review, March 2015, pp 28-29.
4See ECB, "Survey on the access to finance of enterprises in the euro area, October 2014 to March 2015", June 2015.
5For a discussion of possible explanations of the low growth in advanced economies in recent years, see C Teulings and R Baldwin (eds), Secular stagnation: facts, causes, and cures, a VoxEU.org eBook, CEPR Press, 2014, and references therein.
6See S Cecchetti, M Mohanty and F Zampolli, "The real effects of debt", in Federal Reserve Board of Kansas City, Economic Symposium 2011: achieving maximum long-run growth, 2011, pp 145-96.
7Based on the current forecasts for 2015 debt and assuming that the primary balance evolves in line with the national authorities' latest projections up to the last calendar year for which they are available. For subsequent years, the primary balance net of age-related spending is assumed to remain constant as a share of GDP.
8See C Borio and P Lowe, "Assessing the risk of banking crises", BIS Quarterly Review, December 2002, pp 43-54; and P-O Gourinchas and M Obstfeld, "Stories of the twentieth century for the twenty-first", American Economic Journal: Macroeconomics, January 2012, pp 226-65.
9See M Drehmann, C Borio and K Tsatsaronis, "Anchoring countercyclical capital buffers: the role of credit aggregates", International Journal of Central Banking, vol 7, no 4, December 2011, pp 189-240.
10See M Chui, I Fender and V Sushko, "Risks related to EME corporate balance sheets: the role of leverage and currency mismatch", BIS Quarterly Review, September 2014, pp 35-47.
11See K Miyajima and I Shim, "Asset managers in emerging market economies", BIS Quarterly Review, September 2014, pp 19-34.