Asset managers in emerging market economies
The turbulence in emerging market economies (EMEs) in mid-2013 has reminded policymakers and investors of the importance of actions by large asset managers for relatively small and illiquid EME asset markets. The presence of asset managers in EMEs has grown considerably, and the concentrated use of benchmarks and the directional co-movement of investor flows can generate correlated investment patterns that may create one-sided markets and exacerbate price fluctuations. Indeed, we provide evidence showing that, during the past two years, investor flows to asset managers and EME asset prices have reinforced each other's movements.1
JEL classification: G11, G15, G23.
In recent years, asset managers have become important players in emerging market economy (EME) asset markets. This shift has coincided with a prolonged period of very low interest rates in advanced economies, which has led investors to look for higher-yielding (but riskier or less liquid) assets in the hope of greater returns. This has resulted in a sharp rise in bond issuance by EME entities, especially EME corporations.
Increased foreign investment in EME assets can boost investment and growth in EMEs and help develop their financial markets. But this comes at a price. Successive crises have shown that foreign investors may destabilise EME asset markets - accentuating both booms and busts. For example, during the latest period of turbulence, which started in May 2013, large capital outflows from many EME bond markets drove up bond yields and led to a sharp depreciation of EME currencies. This increased the cost to EME borrowers repaying foreign currency debt and exposed, in particular, EME corporations to refinancing risks (Chui et al (2014)).
In this article, we find that asset managers in EME asset markets tend to behave in a correlated manner and that investment flows to asset managers and asset prices amplify each other's fluctuations. In particular, we first show that asset managers have increased their presence in EMEs over the past decade. Second, the use of common/similar portfolio benchmarks and the directional co-movement of ultimate investor flows can generate correlated investment decisions by asset managers. Moreover, we provide evidence showing that, during the past two years, investor flows to asset managers and EME asset prices reinforced each other's directional movements. It is therefore important that policymakers understand how actions by asset managers and their ultimate investors can potentially destabilise EME asset markets.
Global asset managers in EME asset markets
Global investors are generally interested in holding EME assets but often do not want to or cannot hold them directly, which leads them to rely on asset managers to access these markets. In particular, retail investors typically invest in collective investment vehicles, managed by a small number of large asset management companies (AMCs). Institutional investors also invest in such vehicles or use separate (segregated) accounts managed by AMCs. As delegated investors, asset managers perform an agency function for these investors, who are the ultimate owners of the assets. Revenues of AMCs largely come from the fees they charge their clients for investment services.
Collective investment vehicles2 offer different fund structures and allocation strategies to investors (Table 1). There are two main fund structures: open-end and closed-end funds. Open-end funds allow investors to add or redeem investments. Exchange-traded funds (ETFs) are a form of open-end fund that is traded on exchanges. Closed-end funds, when set up, issue a fixed number of shares that are traded on secondary markets. Open-end mutual funds and ETFs are larger than closed-end funds in terms of both the number of funds and the total amount of assets under management (AUM).
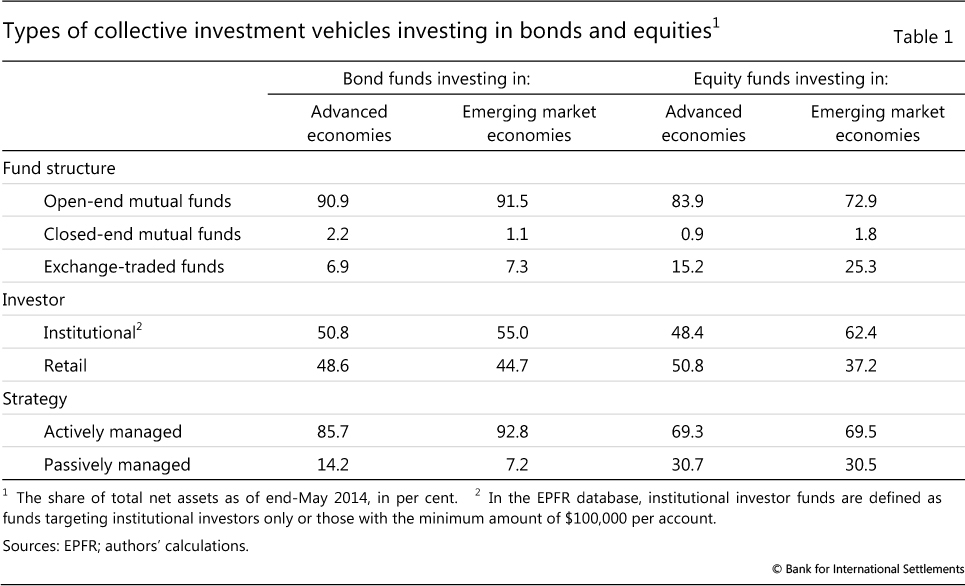
Asset managers can also be divided into two types by investment strategy. The first is actively managed funds, whose allocation or investment decisions are not tied directly to a benchmark index. The second is passively managed funds, which seek to mirror or closely track the performance of a particular benchmark index. Table 1 shows that around 70-90% of the EME assets managed by collective investment vehicles have mandates to follow an active investment strategy. That said, the share of passively managed funds including almost all ETFs has increased in recent years, particularly following the 2008 financial crisis. Most notably, owing to their low cost, ETFs have gained popularity among investors interested in EME assets.
The size and concentration of the global asset management industry have increased over the past decade. First, as ultimate investors' assets continue to grow, the total amount of AUM by the largest 500 AMCs doubled from $35 trillion in 2002 to almost $70 trillion in 2012 (Graph 1, left-hand panel).3 Many AMCs saw large declines in AUM following the collapse of Lehman Brothers in 2008, which some observers attributed mainly to valuation effects, rather than redemptions. But as markets rebounded, so did AUM.
Second, the global asset management industry is dominated by a small number of large players. In 2012, the share of the largest 20 AMCs was about 40% of the total AUM of the largest 500 companies, or $28 billion (Graph 1, left-hand panel). Furthermore, the top five accounted for 18% of total AUM, with the largest player representing nearly 6% of the total.
To gauge the activity of asset managers in EMEs, we rely on the commercial database of mutual funds and ETFs provided by Emerging Portfolio Fund Research (EPFR) Global.4 This is one of the most widely used data sources of foreign fund flows to EMEs, owing partly to the high frequency of the data. The data are typically used to track retail and institutional investment flows. That said, the individual institutional investors represented by the EPFR data are believed to be relatively small in size compared with those that use the major global custodians.5 Therefore, the EPFR institutional flows may not be a very good proxy for the entire universe of institutional investment flows.
EPFR data indicate that the AUM of dedicated EME funds have grown strongly. The total AUM of EME equity and bond funds increased from the pre-Lehman peak of $900 billion in October 2007 to $1.4 trillion in May 2014 (or about 8.5% of total EME equities and bonds outstanding). In particular, the total AUM of EME equity funds increased from $702 billion at the end of 2009 to $1.1 trillion at the end of 2013, and those of EME bond funds quadrupled from $88 billion to $340 billion over the same period.
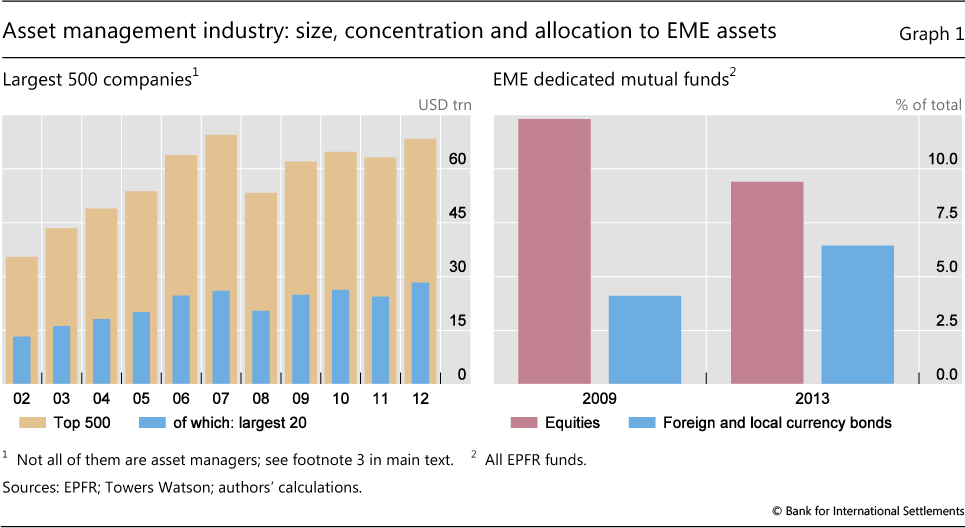
The picture is more mixed when it comes to the share of EME funds in all mutual funds and ETFs. The share allocated to EME bonds (foreign currency and local currency) rose from 4.1% to 6.4% (Graph 1, right-hand panel). By contrast, the share of EME equity funds out of the total AUM of all equity funds declined from 12.3% to 9.4% over the same period. But these changes are likely to reflect valuation effects. During 2009-13, major EME bond indices outperformed advanced economy (AE) bond indices by about 10% in US dollar terms, accounting for some of the sharp increase in allocations to EME local currency bonds. Meanwhile, major EME equity price indices underperformed their counterparts in AEs by about 30% in US dollar terms. After accounting for these changes, allocations to EME equities may well have risen.
The large size and concentration of AUM of asset managers in relatively small and illiquid EME asset markets are a potentially important source of concern. Any decision by asset managers with large AUM to change portfolio allocation can have a major impact on EME asset markets that are relatively small. For instance, a 1 percentage point reallocation of AUM of the largest 500 AMCs discussed above, the total size of which amounts to about $70 trillion, would result in additional portfolio flows of $700 billion to EMEs.6 This is larger than the very large amounts of gross portfolio outflows in 2008 ($246 billion) and inflows in 2012 ($368 billion) documented in IMF (2014). The implication could be more significant in smaller and more open economies than in those with larger but less open financial systems.
Correlation of investment in EME assets by asset managers
Whether or not asset managers have a destabilising effect on markets depends in large part on how correlated their behaviour is. There are two broad channels through which asset managers might behave very similarly to each other. The first channel is described in the first subsection below entitled "Use of benchmark indices", which deals with mechanisms within the asset management industry that may induce correlated behaviour. We mainly focus on the use of common/similar benchmarks, while touching upon other key mechanisms, such as relative and short-horizon performance evaluation. The second channel is treated in the following subsection entitled "Ultimate investor flows", which discusses the behaviour of ultimate investors, who may commit to or redeem funds simultaneously, thus forcing asset managers to buy or sell.
Use of benchmark indices
Benchmarks play critical roles for asset managers. Conceptually, there are three different levels upon which we can consider the impact of benchmarks on correlations. First, at the individual fund level, a fund's management style (active or passive) given a benchmark matters. The more active a fund is, the less closely the portfolio weights of the fund follow those of its benchmark. Second, at the level of the asset management industry, the use of common benchmarks and correlation between benchmarks is of importance. Asset managers will behave more similarly if many of the assets are tied to the same benchmark or if the benchmarks themselves are correlated. Finally, the method used for constructing benchmark indices can be a source of increased volatility.7 This subsection focuses on the first and second aspects, while the third is discussed in the box.
How active are actively managed EME mutual funds?
For passively managed funds, including ETFs, the link between fund allocation and a benchmark is direct. Although passive managers do not perfectly replicate their benchmark index because of transaction costs,8 they have very little leeway to deviate from their benchmark. As a consequence, the larger the number of passively managed funds indexed to a particular benchmark, the more correlated these funds are. When ultimate investors, say, withdraw their money, passively managed funds will sell portfolios in similar fashions, aggravating directional price movements.
But the use of benchmarks also gives rise to correlated behaviour on the part of actively managed funds. The managers of such funds tend to be evaluated by whether the returns of their investments match or exceed those of a particular benchmark index. Although active managers do not necessarily fully replicate the portfolio weights of the benchmark, the career risk of short-term underperformance against their peers can induce them to form similar portfolios or to "hug" their benchmarks as tightly as possible. This would increase the correlation of asset managers' portfolio choices. Morris and Shin (2014) and Feroli et al (2014) formalise this point.
In order to measure the degree of activism of an EME bond fund, we calculate the active share as the sum of the absolute value of deviations of the fund's country weights from those of the benchmark, following Cremers and Petajisto (2009):
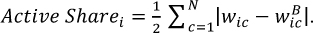
If a fund replicates a benchmark, the portfolio weight of country c in fund i,  , will be equal to the weight of that country in the benchmark,
  , giving an active share of zero. A fund's active share of 10% means a 90% overlap with the benchmark.
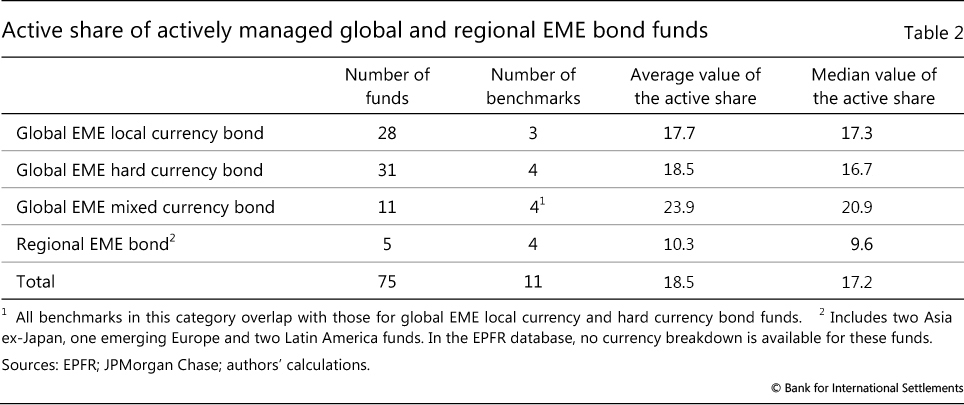
We focus on actively managed global and regional EME bond funds which use JPMorgan bond indices as benchmarks and have monthly data on fund portfolio country weights available from the EPFR database from January 2011 to June 2014. We consider 17 EMEs (Brazil, Chile, China, Colombia, Hungary, India, Indonesia, Malaysia, Mexico, Nigeria, Peru, the Philippines, Poland, Romania, Russia, South Africa and Turkey) individually, and lump the other countries in a residual category.
Table 2 summarises the sample of bond funds used for our analysis and reports the average and median value of their active share by type of fund. There are four types by geographical coverage: global EME (70 funds), Asia ex-Japan (two funds), emerging Europe (one fund) and Latin America (two funds). The average and median values of the active share are largest for global EME mixed currency bond funds and smallest for regional EME bond funds. Also, global EME local currency bond funds have a smaller degree of activism than global EME hard currency (ie foreign currency) bond funds.9
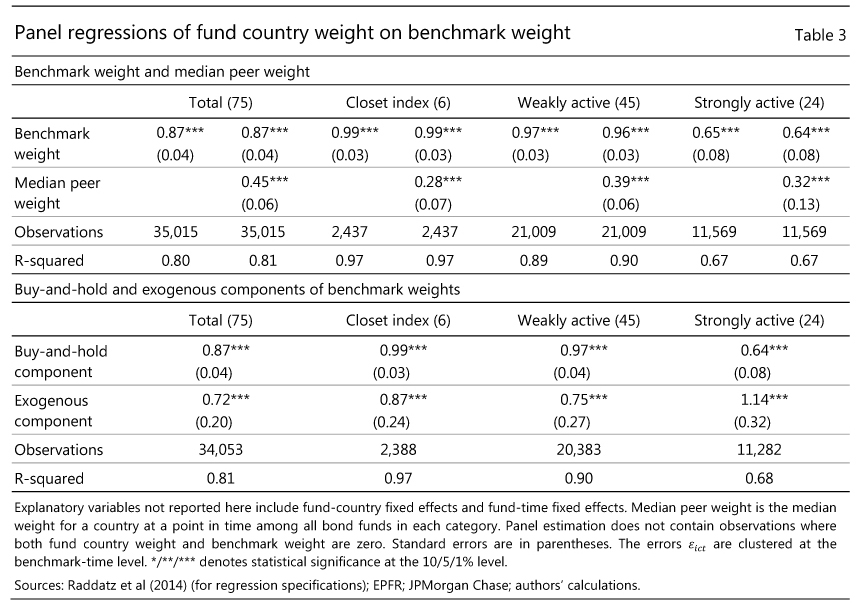
To formally measure the degree of activism of these funds, we conduct panel regression analysis following the empirical approaches in Raddatz et al (2014). In addition to considering all 75 EME bond funds, we classify them into the following three categories based on the active share: "closet index" funds10 with an active share between 0% and 10%, "weakly active" funds with a share between 10% and 20%, and "strongly active" funds with a share greater than 20%.
In particular, we consider the following three empirical specifications:


Specification (1) is the baseline specification, which shows how closely  , a fund i's weight of country c at time t, follows the fund's benchmark weight,
  . Specification (2) considers, in addition to benchmark weights, the median peer weight,
  , of each group of funds. The greater the extent to which fund managers follow their peers due partly to relative performance evaluation, the higher the coefficient on the median peer weight. Specification (3) is a variation of specification (1), which gauges the impact of two separate components of the benchmark weight,
  : (i) the buy-and-hold component,
  , where
  and
and  are the return on a country's bond and that on the benchmark, respectively; and (ii) the exogenous component
  , capturing changes in benchmarks due to new bond issues, upgrades or downgrades, and addition to or deletion from certain indices on the one hand, and changes in the benchmark construction methodology on the other.
Table 3 shows that country weights of EME bond funds tend to follow their benchmark weights quite closely. In particular, when we consider the benchmark weight only (specification (1)), the estimated coefficient is 0.87 for the whole sample, and the coefficient decreases as the degree of activism increases.11 In specification (2), the coefficient on the median peer weight is statistically significant and its size is about half that of the benchmark weight. This is consistent with the hypothesis of the peer industry effect.12 Finally, when the buy-and-hold and exogenous components of the benchmark weight are considered separately (specification (3)), we find that the coefficient on the buy-and-hold component for strongly active EME bond funds is smaller than that on the exogenous component. This result implies that these funds react more strongly to the exogenous changes in benchmark weights than to market value-driven changes in benchmark weights.
Concentrated use and correlation of benchmarks
At the asset management industry level, the use of common benchmarks by many EME asset funds and correlation between their benchmarks can lead them to adopt similar asset allocation strategies. These funds are likely to move in the same direction and react in similar ways when they face EME-related shocks.
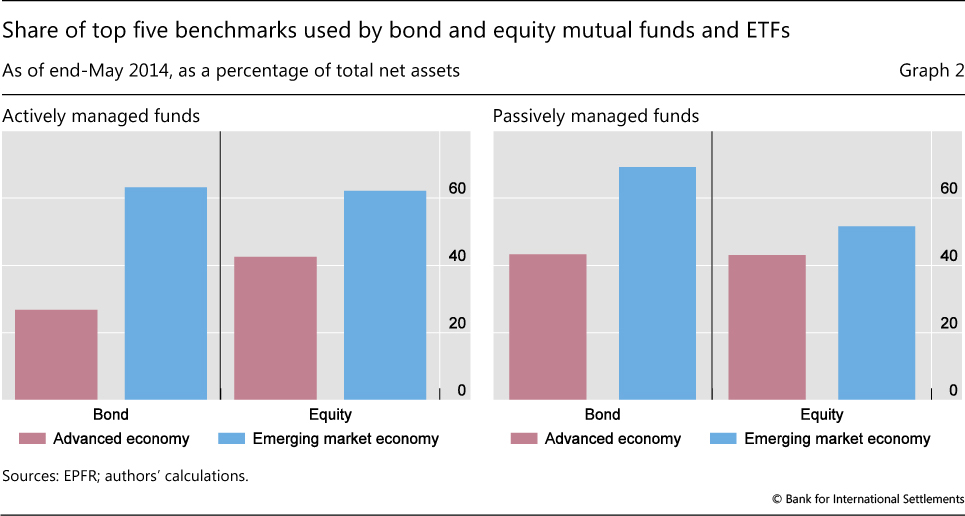
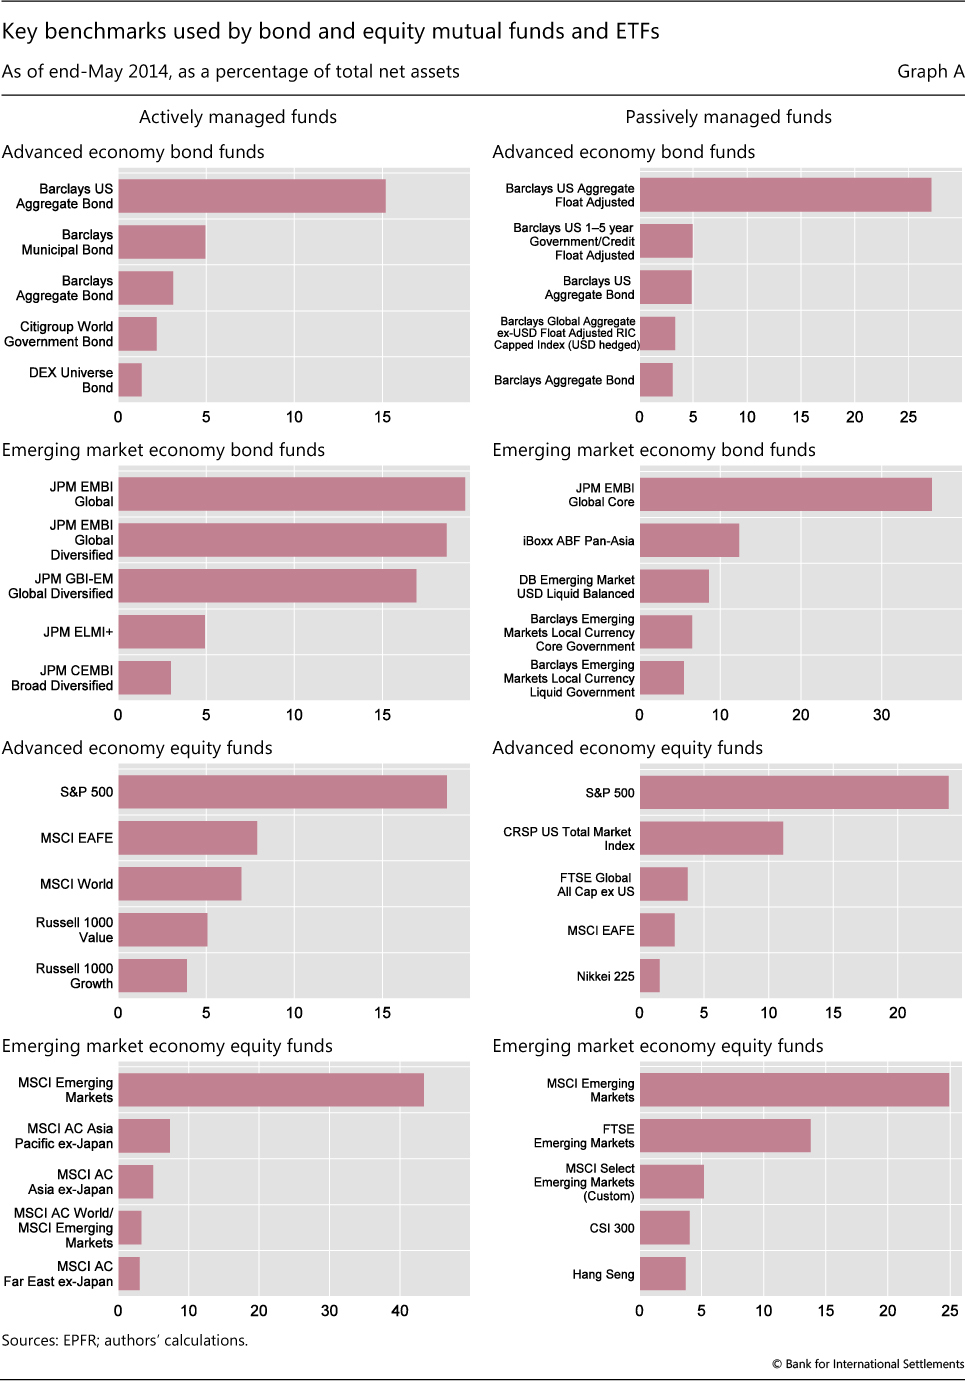
Mutual funds and ETFs investing in EME assets tend to have less diverse benchmarks than those investing in AE assets, in part because there are fewer benchmark indices available. Graph 2 shows that the share of AUM linked to the top five benchmarks is larger for each category of EME funds than for the corresponding category of AE funds. Graph A in the box shows the list of these benchmarks for the eight categories in Graph 2.
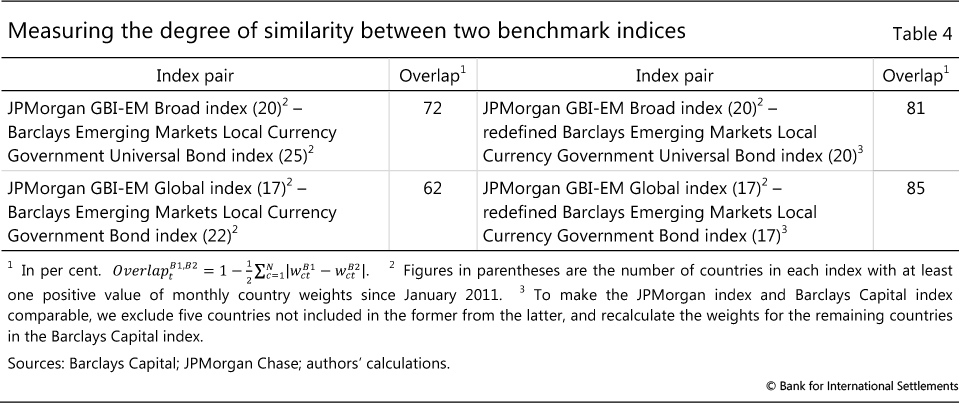
But even if asset managers benchmark their performance to different indices, benchmarking may induce correlation if the indices themselves are correlated. This may be because benchmark providers use similar methodologies in constructing indices or because benchmark indices tend to comprise the whole range of investable assets rather than a smaller subset. To formally examine the correlation across indices, we use the definition of the active share to calculate how similar two indices from different benchmark providers are between January 2011 and June 2014. Table 4 shows that comparable global EME local currency bond indices provided by JPMorgan Chase and Barclays Capital have more than an 80% overlap.
The low share of activism, the high concentration in the use of benchmarks and the strong correlation between benchmarks introduce a high degree of similarity in the behaviour of asset managers investing in EME assets. In the next subsection, we show that the behaviour of ultimate investors adds to this correlation.
Ultimate investor flows
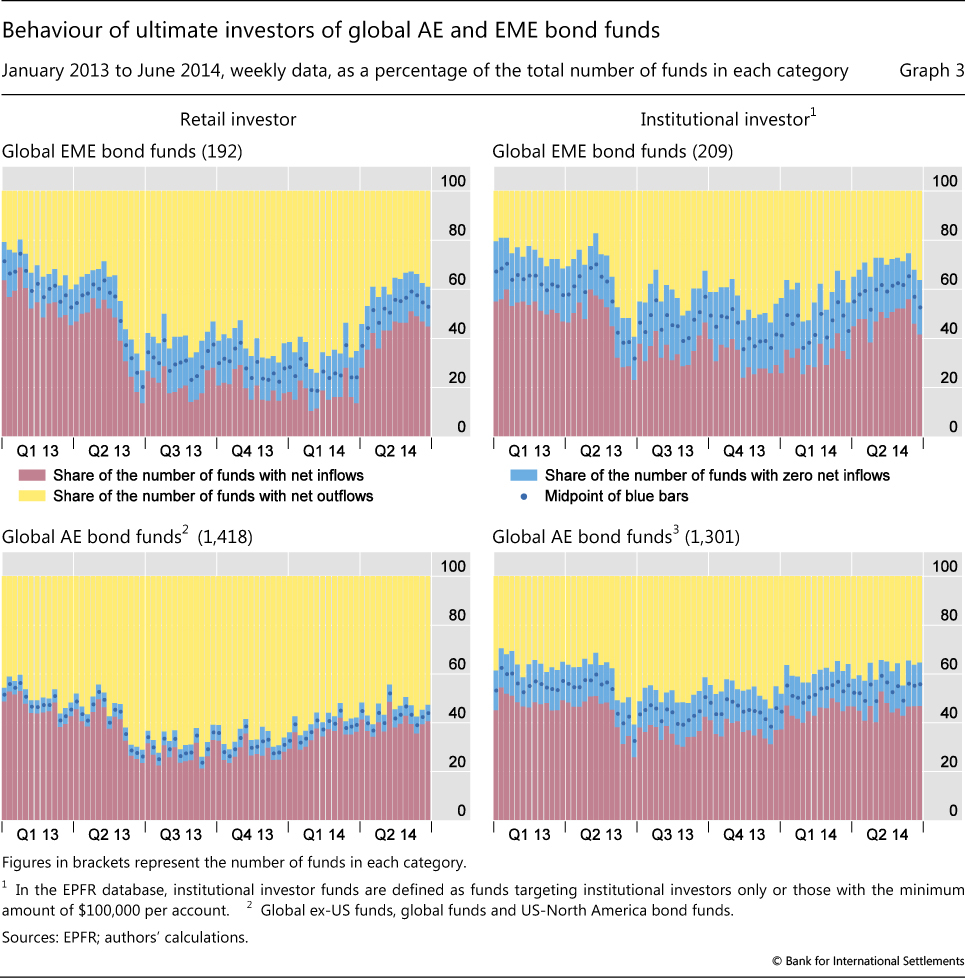
The co-movement of inflows from ultimate investors to mutual funds is another important source of correlation of asset managers' investments. Retail investors, in particular, tend to move their investments in the same direction most of the time. To arrive at this finding, we count the number of bond funds that faced weekly net inflows or outflows each week from January 2013 to June 2014 for retail and institutional investors. We find that retail investors have a tendency to buy (Graph 3, left-hand panels, red bars) or sell (yellow bars) at the same time.13 The direction switched from net inflows to outflows in June 2013, and the degree of co-movements remained high up to the first quarter of 2014. There appears to be less co-movement on the part of institutional investors (Graph 3, right-hand panels). A large number of institutional investors pulled out their funds in June 2013, but the number of funds experiencing inflows and outflows has since remained relatively balanced.
The finding that retail investors in particular behave very similarly to each other is not specific to EME funds, as can be seen from the similarity between the top and bottom panels of Graph 3. What is different is the volatility of the share of funds facing inflows or outflows, which is greater for EME funds than for AE funds.
Emerging market benchmarks
To measure concentration in the use of benchmarks of EME asset funds, we identify a benchmark index adopted by each fund and then aggregate the AUM of all funds using the index. Graph A shows that EME equity and bond funds are more concentrated than their AE counterparts in their use of benchmarks. For example, two JPMorgan EMBI Global indices are used for 38% of the total AUM of actively managed EME bond funds in the EPFR database, while two Barclays Capital bond indices are used for 20% of the total AUM of actively managed AE bond funds.
Given the wide use of a small number of benchmark indices, their construction and composition are crucial. Major indices have been created by broker-dealers. Indices such as Morgan Stanley's MSCI equity indices, JPMorgan Chase's EMBI and GBI bond indices and Barclays Capital's bond indices are typically constructed on the basis of tradability, liquidity, credit rating and valuation criteria. Under these criteria, an issuer with a larger amount of marketable securities receives a larger index weight. Other weighting schemes are also used. For example, Barclays Capital offers bond indices that weight countries by GDP or fiscal strength.
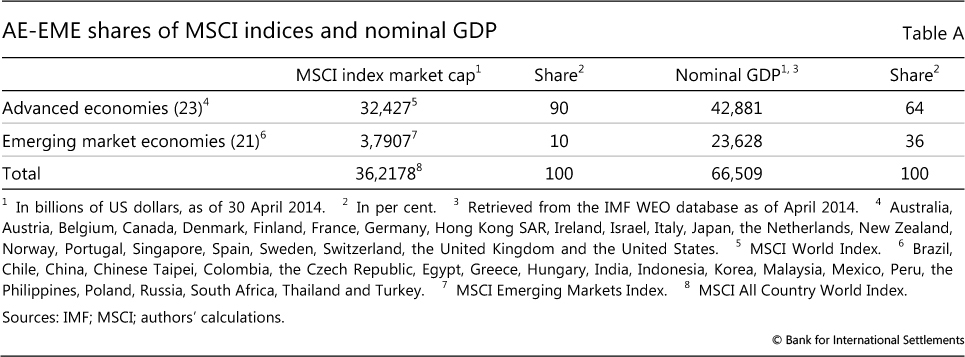
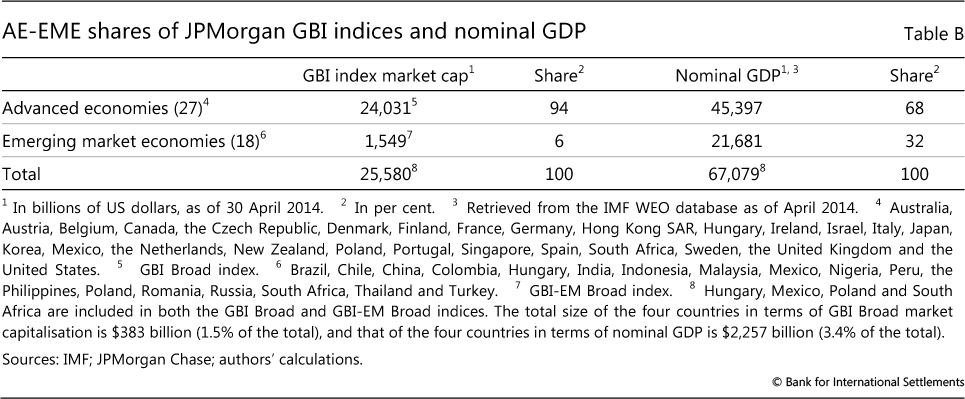
As an illustration, the EME share in the global equity and bond indices is much smaller than their GDP share. In particular, in the MSCI All Country World Index (ACWI), which includes 23 major AEs and 21 major EMEs, the EME share is 10%. This contrasts with the GDP share of 36% of the same 21 EMEs out of the total GDP of the 44 economies (Table A). The same is true for the JPMorgan GBI Broad index for 27 AEs and the JPMorgan GBI-EM Broad index for 18 EMEs. When we combine these two indices, the EME share is 6%, while their GDP share is 32% (Table B).
Recently, index providers have become progressively more independent. As an example, for the Markit iBoxx ABF indices, Markit collects prices from multiple sources, controls for quality and then computes an average of the price on a daily basis. Moreover, in October 2012, the market weights of the Markit iBoxx ABF indices were adjusted to consider the following three factors: local bond market size (20%), sovereign local debt rating (20%) and the GEMLOC Investability Indicator (60%). In July 2010, Pacific Investment Management Company (PIMCO) also launched two GDP-weighted sovereign bond indices (PIMCO Global Advantage Government Bond Index and European Advantage Government Bond Index) using the individual Markit country components.
The GEMLOC Investability Indicator is a measure of accessibility to foreign investors based on a methodology developed by the World Bank. The indicator scores a market on a set of 14 subfactors that are aggregated to the overall score.
We support this conclusion through more formal statistical analysis using a clustering measure à la Lakonishok et al (1992).14 In particular, we first divide the number of global AE and EME bond funds facing net inflows in a given week by the number of funds facing either net inflows or outflows, and use the ratio as the expected share of funds facing inflows in that week. Then, we calculate the 95% confidence interval around the expected share under a binomial distribution for that week.15 We calculate this interval for each of 78 weeks to control for common shocks on inflows to all global bond funds each week. Finally, we check each week if the specific share of global EME bond funds lies within this interval.
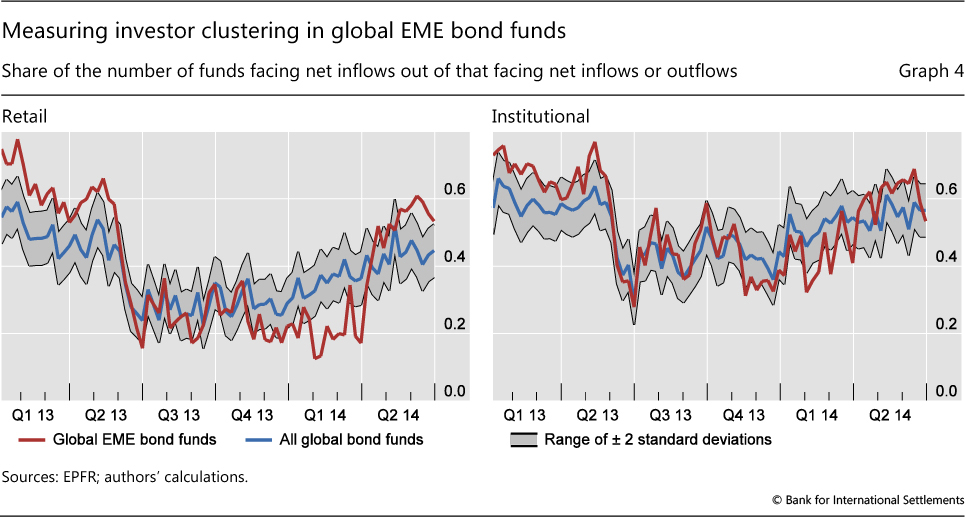
We find that retail investor flows exhibit clustering more often than institutional investor flows. In particular, the left-hand panel of Graph 4 shows that the share of global EME bond funds facing net retail investor inflows falls outside the 95% confidence band in 49 out of the 78 weeks throughout the sample period. The right-hand panel shows that institutional investor flows display similar patterns, although investor clustering is both less frequent (30 out of 78 weeks) and less severe.
Investor behaviour during recent bouts of market turbulence
In this section, we analyse the behaviour of ultimate investors during the recent episodes of financial market volatility. We examine two dimensions of investment behaviour: whether investment flows to EME assets have differed between retail and institutional investors, and whether these investment flows and the related asset returns have been procyclical, ie have reinforced each other's movements. It should be noted that, as discussed in the previous section, correlated behaviour on its own does not lead to procyclicality.
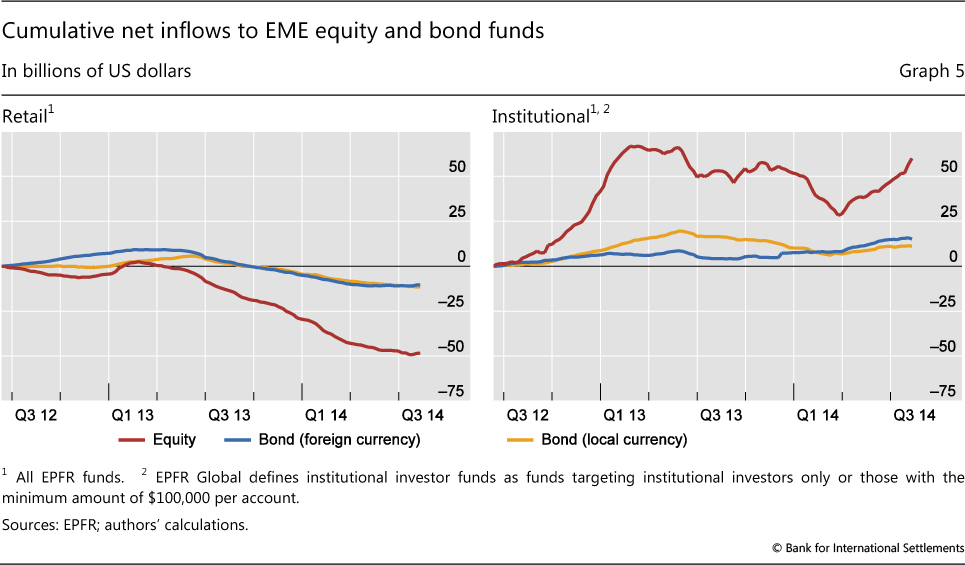
On the first dimension, the data summarised in Graph 5 suggest that retail and institutional investors behave differently. The left-hand panel shows that retail investors have moved their money out of mutual funds and ETFs dedicated to EME equities since the first quarter of 2013, and out of those dedicated to EME bonds since May 2013. By contrast, the right-hand panel shows that institutional investors withdrew less than retail investors, even though they adjusted their net exposure in a more volatile manner. Moreover, data from the large global custodians suggest that relatively large institutional investors have held onto, and even increased, their holdings of EME assets during the same period (IMF (2014)).
The second dimension is whether investment flows to EMEs can be a source of cyclical instability. If investors move funds into EME asset markets by chasing returns, inflows would increase in response to domestic asset price and exchange rate appreciation. Such inflows could create procyclical flow-price dynamics if, in response, domestic asset prices and exchange rates appreciated further.
To shed some light on this question, we estimate a small vector autoregressive (VAR) model. It allows us to capture the dynamic interaction between variables relying on a minimal number of assumptions about the overall model structure. The VAR model can be used to compute the typical response over time of one variable to unforecastable changes ("surprises") in other variables.
Our VAR model includes two endogenous variables - cumulative net inflows and US dollar-denominated total returns.16 The latter variable's movements can be due to those of domestic asset prices and/or exchange rates. We do not attempt to disentangle the two effects. The model is estimated by investor type (retail and institutional) for each type of EME asset (equities, foreign currency bonds and local currency bonds) using weekly data that span the period from June 2012 to early August 2014.
Our results suggest that both retail and institutional investor flows to EME assets, and the total returns on these assets in US dollar terms, are generally procyclical. For instance, a one standard deviation surprise rise in equity returns in US dollar terms raises both retail and institutional equity flows by a similar magnitude.17 The effect is statistically significant. The response of equity returns to a one standard deviation surprise increase in equity flows is also significantly positive for both retail and institutional investors.18 We obtain broadly similar results for foreign currency and local currency bond flows.
Taken at face value, these results do not conform to the view that institutional flows are relatively less procyclical than retail flows because institutional investors internalise the negative consequence of trading due to their larger market share (Chen et al (2010)). One possible explanation is that, as mentioned above, the individual institutional investors represented by EPFR data are relatively small in size − therefore similar to retail investors − compared with those that use the major global custodians.
Conclusion
In this article, we have argued that the asset management industry could potentially be a source of vulnerabilities for EME asset markets. In particular, there is a higher degree of concentration in the use of benchmarks by asset managers investing in EME assets than by those investing in AE assets. Also, we find more clustering in ultimate investor flows in EME assets than in those in AE assets. These factors can increase the correlation in the behaviour of asset managers and, under certain conditions, raise the potential for one-sided markets in EMEs. Indeed, during the past two years, investor flows to asset managers and EME asset prices reinforced each other's movements.
The possibility that asset managers and their ultimate investors destabilise EME asset markets is obviously highly relevant for policymakers. The current prudential regulation of the asset management industry mainly focuses on microprudential and consumer protection aspects and does not really address any issues that give rise to correlated behaviour across asset managers or the procyclicality of investor flows and asset prices. Understanding these macroprudential aspects would be an important step towards monitoring vulnerabilities created by asset managers and designing an effective policy response.
References
Chen, Q, I Goldstein and W Jiang (2010): "Payoff complementarities and financial fragility: evidence from mutual fund flows", Journal of Financial Economics, vol 97(2), pp 239-62.
Chui, M, I Fender and V Sushko (2014): "Risks related to EME corporate balance sheets: the role of leverage and currency mismatch", BIS Quarterly Review, September, pp 35-47.
Cipriani, M and A Guarino (2014): "Estimating a structural model of herd behaviour in financial markets", American Economic Review, vol 104(1), pp 224-51.
Cremers, M and A Petajisto (2009): "How active is your fund manager? A new measure that predicts performance", Review of Financial Studies, vol 22(9), pp 3329-65.
Feroli, M, A Kashyap, K Schoenholtz and H S Shin (2014): Market tantrums and monetary policy, report prepared for the 2014 US Monetary Policy Forum, 28 February.
International Monetary Fund (2014): "How do changes in the investor base and financial deepening affect emerging market economies?", Global Financial Stability Report, Chapter 2, April.
Lakonishok, J, A Shleifer and R Vishny (1992): "The impact of institutional trading on stock prices", Journal of Financial Economics, vol 32(1), pp 23-44.
Morris, S and H S Shin (2014): "Risk-taking channel of monetary policy: a global game approach", mimeo.
Raddatz, C, S Schmukler and T Williams (2014): "International asset allocations and capital flows: the benchmark effect", World Bank, Policy Research Working Papers, no 6866.
Woolley, P and D Vayanos (2012): "Taming the finance monster", Central Banking Journal, December, pp 57-62.
1 The views expressed in this article are those of the authors and do not necessarily reflect those of the BIS. We are grateful to Claudio Borio, Michael Chui, Hervé Hannoun, Soyoung Kim, Madhusudan Mohanty, David Ng, Frank Packer, Sergio Schmukler, Hyun Song Shin and Christian Upper for discussion and comments. We also thank Tracy Chan, Steven Kong, Jimmy Shek and Agne Subelyte for research assistance.
2 Terminologies differ by country. For instance, open-end funds are called mutual funds in the United States and UCITS (undertakings for collective investment in transferable securities) in the European Union. In this article, we use the term "mutual funds" for collective investment vehicles, which include traditional open- and closed-end funds managed by AMCs, but not hedge funds.
3 The total includes AMCs which are either independent or owned by banks or insurers. Also included are some independent hedge funds, which represent only a small share. Of the top 20, nine AMCs were bank-owned, eight independent and three insurer-owned. In some cases, an institution's total assets could be larger than those under its asset management function.
4 As of end-May 2014, the total amount of AUM by mutual funds and ETFs in the EPFR database globally amounted to about $23 trillion. EPFR Global collects data on total net assets and flows by investor (retail and institutional), country and asset type. The database covers some 11,000 equity funds and about 4,500 fixed income funds, among others. The coverage of EME assets is generally not very comprehensive, and particularly weak for EME bonds.
5 EPFR Global defines institutional investor funds as funds targeting institutional investors only or those with the minimum amount of $100,000 per account.
6 The estimated $700 billion may be considered as an upper bound to the extent that many of the funds are located in advanced economies and are likely to trade EME assets in offshore markets.
7 Ultimate investors typically use market capitalisation-weighted indices as benchmarks for evaluating fund manager performance. This follows from the efficient markets hypothesis that market portfolios constitute optimal, minimum-risk portfolios. But since component securities can easily be mispriced in reality, investors may be putting most money in overpriced securities and least in undervalued ones (Woolley and Vayanos (2012)). This practice tends to amplify price distortions and in turn distort the benchmark itself.
8 Passively managed funds typically aim to track the performance of benchmark indices by using so-called "representative sampling techniques", and thus do not hold all the securities in a benchmark index.
9 The active shares at the security level could be higher. Unfortunately, we were not able to compute them owing to data limitations.
10 A closet index fund is an asset management fund that claims to actively manage its portfolio but in reality emulates a benchmark index.
11 It is difficult to judge whether a coefficient of 0.87 means a high degree of passivity in absolute terms. However, the coefficient on the benchmark weight in a similar regression analysis conducted by Raddatz et al (2014) for all global and regional AE and EME bond funds over a different sample period is smaller than that reported in Table 3. Therefore, we can infer that global and regional EME bond funds tend to follow their benchmarks more closely than global and regional AE bond funds.
12 The size of the coefficient on the median peer weight for closet index funds and for weakly active funds is around one quarter and one third that of the corresponding coefficient on the benchmark weight, respectively.
13 We consider global EME, global ex-US, global and US-North America bond funds with investor flow information over the 78 weeks available in the EPFR database. There are 1,610 retail investor funds in these four categories of bond funds out of 2,371 retail investor funds, and 1,510 institutional investor funds in these four categories out of 2,196 institutional investor funds.
14 As pointed out by Cipriani and Guarino (2014), we present indirect evidence of informational herding in financial markets through a statistical measure of clustering. This measure cannot distinguish between spurious herding (eg the result of a common reaction to EME-specific news) and true herding (ie the decision to disregard one's private information to follow the behaviour of others).
15 For binomial distribution B(n, p), n is the total number of global EME bond funds facing either net inflows or outflows, and p the expected share of global AE and EME bond funds facing net inflows.
16 The data are expressed in terms of weekly percentage changes. Flows are assumed to be slower-moving than total returns. That is, flows do not react contemporaneously to prices but prices can react contemporaneously to flows.
17 Equity flows increase by about 0.5% and gradually fall back to the baseline after a few weeks.
18 Returns increase by about 1.5% and revert to the baseline after one week.