Introduction to BIS statistics
The BIS is expanding its statistics by publishing additional data, revamping how these data are disseminated and strengthening their policy orientation. This special feature briefly describes each BIS data set and explains how the statistics can be used for analysis.1
The statistics published by the BIS are a unique source of information about the structure of and activity in the global financial system. They are compiled in cooperation with central banks and other national authorities and are designed to inform analysis of financial stability, international monetary spillovers and global liquidity. Some BIS statistics, in particular those on international banking, securities markets and derivatives activity, are part of special collections under the auspices of BIS-hosted committees of central banks. Other BIS statistics draw on national data but incorporate assumptions and estimations by BIS statisticians to construct specific measures, such as global liquidity indicators, aggregate credit figures, debt service ratios and effective exchange rates.
With this edition of the BIS Quarterly Review, the BIS is expanding its statistical offering. The BIS is releasing enhanced data on international banking, new series on government debt, and estimates of debt service ratios for selected sectors (see the related special features in this issue). Furthermore, the BIS is revamping how it disseminates data. The tables previously published in the statistical annex to the Review have been replaced with charts illustrating the latest developments.2 The tables have been redesigned in a new publication, the BIS Statistical Bulletin, and made accessible in a new dynamic web-based tool, the BIS Statistics Explorer.3
A key objective of this expansion is to promote the wider use of BIS statistics, especially for policy analysis. It builds on an international initiative to improve the availability of key information for policymakers to assess risks across countries. This Data Gaps Initiative is endorsed by the G20 and overseen by the Inter-Agency Group of international organisations, of which the BIS is a member.4
This special feature briefly describes each BIS data set and explains how the statistics can be used for analysis. Each section corresponds to the section in the Bulletin where the respective statistics are published.
Locational banking statistics
www.bis.org/statistics/about_banking_stats.htm
Under the auspices of the Committee on the Global Financial System (CGFS), the BIS compiles and publishes two sets of statistics on international banking activity: the locational banking statistics (LBS) and the consolidated banking statistics (CBS).
The LBS provide information about the currency composition of banks' balance sheets and the geographical breakdown of their counterparties. They capture outstanding claims and liabilities of internationally active banks located in reporting countries against counterparties residing in more than 200 countries. Banks record their positions on an unconsolidated basis, including intragroup positions between offices of the same banking group. The data are compiled following principles that are consistent with balance of payments statistics. Currently banking offices located in 44 countries, including many offshore financial centres, report the LBS. The LBS capture around 95% of all cross- border interbank business.
The availability of a currency breakdown in the LBS, coupled with the reporting of breaks in series arising from changes in methodology, reporting practices or reporting population, enables the BIS to calculate break- and exchange rate- adjusted changes in amounts outstanding. Such adjusted changes approximate underlying flows during a quarter.5
Extension of domestic credit and external debt measures
The LBS complement monetary and credit aggregates by providing information on banks' cross-border and foreign currency positions. Indeed, the LBS were first compiled in the 1960s to track the growth in US dollar deposits outside the United States. This was especially important in the 1960s and 1970s, when policymakers had concerns about the possible macroeconomic consequences of the expansion of the money supply through the so-called eurocurrency markets (international deposit and loan markets).
Nowadays, extending domestic credit aggregates and supplementing external debt measures are more important uses of the LBS. As international financial crises have shown, banks located abroad can be significant - and volatile - sources of credit. Therefore, the LBS can provide a useful signal regarding potential fragilities in the financial system. In particular, the LBS can help monitor the build-up of vulnerabilities associated with cross-border and foreign currency bank credit. For example, studies using the LBS have found that cross-border bank credit tends to grow considerably faster than overall credit during the expansionary phase of the financial cycle and that international credit is often a major driver of domestic credit booms (see eg Avdjiev, McCauley and McGuire (2012) and Borio et al (2011)). Furthermore, the currency breakdown available in the LBS gives insights into international monetary policy spillovers and has been used to document the importance of European banks in US dollar intermediation outside the United States (Shin (2012)). Finally, the LBS can also be utilised to analyse potential mismatches in the currency and sectoral composition of external assets and liabilities.
Geography of international banking
The details available in the LBS shed light on the role of banks in the intermediation of international capital flows and the structure of their intermediation. They reveal not only the residence and sector of banks' counterparties, but also the instruments and currencies in which banks transact and the residence and nationality of the banks. In short, the LBS help track how funds are transferred from sources in one country via banks to users in another. Various studies have used the LBS to analyse banks' role in the transmission of shocks across countries via bank lending and funding (see eg Bernanke et al (2011) and Bruno and Shin (2015)).
The LBS are best suited for analysing interconnections at the country level: for example, the importance of intragroup positions in cross- border funding; the channelling of funds through offshore financial centres; or the recycling of the petrodollars of oil exporters (see eg von Peter (2007) and McGuire and Tarashev (2008)).
Understanding the drivers of bank flows between countries requires information about who makes the underlying economic decisions. Key decisions are typically made by the head office of a bank, and thus for financial stability analysis it is often more important to know the nationality of the bank than its location. The CBS, discussed in the next section, provide the most comprehensive information on foreign lending by bank nationality. The LBS complement the CBS by providing information that can be used to track banks' cross-currency funding and investment patterns on a nationality basis (see eg Fender and McGuire (2010) and McGuire and von Peter (2012)). Recent enhancements to the LBS provide additional information by nationality (Avdjiev et al (2015)).
Consolidated banking statistics
www.bis.org/statistics/about_banking_stats.htm
The CBS capture the worldwide consolidated positions of internationally active banking groups headquartered in reporting countries. The data include the claims of reporting banks' foreign affiliates but exclude intragroup positions, similarly to the consolidation approach followed by banking supervisors. For example, the positions of a German bank's subsidiary located in London - which in the LBS are included in the positions of banks in the United Kingdom - are consolidated in the CBS with those of its parent and included in positions of German banks. Currently, banking groups from 31 countries report the CBS.
Like the LBS, the CBS are reported to the BIS at an aggregate (banking system) level rather than individual bank level. A central bank or another national authority collects data from internationally active banks in its jurisdiction, compiles national aggregates and then sends them to the BIS to calculate global aggregates. No currency breakdown is available for the CBS, and thus the BIS does not calculate adjusted changes. Comparisons of amounts outstanding between periods are thus affected by movements in exchange rates.6
The CBS are compiled in two different ways: by immediate counterparty and by ultimate risk. The immediate counterparty is the entity with whom the bank contracts to lend or borrow. Ultimate risk takes account of credit risk mitigants, such as collateral, guarantees and credit protection bought, that transfer the bank's credit exposure from one counterparty to another. For example, suppose that a German bank extends a loan to a company in Mexico and the loan is guaranteed by a US bank. On an immediate counterparty basis, the German bank would report the loan as a claim on Mexico. On an ultimate risk basis, the loan would be reported as a claim on the United States because, if the company in Mexico were unable to meet its obligations, then ultimately the German bank would be exposed to the US bank that guaranteed the loan. Data on an ultimate risk basis are better measures of exposures than data on an immediate counterparty basis because risk transfers may create a significant wedge between the two.
Banks' foreign exposures
The CBS are designed to analyse the exposure of internationally active banks of different nationalities to individual countries and sectors. Exposures can take many forms: for example, cross-border claims, local claims of banks' foreign affiliates, derivatives, guarantees, or credit commitments. The CBS provide information on each of these, and the most appropriate measure of exposure will depend on the issue being analysed. The benchmark measure in the CBS is foreign claims, which capture credit to borrowers outside the bank's home country, including credit extended by banks' foreign affiliates (but excluding derivatives, guarantees and credit commitments).7 Foreign claims are the most comparable measure across banks of diverse nationalities because differences in accounting standards complicate the comparability of other measures of exposures, especially derivatives.
The CBS on an ultimate risk basis are widely used to gauge reporting banks' exposures to different countries and sectors. For example, they have been used to measure foreign banks' exposures to US borrowers on the eve of the Great Financial Crisis of 2007-09 (see eg Borio and Disyatat (2011)). Other studies have used the CBS to contrast the evolution of euro area banks' sovereign portfolios with those of banks from the rest of the world (see eg Caruana and Avdjiev (2012)).
Borrowers' dependence on foreign bank creditors
From a borrower's point of view, the CBS also provide information about the main bank creditors to a given economy. The CBS on an immediate counterparty basis can be used to assess the dependence of individual borrowing countries and regions on foreign bank creditors. For example, based on these data, Avdjiev, Kuti and Takáts (2012) found that the sharp contraction in cross-border bank lending to emerging market economies that occurred in 2011 was largely linked to the deteriorating health of euro area banks.
In addition, the CBS data have been used to examine the transmission of adverse liquidity shocks from major banking systems to emerging market economies during the Great Financial Crisis (Cetorelli and Goldberg (2011)). And the maturity breakdown available in the CBS on an immediate counterparty basis has been used to construct indicators measuring the vulnerability of emerging market economies to sudden capital withdrawals through the banking system (see eg BIS (2011)).
Debt securities statistics
www.bis.org/statistics/about_securities_stats.htm
The BIS debt securities statistics capture borrowing in money and bond markets, distinguishing between international and domestic markets. International debt securities (IDS) are those issued in a market other than the local market of the country where the borrower resides (Gruić and Wooldridge (2012)). They encompass what market participants have traditionally referred to as foreign bonds and eurobonds. Domestic debt securities (DDS) are those issued by residents in their local market, regardless of the currency in which the securities are denominated. Total debt securities (TDS) sum these together as all debt securities issued by residents.
The BIS debt securities statistics are harmonised with the recommendations in the Handbook on Securities Statistics, which sets out an internationally agreed framework for classifying securities issues and holdings (BIS-ECB-IMF (2015)). IDS are compiled by the BIS from commercial data sources, in particular Dealogic, Euroclear, Thomson Reuters and Xtrakter; the BIS constructs aggregates from data on individual securities. DDS and TDS are compiled from national data sources using aggregated data. For some countries, national data are available for either DDS or TDS but not both; for this reason, DDS and TDS are not published for all countries. While conceptually TDS are the sum of IDS and DDS, the BIS does not calculate the missing series because it cannot control for potential double-counting: for example, individual securities that the BIS classifies as international may be included in the aggregated data on DDS.
As of end-March 2015, the BIS published IDS, DDS and TDS statistics for residents of 17 countries; IDS and DDS for a further 16 countries; IDS and TDS for 22 countries; and only IDS for 75 countries. The security-by-security information that underlies the IDS statistics enables the BIS to provide more details than are available in the DDS and TDS statistics (Box 1). Furthermore, the availability of DDS and TDS lags that of IDS by one quarter.
Box 1
Changes to the BIS international debt securities statistics
The BIS has expanded its international debt securities (IDS) statistics by publishing additional details by currency and interest rate type. Whereas previously data by residence and nationality of the issuer were disaggregated only by sector of the issuer and maturity of the security, the BIS now publishes, for each sector, information about the interest rate - fixed or variable - and the currency in which issues are denominated. Data by currency distinguish between issues denominated in the local currency of the country where the issuer resides - for example, the local currency for UK issuers is sterling - and foreign currencies, specifically the US dollar, euro and other foreign currencies combined. For data by nationality of issuer, no distinction is made between local and foreign currencies; data are published for the US dollar, the euro and all other currencies combined.
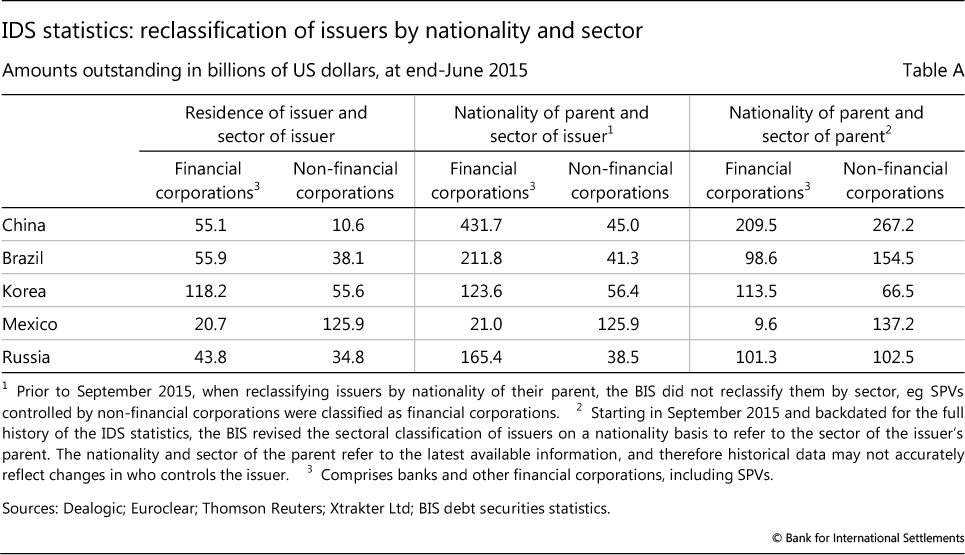
The BIS has also revised the sectoral classification of data by nationality of issuer. Previously, the sectoral classification of issuers by residence and nationality was based on the main business activity of the issuer. However, the main business activity of the issuer's parent entity may differ from that of the issuer. For the full history of the IDS statistics, the BIS has reclassified data by nationality to refer to the ultimate sector of the parent. For example, a special purpose vehicle (SPV) incorporated in the Cayman Islands and controlled by a Russian energy company is now classified as a non-bank financial corporation from the Cayman Islands on a residence basis but as a non-financial corporation from Russia on a nationality basis. Table A below shows the impact of this reclassification on issuers from selected emerging market economies. Amounts for non-financial corporations are much larger on a nationality basis than on a residence basis because of the reclassification of SPVs and other non-bank financial corporations controlled by non-financial corporations.
Structure and sources of bond financing
In many countries, money and bond markets are a major source of financing. Moreover, the development of local currency bond markets is generally seen as supporting financial stability, although it is not without challenges (CGFS (2007)). The BIS debt securities statistics can be used to gauge the growth and relative importance of these markets in different countries and for different sectors. Furthermore, the currency and maturity composition of outstanding issues can help elucidate borrowers' exposure to foreign exchange and rollover risks, respectively.
The debt securities statistics can also shed light on the activities of portfolio investors. Often little is known about the investors who buy debt securities. The LBS provide information about banks' holdings of debt securities and thus, when combined with the debt securities statistics, they can help infer the holdings of foreign non-bank investors. For most major emerging market economies, liabilities to foreign portfolio investors grew steadily in the early 2010s, in what was known as the second phase of global liquidity (Shin (2013)).
Offshore issuance
The IDS statistics provide information about both the residence and the nationality of the issuer, where the nationality is based on the country where the controlling parent - the entity that makes the underlying economic decisions - resides. Securities data by nationality are useful for identifying links between borrowers in different countries and sectors, enabling analysis of support that might be available from the parent, and aiding understanding of the likely use of funds (Avdjiev et al (2014)). For example, the debts of a Cayman Islands affiliate of a Chinese finance company may be guaranteed by the parent company and used to finance lending in China. While the nationality of the issuer can help identify related entities, they are no substitute for financial information on a consolidated basis or contractual information about guarantees.
The classification of IDS by nationality instead of residence results in a reallocation of issuance from financial centres to major economies. Outstanding IDS for the Cayman Islands, Ireland, the Netherlands and the United Kingdom are substantially lower on a nationality basis than on a residence basis, whereas those for Brazil, China and some other emerging market economies are much higher on a nationality basis (McCauley et al (2013)). Conventional external debt statistics do not fully capture this offshore issuance (Gruić and Wooldridge (2015)).
Derivatives statistics
www.bis.org/statistics/about_derivatives_stats.htm
The BIS compiles and publishes three sets of statistics on derivatives markets: quarterly statistics on derivatives traded on organised exchanges, semiannual statistics on outstanding positions in over-the-counter (OTC) derivatives markets, and triennial statistics on OTC derivatives and foreign exchange market activity. Together, they provide comprehensive measures for the size and structure of global derivatives markets.
The statistics on exchange-traded derivatives (XTD) cover the turnover and open interest (outstanding positions) of foreign exchange and interest rate futures and options (Box 2). The statistics are compiled from commercial data sources and currently cover contracts traded on over 50 organised exchanges.8 The main value added by the BIS is the conversion of data on the number of contracts into notional amounts using information about contract sizes. This enables consistent comparisons of levels and trends in activity across these different markets. The BIS does not publish XTD statistics for equity, commodity or credit contracts, nor for derivatives that reference non-standard underlying instruments (eg inflation, weather or energy contracts).
The semiannual OTC derivatives statistics are compiled under the auspices of the CGFS. They provide data on notional amounts outstanding and gross market values for all types of OTC contracts. Large dealers in 13 countries currently report the semiannual statistics. They report on a worldwide consolidated basis, including the positions of their foreign affiliates and excluding intragroup positions.
The Triennial Survey also provides data on amounts outstanding, but for a considerably larger set of reporting dealers in many more countries than the semiannual survey. Dealers report on a consolidated basis. In addition, the Triennial Survey has a separate part that covers data on turnover in OTC derivatives and foreign exchange markets. These turnover data are reported on an unconsolidated basis, by the sales desks of reporting dealers.
Box 2
Revisions to BIS exchange-traded derivatives statistics
The BIS has revised the compilation of its statistics covering derivatives traded on organised exchanges. The revisions affect the coverage as well as the measurement of activity, for the full history of the statistics (from 1993). They improve the comparability of the statistics on exchange-traded derivatives with those on over-the-counter derivatives collected in the Triennial Central Bank Survey.
In terms of coverage, the BIS has added more details about interest rate and foreign exchange derivatives contracts. In particular, data are now disaggregated by 24 currencies (including many emerging market currencies) as well as the maturity of the underlying interest rate (short-term, long-term). These breakdowns are in addition to the previously published disaggregation by instrument (futures, options) and location of the exchange (North America, Europe, Asia-Pacific, other markets). At the same time, the BIS discontinued the publication of data on equity index and commodity derivatives. The previous coverage of these market risk categories was incomplete, especially equity derivatives where single-stock contracts - derivatives that reference the securities of individual firms - were not covered.
On the measurement of activity, turnover now refers to average daily turnover in a given period, whereas previously it referred to total turnover in a quarter. Average daily turnover is calculated at the contract level and refers to total turnover in a given period divided by the number of trading days. It is more comparable over time and across exchanges than total turnover because the number of trading days may differ in any given month and country. In the Triennial Central Bank Survey, turnover is also measured as average daily activity.
The frequency of the turnover data has been increased from quarterly to monthly, but the data are updated only every three months, when the BIS Statistical Bulletin is published. In addition to turnover, the BIS publishes data on open interest (notional amount outstanding) at quarter-end.
Growth and liquidity of derivatives markets
Notional amounts outstanding and open interest can be used to gauge the economic and financial importance of derivatives markets. For example, the notional value of OTC derivatives contracts outstanding at end-2014 was $630 trillion, which was eight times greater than global output and 6.5 times larger than outstanding debt securities.
For some comparisons, notional amounts may be less meaningful than other measures. Notional amounts are influenced by changing structural factors. In XTD markets for instance, offsetting long and short positions are cancelled, which reduces open interest. By contrast, in OTC markets, positions are generally offset by entering a new contract, which boosts notional amounts. The shift to central clearing in OTC markets also boosts notional amounts by replacing one contract with two. That said, tearing up contracts through compression, which is a process that allows economically redundant derivative trades to be terminated early, is now well established in some segments of OTC derivatives markets, and reduces notional amounts.
The market value of outstanding contracts is an alternative measure. In the OTC derivatives statistics, the gross market value represents the maximum loss that market participants would incur if all counterparties failed to meet their contractual payments and the contracts were replaced at market prices on the reporting date. Market participants can reduce their exposure to counterparty credit risk through netting agreements and collateral. Accordingly, gross credit exposures adjust gross market values for legally enforceable bilateral netting agreements, although they do not take account of collateral.
Turnover is also a useful measure. It can be taken as an indicator of liquidity, albeit a rough one. Short-term interest rate futures tend to be the most liquid segment of derivatives markets. In June 2015, their daily average turnover exceeded $4 trillion, which amounted to about 20% of the respective open interest at end-June 2015. In addition, turnover can be used to compare the relative importance of XTD and OTC markets. In 2013, the share of derivatives that were traded over the counter was 56% in emerging market economies but less than 50% in advanced economies (Ehlers and Packer (2013)). Over the 1995-2013 period, the turnover of OTC interest rate swaps tended to grow faster than that of exchange-traded futures and options referencing government bond yields (Kreicher et al (2014)).
Reallocation of risk
Derivatives transfer risks among market participants. In and of themselves, the BIS derivatives statistics do not reveal the risks borne by market participants; for that, financial statement information would be needed, including on cash instruments and operational activities. But they do shed light on who is transferring risks and on the aggregate amount of risk transferred. For example, the semiannual OTC statistics reveal that non-dealers are relatively more likely than dealers to insure themselves against extreme price movements through the use of options: for almost every type of risk, dealers sold more options to non-dealers than they purchased from them.
Derivatives statistics also help to monitor the progress of efforts by policymakers to reduce systemic risks in derivatives markets by shifting the clearing and trading of OTC instruments to central counterparties and organised exchanges (FSB (2015)).
Global liquidity indicators
www.bis.org/statistics/gli.htm
The term "global liquidity" is used by the BIS to mean the ease of financing in global financial markets. Credit is among the key indicators of global liquidity and the focus of the global liquidity indicators estimated by the BIS (Domanski et al (2011)). Global liquidity in general and credit in particular influence the build-up of financial system vulnerabilities in the form of asset price inflation, leverage, or maturity or funding mismatches (Caruana (2014)).
The interaction of private and official factors determines the economy's overall ease of financing. For instance, financial institutions provide market liquidity to securities markets through their trading activities, and provide funding liquidity to borrowers through their lending activities. The terms on which these intermediaries can fund themselves, in turn, depend on the willingness of other market participants to interact with them. Prudential and macroeconomic policies, including the conditions under which central banks provide funding to the financial system, will affect these interactions (Eickmeier et al (2013)).
The BIS publishes quantity and price indicators that aim to capture global liquidity conditions. The indicators are constructed by mixing BIS statistics, in particular the LBS and IDS, with other national data.
The outstanding amount of credit shows how far the ease of financing has led to a build-up of exposures. In other words, credit to private sector borrowers reflects the outcome of financial intermediation in global markets. Unusually rapid changes in outstanding credit are associated with the build-up of vulnerabilities, with potential implications for financial stability. Much of this credit, although not all, is provided by banks, so the BIS indicators focus primarily on bank credit.
Of particular interest for the assessment of global liquidity is the international component of credit: cross-border lending to non-residents or lending in foreign currency. This is because the international component often provides the marginal source of financing in the run-up to financial crises. Although the international component is often small relative to total credit, swings in this component can amplify domestic trends and are highly correlated with booms and busts in global financial conditions.
Any assessment of global liquidity conditions requires that measures of global credit are put into perspective. Moreover, the informativeness of indicators changes over time, implying that a flexible and multifaceted approach is needed when assessing global liquidity conditions (CGFS (2011)). A range of supplementary price and quantity indicators can be used to capture additional specific aspects of global liquidity that are relevant for financial stability. These include measures of financing conditions in key financial markets and incentives for position-taking across market segments. These indicators tend to include proxies for risk appetite, which is a major driver of leverage and the willingness of private investors to provide funding.
Credit to the non-financial sector
www.bis.org/statistics/totcredit.htm
The BIS quarterly statistics on credit to the non-financial sector capture borrowing activity of the government sector and the private non-financial sector in 40 economies. Data on credit to the government sector cover on average 20 years, and those on credit to the private non-financial sector cover on average more than 45 years.
On the lending side, two credit data series are provided. "Total credit" comprises financing from all sources, including domestic banks, other domestic financial corporations, non-financial corporations and non-residents. "Bank credit" includes credit extended by domestic banks to the private non-financial sector.
On the borrowing side, "total credit" to the non-financial sector is broken down into credit to the government sector and the private non-financial sector, and the latter is further split between non-financial corporations and households (including non-profit institutions serving households).
The financial instruments covered comprise (i) currency and deposits (which are zero in the case of credit to the private non- financial sector), (ii) loans and (iii) debt securities. The sum of these three instruments is defined here as "core debt". For the government sector, core debt generally represents the bulk of total debt.9
The statistics follow the framework of the System of National Accounts 2008, which mandates that outstanding credit instruments be valued at market values where market prices are observable. For credit to the government, data are also provided for nominal (face) values of government credit, since these can be useful in some forms of debt sustainability analysis (eg projections based on assumed interest rates). Nominal values are used in the European Union fiscal rules (the so-called Maastricht gross debt).
Cross-country comparisons
Analysts can use the series on credit to the non-financial sector, when expressed in percentage points of GDP, to monitor trends in the debt of the non-financial sector and compare them across countries. They can examine credit developments by sector (ie government, private non-financial subsectors) and devise indicators that would point to developments that raise concerns about macroeconomic or financial stability. For example, Cecchetti et al (2010) estimate debt thresholds, above which a further increase in credit might have a significant impact on growth by threatening debt sustainability.
From a financial stability perspective, credit statistics help policymakers to detect boom and bust episodes of financial cycles. Medium-term fluctuations in credit and property prices are used to identify financial cycles, which are much longer than traditional business cycles (Drehmann et al (2012)).
Credit-to-GDP gap in the Basel III framework
Credit series play a prominent role within the Basel III framework, namely in providing guidance to supervisors on the use of the countercyclical capital buffer (CCB) introduced in 2010. The main objective of the CCB is to strengthen banks' defences against the build-up of systemic vulnerabilities (BCBS (2010)). The framework assigns the credit-to-GDP gap a prominent role in helping supervisors determine whether to activate or increase the required buffer and in supporting the communication of the related decisions.
The credit-to-GDP gap is defined as the difference between the credit-to-GDP ratio and its long-term trend (Borio and Lowe (2002, 2004)). Studies of past financial crises have found that it is a very useful early warning indicator for banking crises. The main objective of the CCB is to protect banks from the effects of the potentially large swings in credit, asset prices and risk-taking that characterise the financial cycle (Drehmann et al (2012)).
Share of banks in total credit and borrowing activity by main sectors
With the information provided by the BIS credit data set, long-term cross-country developments in the traditional provision of credit by domestic depository corporations can be examined and compared across countries with the evolution of total credit. This can shed light on the risk borne by monetary institutions. For example, in the United States banks currently extend only around 30% of total credit, while in Germany or Greece the figure comes closer to 70% and 90%, respectively. While for some countries domestic banks have become a less important source of credit, for others domestic banks have become more important (Dembiermont et al (2013)).
It is also possible to study trends in indebtedness in specific sectors. As regards household and non-financial corporate credit, for example, the BIS data suggest that, in most economies, borrowing by households has increased over the past 40 years. In particular, for emerging market economies, household borrowing, which generally accounted for only 10-20% of private non-financial credit at the time data were first collected (typically the 1990s), now makes up 30-60% (Dembiermont et al (2013)). Regarding the government sector, the massive increase in public sector borrowing in many advanced economies has reinforced concerns about the sustainability of public debt. For instance, since the Great Financial Crisis, public debt in advanced economies has risen on average by 30 percentage points of GDP.
Debt service ratios
www.bis.org/statistics/dsr.htm
The BIS compiles and publishes aggregate debt service ratios (DSRs) for the private non-financial sector (PNFS). The DSR reflects the share of income used to service debt, given interest rates, principal repayments and loan maturities. It provides a more comprehensive assessment of credit burdens than the credit-to-income ratio or simple measures of interest payments relative to income, because it takes both interest payments and amortisations into account.
The DSRs are constructed using data inputs such as income, debt, interest rates and average remaining maturity. The data are primarily based on national accounts and reasonable estimates made by the BIS in liaison with national authorities about maturity structures from countries where more granular data are available. The DSRs are available for the household sector, the non-financial corporate sector and the total PNFS, which includes the other two sectors. The three-sector decomposition is available for 17 countries. Total PNFS DSRs are also available for 15 additional countries, using different and simplified income and interest rates measures, due to limited data availability at the national level.
The DSR is an especially important variable for understanding the interactions between the financial and the business cycle. Even in the absence of a crisis, a high DSR can have a strong negative impact on consumption and investment (Juselius and Drehmann (2015)). It was also proven to be a highly reliable early warning indicator for systemic banking crises, as a complement to stock- based leverage measures (Drehmann and Juselius (2014)). It is most meaningful to compare DSRs over time within a specific country, for instance by looking at deviation of DSRs from a country-specific mean, because of the difficulties in pinpointing the level accurately. In a cross-country context, such an approach will also take care of different institutional and behavioural settings affecting the underlying estimates for remaining maturities. Thus, removing country-specific averages first allows for a more appropriate cross-country comparison of how DSRs have evolved over time.
Residential property price indices
Households, analysts and policymakers share a keen interest in property price developments. Buying a house is often the largest single transaction for a household, and property its largest asset. Fluctuations in house prices have a large impact on households' net wealth, and their propensity to spend. In addition, residential property values underpin much of the mortgage market in advanced economies. This makes house markets a central element in the analysis of trends in aggregate expenditure, the strength of bank balance sheets and the interactions of macroeconomic and financial stability. Moreover, house prices are relevant to statisticians who compile macroeconomic series on households' wealth, or consumer price indices (Scatigna et al (2014)).
Characteristics of residential property price indicators
Property price data series differ significantly from country to country in international data sets. They may vary in terms of frequency, type of property and vintage, area covered, priced unit, compilation method or seasonal adjustment. The specificities of each country's residential property markets and the absence of binding international standards for property price statistics could explain this variety of dimensions.
The BIS started to publish its detailed residential property price data set under the aegis of the Data Gaps Initiative. The BIS data set comprises more than 300 residential property price series for 57 countries, including long series for 23 countries. The number of series published for each country varies along a number of dimensions, reflecting two aspects: first, the number of available breakdowns (for example, new and existing dwellings, or dwelling types); and second, the number of distinct compilers. Data are collected with the assistance of national central banks from various public and private sources.
BIS efforts to improve comparability
To facilitate cross-country analysis, the BIS also publishes a set of indicators that are intended to be as homogeneous as possible given the prevailing discrepancies in sources and compilation methods. These series, which are published in the BIS Statistical Bulletin, contain a single residential property price indicator per country, covering in most cases all types of dwellings - that is, both new and existing dwellings - in the country as a whole. Furthermore, for all but a few countries, the selected indicator is quality- or at least size-adjusted. The selection is based on the Handbook on Residential Property Prices and the experience and metadata of central banks. Nominal and real price series are provided, where the real price is calculated as the nominal value deflated by the consumer price index. An analysis of residential property price developments based on these indicators is published on a quarterly basis, and a longer-term view is provided each June in the BIS Quarterly Review.
Effective exchange rate indices
www.bis.org/statistics/eer.htm
A nominal effective exchange rate (NEER) is an index based on a trade-weighted average of bilateral exchange rates. A real effective exchange rate (REER) is the NEER adjusted by some measure of relative prices or costs. Changes in the REER thus take into account both nominal exchange rate developments and the country's inflation differential vis-à-vis trading partners.
For both policy and market analysis, effective exchange rates (EERs) provide a useful summary indicator of the overall strength or weakness of a country's currency. EERs can thus serve various purposes: as a measure of international price and cost competitiveness, as components of monetary/financial conditions indices, as a gauge of the transmission of external shocks, as an intermediate target for monetary policy, or as an operational target. Accurate measures of EERs are thus essential for both policymakers and market participants. An appreciable amount of work went into adjusting trade weights for the entrepot trade in Hong Kong SAR, which makes a difference for the trade weights for China in particular (Klau and Fung (2006)).
The BIS EER indices currently cover 61 economies (including individual euro area countries and, separately, the euro area as an entity). Nominal EERs are calculated as geometric weighted averages of bilateral exchange rates. The weighting scheme adopted is based on Turner and Van 't dack (1993). The weights are derived from manufacturing trade flows and capture both direct bilateral trade and third-market competition by double-weighting. Real EERs are the same weighted averages of bilateral exchange rates adjusted by relative consumer prices in the two countries.
References
Avdjiev, S, M Chui and H S Shin (2014): "Non-financial corporations from emerging market economies and capital flows", BIS Quarterly Review, December, pp 67-77.
Avdjiev, S, Z Kuti and E Takáts (2012): "The euro area crisis and cross-border bank lending to emerging markets", BIS Quarterly Review, December, pp 37-47.
Avdjiev, S, R McCauley and P McGuire (2012): "Rapid credit growth and international credit: challenges for Asia", BIS Working Papers, no 377, April.
Avdjiev, S, P McGuire and P Wooldridge (2015): "Enhanced data to analyse international banking", BIS Quarterly Review, September, pp 53-68.
Bank for International Settlements (2011): "Highlights of the BIS international statistics", BIS Quarterly Review, December, pp 15-27.
Bank for International Settlements, European Central Bank and International Monetary Fund (2015): Handbook on Securities Statistics.
Basel Committee on Banking Supervision (2010): Guidance for national authorities operating the countercyclical capital buffer, Annex 1.
Bernanke, B, C Bertaut, L DeMarco and S Kamin (2011): "International capital flows and the returns to safe assets in the United States, 2003-2007", Bank of France, Financial Stability Review, issue 15, February, pp 13-26.
Borio, C and P Disyatat (2011): "Global imbalances and the financial crisis: link or no link?", BIS Working Papers, no 346, May.
Borio, C and P Lowe (2002): "Asset prices, financial and monetary stability: exploring the nexus", BIS Working Papers, no 114, July.
Borio, C and P Lowe (2004): "Securing sustainable price stability: should credit come back from the wilderness?", BIS Working Papers, no 157, July.
Borio, C, R McCauley and P McGuire (2011): "Global credit and domestic credit booms", BIS Quarterly Review, September, pp 43-57.
Bruno, V and H S Shin (2015): "Capital flows, cross-border banking and global liquidity", Journal of Monetary Economics, vol 71, pp 119-32.
Caruana, J (2014): "Global liquidity: where it stands and why it matters", IMFS Distinguished Lecture at the Goethe University, Frankfurt, March.
Caruana, J and S Avdjiev (2012): "Sovereign creditworthiness and financial stability: an international perspective", Bank of France, Financial Stability Review, issue 16, April, pp 71-85.
Cecchetti, S, M Mohanty and F Zampolli (2010): "The future of public debt: prospects and implications", BIS Working Papers, no 300, March.
Cetorelli, N and L Goldberg (2011): "Global banks and international shock transmission: evidence from the crisis", IMF Economic Review, vol 59(1), April, pp 41-76.
Committee on the Global Financial System (2007): "Financial stability and local currency bond markets", CGFS Publications, no 28, June.
--- (2011): "Global liquidity - concepts, measurement and policy implications", CGFS Papers, no 45, December.
Dembiermont, C, M Drehmann and S Muksakunratana (2013): "How much does the private sector really borrow - a new database for total credit to the private non-financial sector", BIS Quarterly Review, March, pp 65-81.
Domanski, D, I Fender and P McGuire (2011): "Assessing global liquidity", BIS Quarterly Review, December, pp 57-71.
Drehmann, M, C Borio and Tsatsaronis K (2012): "Characterising the financial cycle: don't lose sight of the medium term!", BIS Working Papers, no 380, June.
Drehmann, M and M Juselius (2014): "Evaluating early warning indicators of banking crises: satisfying policy requirements", International Journal of Forecasting, vol 30(3), pp 759-80.
Ehlers, T and F Packer (2013): "FX derivatives markets in emerging economies and the internationalisation of their currencies", BIS Quarterly Review, pp 55-67, December.
Eickmeier, S, L Gambacorta and B Hofmann (2013): "Understanding global liquidity", BIS Working Papers, no 402, February.
Fender, I and P McGuire (2010): "Bank structure, funding risk and the transmission of shocks across countries: concepts and measurement", BIS Quarterly Review, September, pp 63-79.
Financial Stability Board (2015): Ninth progress report on implementation of OTC derivatives market reforms, 24 July.
Gruić, B and P Wooldridge (2012): "Enhancements to the BIS debt securities statistics", BIS Quarterly Review, December, pp 63-76.
--- (2015): "BIS debt securities statistics: a comparison of nationality data with external debt statistics", IFC Bulletin, no 39, April.
International Monetary Fund and Financial Stability Board (2009): The financial crisis and information gaps - report to the G-20 Finance Ministers and Central Bank Governors.
--- (2015): The financial crisis and information gaps: sixth progress report on the implementation of the G-20 Data Gaps Initiative, September.
Juselius, M and M Drehmann (2015): "Leverage dynamics and the real burden of debt", BIS Working Papers, no 501, May.
Klau, M and S Fung (2006): "The new BIS effective exchange rate indices", BIS Quarterly Review, March, pp 51-65.
Kreicher, L, R McCauley and P Wooldridge (2014): "Benchmark tipping in the global bond market", BIS Working Papers, no 466, October.
McCauley, R, C Upper and A Villar (2013): "Emerging market debt securities issuance in offshore centres", BIS Quarterly Review, September, pp 22-3.
McGuire, P and N Tarashev (2008): "Global monitoring with the BIS international banking statistics", BIS Working Papers, no 244, February.
McGuire, P and G von Peter (2012): "The US dollar shortage in global banking and the international policy response", International Finance, vol 15(2).
Scatigna, M, R Szemere and K Tsatsaronis (2014): "Residential property price statistics across the globe", BIS Quarterly Review, September, pp 61-76.
Shin, H S (2012): "Global banking glut and loan risk premium", Mundell-Fleming Lecture at the 2011 IMF Annual Research Conference, IMF Economic Review, vol 60, pp 155-92.
Shin, H S (2013): "The second phase of global liquidity and its impact on emerging economies", keynote address at Federal Reserve Bank of San Francisco Asia Economic Policy Conference, November.
Turner, P and J Van 't dack (1993): "Measuring international price and cost competitiveness", BIS Economic Papers, no 39, November.
von Peter, G (2007): "International banking centres: a network perspective", BIS Quarterly Review, December, pp 33- 45.
1 This article was prepared by the BIS Monetary and Economic Department. Questions about the article may be addressed to Christian Dembiermont (christian.dembiermont@bis.org) and Philip Wooldridge (philip.wooldridge@bis.org). Queries about BIS statistics may be addressed to statistics@bis.org.
2 Data behind all graphs published in the BIS Quarterly Review are available on the BIS website, from the right-hand panel of the BIS Quarterly Review homepage.
3 The BIS Statistical Bulletin is published quarterly at the same time as the BIS Quarterly Review. Data may have been revised or updated subsequent to the publication of the latest Bulletin. The latest data are available from the BIS website (www.bis.org/statistics/index.htm). A release calendar provides advance notice of data updates (www.bis.org/statistics/relcal.htm).
4 The IAG comprises the BIS, the ECB, Eurostat, the IMF, the OECD, the United Nations and the World Bank. For more information about the G20 Data Gaps Initiative, see IMF-FSB (2009, 2015).
5 Adjusted changes may over- or underestimate underlying flows because adjusted changes may also be affected by changes in valuations, writedowns, the underreporting of breaks, and differences between the exchange rate on the transaction date and the quarterly average exchange rate used by the BIS to convert non-dollar amounts into US dollars.
6 This complicates analysis of flows using the CBS: for instance, a depreciation of a given currency against the US dollar will result in a decline in the reported US dollar value of outstanding claims denominated in that currency (and an appreciation an increase in the reported value).
7 Foreign claims are the sum of cross-border and local claims, excluding claims on residents of the country where the bank is headquartered. In the CBS on an immediate counterparty basis, foreign claims are disaggregated into local claims denominated in local currencies and international claims, where international claims refer to cross-border claims plus local claims in foreign currencies.
8 Prior to 1999, the XTD statistics were compiled from data from the Futures Industry Association and selected derivatives exchanges. Since 1999, the main source has been FOW TRADEDATA.
9 In addition to the three components of core debt identified here, debt instruments comprise: special drawing rights (SDR); insurance, pension and standardised guarantee schemes; and other accounts receivable/payable (2008 SNA, #26.103). These three additional types of financial liability should therefore be included in any comprehensive picture of government debt, but they are not homogeneously measured across countries. The BIS core debt data perform much better in terms of international comparability.