Residential property price statistics across the globe
Despite their importance in macroeconomic and financial stability analysis, residential property data are not easily available on a comparable basis. The BIS currently publishes more than 300 price series for 55 countries, among which it has selected one representative series for each country. For 18 countries, it also publishes series that span the period back to the early 1970s. House prices can serve as key indicators of financial stability risks, as property booms are often the source of vulnerabilities that lead to systemic crises.1
JEL classification: R30, R31.
Since June 2014, the BIS has published three data sets of residential property prices that currently cover 55 countries. The unique feature of the first data set, besides its wide coverage, is that it contains several series per country, focusing on different segments of the national market. The other two data sets contain one representative series per country, selected by BIS statisticians to enhance cross-country comparability. The second set focuses on broad coverage of the selected series, while the unique feature of the third data set is that it creates long time series for a subset of countries. In this article, we present these data and highlight their usefulness.
Households, analysts and policymakers share a keen interest in property price developments. Buying a house is often the largest single transaction for a household, and the property its largest asset. It is no surprise that house prices are a frequent topic in dinner party conversations. Fluctuations in house prices have a large impact on households' net wealth, and their propensity to spend. In addition, residential property values underpin much of the USD 24 trillion mortgage market in advanced economies.2 This makes house markets a central element in the analysis of trends in aggregate expenditure, the strength of bank balance sheets and the interactions of macroeconomic and financial stability. Moreover, house prices are relevant to statisticians who compile macroeconomic series on households' wealth, or consumer price indices.
Despite their importance, comparable cross-country data on residential property prices are hard to obtain. The combination of the disaggregated nature of property transactions and the pronounced diversity of the properties themselves complicates the compilation of price indices. Moreover, comparability suffers because of a lack of standardisation and the short time span of many series, a significant shortcoming in view of the length of property price cycles. The data sets published by the BIS are aimed at narrowing these gaps. Their unique features in terms of coverage and comparability should be of use to economists and policymakers alike.
The article is organised in three sections. The first section discusses various statistical aspects related to the construction of price indices. The second section provides an overview of the data published by the BIS. The final section uses the three data sets to illustrate the use of their unique features. It presents a quick overview of international market developments, provides cross-country comparisons of current valuations and highlights the international co-movement of prices. Finally, it also documents the early warning properties of house price growth for episodes of systemic banking stress.
Diversity in the characteristics of house price statistics
One of the main objectives of the residential price series published by the BIS is to provide analysts and researchers with information about house price growth in various countries. Cross-country analysis places a premium on data comparability, and from that perspective property price indices present a number of statistical challenges. In this section, we outline the main factors that can differentiate one house price index from the other.
Property price indices aim to capture the trend in the average price of dwellings in a given area. However, the nature of the property market complicates standardisation in index construction. For one, housing is not a homogeneous good. Properties vary immensely in several dimensions, some of which are not easy to quantify. While segmentation of the market in terms of location, size or age of the property may be straightforward, controlling for quality of construction, customer appeal or level of comfort is less obvious. In addition, property changes hands through bilateral transactions and not in centralised markets.3 This requires mechanisms to collect dispersed price information in order to create a representative index, as indices with different characteristics provide different messages even for the same country (see box). These practical difficulties also explain why in many cases statistics have been gathered (at least initially) by private sector firms and associations with specific commercial interest in the housing market while public sector efforts have lagged behind. This pattern is even more pronounced in the case of commercial property, where heterogeneity and dispersion of transactions are even greater and where hardly any official statistics exist.4
Property price indicators differ in three principal dimensions: their geographical coverage, the source of information on property values, and the approach to controlling for differences in property characteristics.
The old adage "Location, location, location!" points to the key driver of real estate value. Prices of properties in different locations can diverge persistently even within the same region. Demographics, tastes and demand from foreign buyers may be pushing up the price of houses in highly desirable spots at the same time as properties in other areas are languishing due to lack of demand or a decline in local economic activity. During the 2007-09 crisis, properties in Manhattan and central London maintained their value while in the rest of the United States and the United Kingdom average home values were plummeting. Aggregate price indices that are skewed towards one or the other segment may convey a distorted picture of average developments. That said, for some purposes it is useful to focus on market segments. For instance, given the wider economic disruptions created when a large stock of outstanding debt defaults, the assessment of the macro-financial risks of rapid growth in mortgage credit would naturally focus on the booming segment of the housing market. This is particularly true for very diverse countries such as the United States, and often coincides with properties in major cities. In practice, the majority of the published series refer to country-wide averages, but for about 13 countries the data cover only prices in major cities or the capital alone (Table 1, left-hand set of columns).
Indices differ also in terms of the primary source of price information (Table 1, middle set of columns). The ideal source would be actual transaction prices for a representative set of properties. Comprehensive sets of transaction prices can be collected from land registries, where these exist. However, widespread tax avoidance in some countries can introduce bias in recorded transaction prices compared with real market property values. Moreover, depending on the available resources, registries may keep only incomplete records of the characteristics of dwellings, hence complicating the quality adjustment of price indicators. Similar factors explain the time lag between the publication of official indicators and less comprehensive indicators compiled from private sources.5
Tools that facilitate the workings of the real estate and mortgage markets may also be a source of house price information, as are advertised prices, collected from the internet, newspapers or the databases of real estate agents. Advertised prices may capture trend shifts even before transactions take place. However, their usability is limited by systematic differences vis-à-vis actual transaction prices (for example, owners listing a high asking price or failing to sell the property), which may also be time-varying (for instance, close to turning points in demand or supply cycles). Alternatively, in countries with developed mortgage markets, yet another source of information is appraisals made as part of the loan approval process. Experts' valuations are likely to be closer to final transaction prices than advertised prices but may also be subject to biases if they are primarily driven by lenders' desire to ensure adequate cover for their exposure.
The data source or the purpose of the indicator also influences its coverage. For example, appraisal-based indicators usually do not incorporate price data from cash purchases; and owner-occupied property price indices measure only developments in the prices of dwellings owned by the households that live in them. They exclude sales of properties purchased with the intention to let or resell, a potentially important share of the market in countries with low home ownership rates (eg Germany) or in periods of intense speculation in residential property.

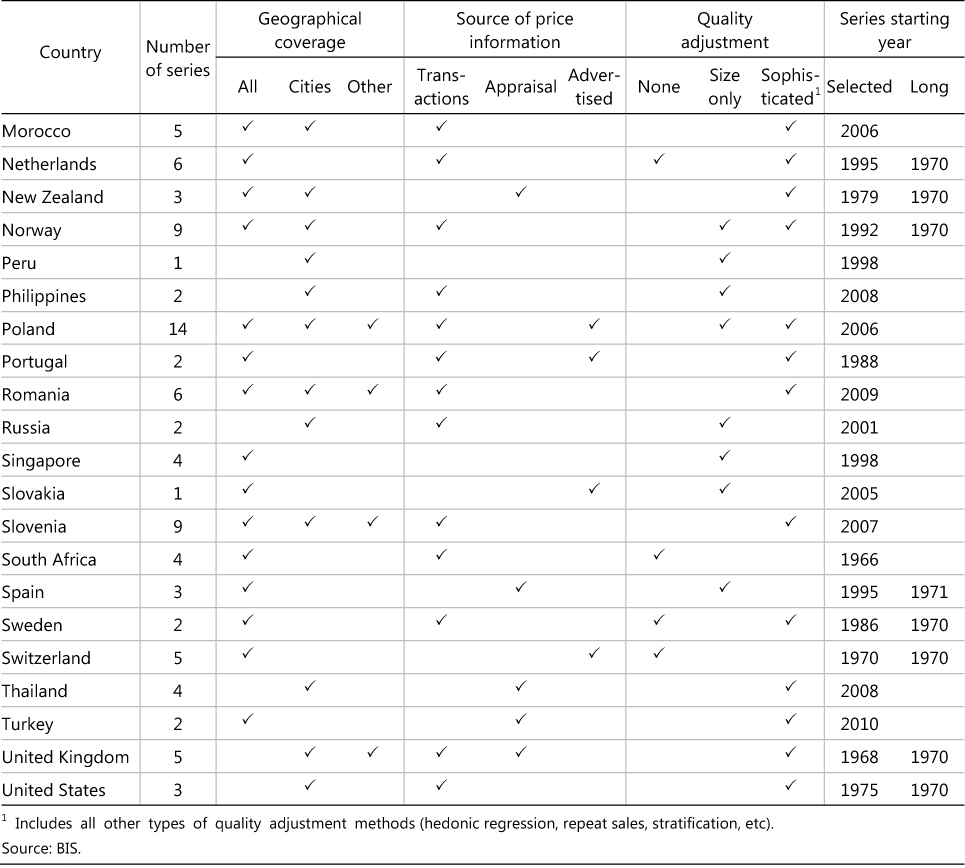
Finally, a price index must separate price movements from changes in the characteristics of the underlying properties. Index compilers have adopted methods of varying sophistication to perform this quality adjustment (Table 1, right-hand set of columns). The quality adjustment process is more challenging in the case of property price indices than for consumer or producer price indices, and the choice is partly driven by data availability. The most basic approach uses the average house price in a given area. This is the only possibility when the main characteristics of the dwellings are not collected, or cannot be processed by the compiler. It can produce misleading messages if the distribution of characteristics in the cross section of properties surveyed varies over time. Indicators based on price per square metre are calculated when only the size is available. More elaborate quality adjustments take into account other characteristics and follow methods such as hedonic regression, stratification, and repeated sales or appraisals.6 Some of these methodologies are better at adjusting for general trends in quality over time (eg hedonic regressions or indices based on repeat sales), while others are more geared towards controlling for cross-sectional differences in quality at a given point in time (eg stratification or the ratio of sales price to appraisal value).
The demand for comparable price statistics led to Eurostat's publication of the Handbook on Residential Property Prices Indices (HRPP) last year. The HRPP gathers recommendations on best practices for the compilation of property price indices in the context of different user needs. The HRPP built on work undertaken by a number of international organisations (including the BIS) to identify the user requirements from the point of view of economic and policy analysis.
The implementation of HRPP recommendations runs into constraints related to the availability of data and resources. Generally, public sector compilers are more likely to follow its recommendations than their private sector counterparts. Residential property price indices based on the recommendations of the handbook have been constructed in many European countries, but progress is slower elsewhere.
The BIS property price statistics
In 2009, the G20 asked the BIS and its member central banks to collect and publish residential property prices. The request was made in the context of the Data Gaps Initiative, which aims to improve the availability and comparability of economic and financial data across countries, and follows long-standing efforts by the BIS to collect and use cross-country data on property prices.
The BIS work on cross-country house price data dates back to the late 1980s (BIS (1989)). An expanding set of price series have been collected from various national sources (both public and private) and cover both residential and commercial properties. The information has been extensively used in analysis and reported in publications, such as several editions of the BIS Annual Report. BIS analysis has focused on the determinants of property prices (Tsatsaronis and Zhu (2004), Égert and Mihaljek (2007), Glindro et al (2010), Takáts (2012)) and the link between property prices and credit (Davis and Zhu (2005)) as well as the information content of real estate prices for financial stability (Borio and Drehmann (2009)). Borio et al (1994) constructed an indicator of aggregate asset prices combining equity and property prices, and explored its link with money, credit, interest rates, output and inflation.
The residential property price series that are published by the BIS are organised in three data sets: the Detailed data set that includes all the original series collected for each country, the Selected series data set that includes one representative price series per country, and the Long series data set that presents a price series with a long time span which also satisfies some minimum comparability criteria across countries. These three data sets are discussed in more detail below. Table 1 provides a succinct overview of the range of series in the three data sets for each country.
The Detailed data set: several series per country
The BIS started to publish monthly residential property prices in July 2010. The coverage of these statistics has expanded from an initial set of 37 countries to 55 today, including 18 G20 countries and all 28 EU members. The total number of series published currently exceeds 300, as, for several countries, more than one series is available. Irrespective of the original compiler, all residential property price series are reported to the BIS by central banks, which also monitor their quality.
The series published on the BIS website differ from country to country in terms of type of property, area covered, property age, priced unit, compilation method and seasonal adjustment. For many countries, residential property price indices cover the entire market, encompassing all types of dwelling throughout the country concerned in both new and existing dwelling markets. For other countries, the coverage of the compiled series is more limited, either in terms of types of dwelling, from a geographical perspective, or regarding the market. In general, the BIS has made an effort to collect price indices that have been compiled following the HRPP recommendations, and publishes extensive descriptive information regarding source, coverage and compilation method alongside each series.
The Selected series data set: one series per country
Faced with multiple series for a country, an analyst must often confront the issue of representativeness. The Selected Representative series data set, published by the BIS, provides a possible answer by including only one house price indicator per country.
As far as possible, the selected series cover all types of dwelling (flats and houses, new and existing) throughout the country. Indicators with such a broad coverage help assess aggregate household wealth and are thus useful for the analysis of financial vulnerabilities linked to household indebtedness.7 In addition, such a broad indicator can be the best to use for international comparisons, and for this reason the selection also took into account the HRPP criteria.8 The resulting Selected series data set is as homogeneous as feasible without, however, fully eliminating all discrepancies.
To assist analysts who are interested in ready-to-use comparable price series, these selected series are of a quarterly frequency and are updated once in each quarter.9 They are rebased, deflated by the CPI, and presented as both levels and year-on-year growth rates.10
Diversity of residential property price statistics: the German case
The Detailed data set (see main text) includes 48 indicators for Germany covering different segments of the market and following different methodologies. The four most representative series are all reported at least quarterly and are quality-adjusted, but differ in many other aspects (Table A). Two indices are compiled by the private sector and the other two by public sector agencies. More importantly, the indicators vary in their regional coverage, refer to different types of property, use different approaches for the quality adjustment and have different starting dates as well as reporting lags.
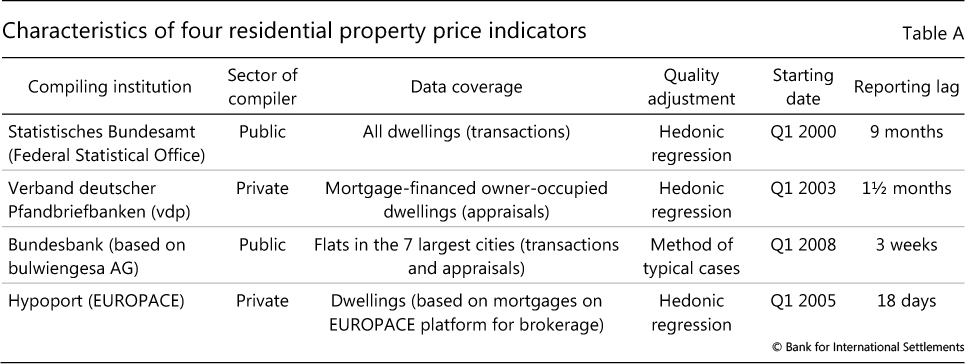
The official indicator compiled by the Federal Statistical Office covers most of the housing market, but it is only available with a long reporting delay. Analysts interested in the most recent developments might prefer the Verband deutscher Pfandbriefbanken (vdp) indicator. The Hypoport (EUROPACE) indicator is even more timely but covers just 15% of overall transactions, and even though it has a monthly frequency, the data represent moving quarterly averages. The Bundesbank indicator, based on data from bulwiengesa AG, is the only one focusing solely on urban properties. The Bundesbank compiles an indicator that covers the entire country (not listed in the table) that is available only at an annual frequency.
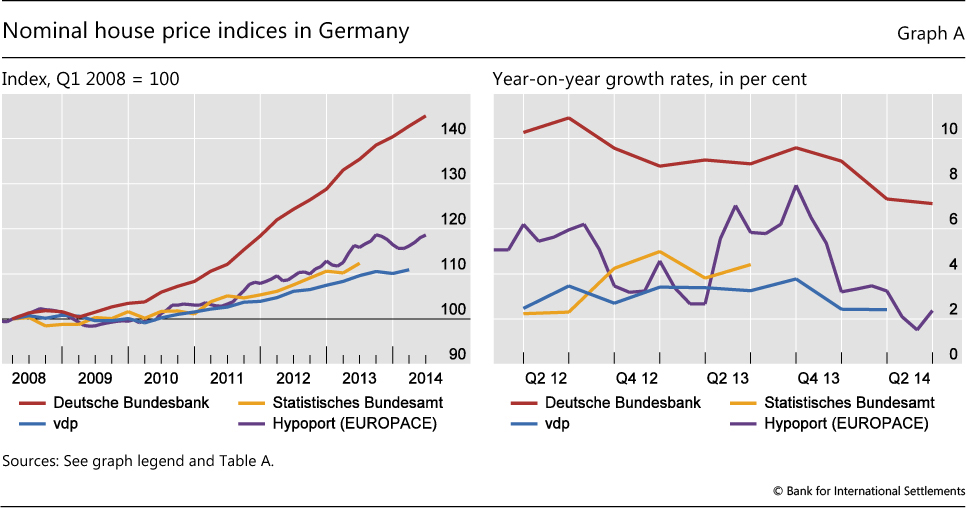
The four price indicators convey somewhat different messages both about longer-term trends and about shorter-term developments. Graph A plots the recent history of the four indicators. Looking at longer-term trends (Graph A, left-hand panel), the three country-wide indicators convey a similar picture, placing the cumulative growth rate since the beginning of 2008 in the range of 11% (vdp) to 16% (Hypoport). However, only the Bundesbank indicator shows the pronounced price increase registered for flats in major cities, where prices have climbed by a cumulative 45% since 2008. The picture is even more mixed in quarter-to-quarter movements (Graph A, right-hand panel). House price growth estimates calculated on the basis of the Bundesbank and vdp indices differ substantially, but they are both much less volatile than that based on the Hypoport series, arguably reflecting the shifting sample of the properties listed on the online brokerage that supplies the price information. The graph also illustrates the reporting lag of the Federal Statistical Office indicator.
The BIS has chosen the vdp index for inclusion in the Selected data set (see main text) because of its broad coverage of properties and its short reporting lag.
The Long data set series (see main text) for Germany also uses the vdp index for the period starting in 2003. Prior to that date, the long series is constructed on the basis of price indices referring to properties in western Germany. Going backwards in time, the long series uses the historical time series of the Bundesbank on western German dwelling prices for the period 1975-2002 and sales price data in four cities from a private sector source (Ring Deutscher Makler) for the period 1972-74. For the first two years (1970-71) and in the absence of house price data, the series uses construction cost data as a proxy indicator. For the years where only annual data were available (ie prior to 2003), the quarterly series was constructed using the Chow-Lin (Chow and Lin (1971)) interpolation procedure based on the quarterly pattern of the construction cost index.
Long series data set: stretching the time dimension
Many questions can only be answered by analysing long time series of property prices.11 The BIS also publishes a Long series data set on residential property prices, which extends the Selected series for 18 advanced economies with historical data that go as far back as 1970 or 1971 on a quarterly basis.
This work has been driven by the BIS in close coordination with national authorities, based on existing data. These data originate from various sources such as central banks, national statistics offices, research institutes, private companies and academic studies. They rely on different methodologies and can cover heterogeneous types of geographical area and types of dwelling. The resulting long series for each country start from the series in the selected data set, extended backwards with information from alternative sources, using standard statistical techniques to fill any gaps.12
Ongoing improvements
The three data sets continue to expand in three ways. The first goal is to keep increasing the number of countries included in the data sets, for instance by adding price series for the remaining two G20 countries (Argentina and Saudi Arabia).
The second goal is to broaden the collection of quality-adjusted price indices that cover the whole residential property market (all types of dwelling and all locations in a given country). For the moment, such series are available for about two thirds of the 55 countries in the data set (Table 1).
The third goal is to enrich the coverage of the long series data set by adding more countries with price series that meet the comparability standards, and by extending the existing series back in time, whenever this is possible.
House prices as input to economic analysis
This section highlights the usefulness of the three BIS residential property price data sets for different types of analysis that relies on comparisons across countries and time. These range from obtaining an overview of recent price developments and trends to the identification of common drivers in price dynamics and stylised facts in their relationship with macroeconomic and financial stability.
House price trends internationally
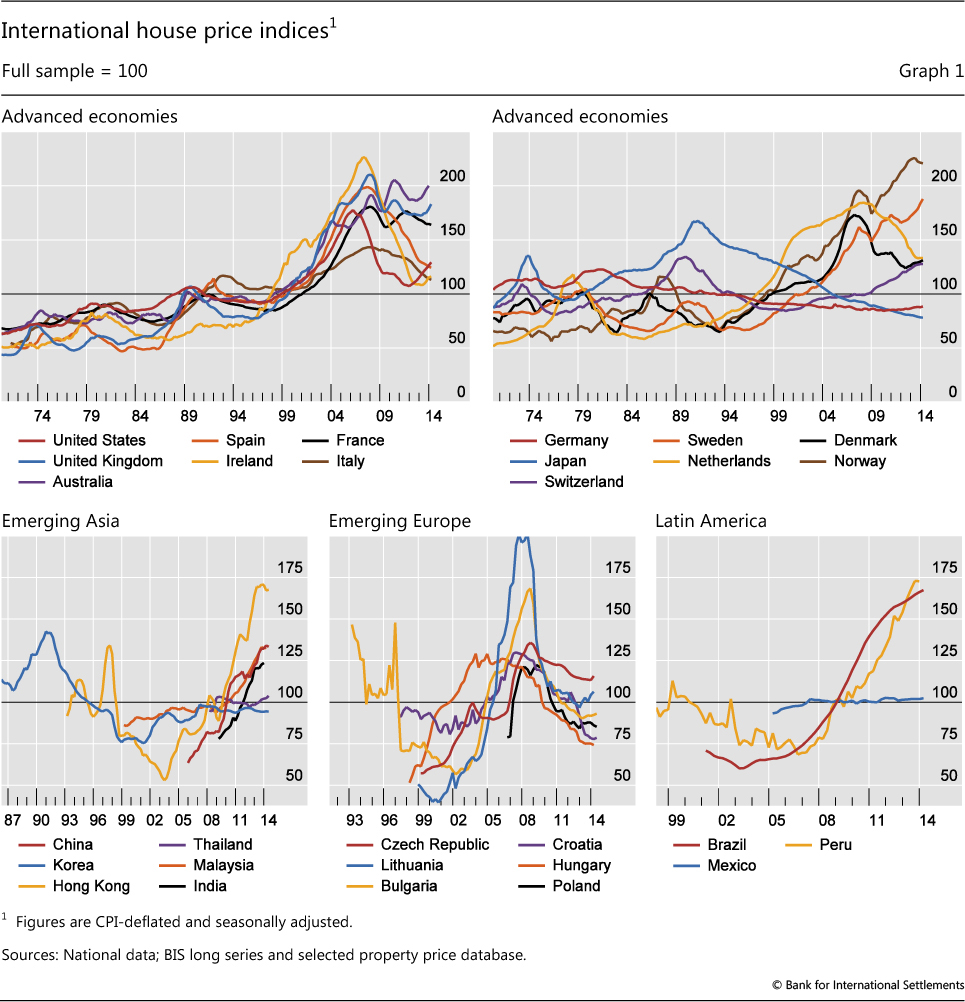
Lately, house price developments have displayed greater diversity across countries than they did in the immediate aftermath of the crisis. Analysis of the selected price series shows that in some advanced economies, over the past year, real house prices halted their decline and even staged a recovery while in others they continued their downward trend. In contrast, in most emerging market economies outside Europe, house prices generally rose (Graph 1).
Year-on-year residential property prices, deflated by CPI, rose by 9.5% in the United States and 6% in the United Kingdom. Real house prices also grew, by 7% in Canada, 7.7% in Australia and 2.2% in Switzerland, three countries that were less affected by the crisis, as well as in some countries that were severely affected by the crisis, such as Ireland (+7.2%) and Iceland (+6.4%).
Real price growth remained in negative territory in Japan (-2.6%) and was generally weak or negative in continental Europe. Prices rose in Germany (+1.2%) and the Nordic countries (+1.7% in Denmark and +4.8% in Sweden), but continued to fall in the euro area's southern periphery (Italy, -5%; Spain, -3.8%; Portugal, -1.2%; and Greece, -6%).
House prices generally grew in emerging regions outside Europe. In Asia, year-on-year growth rates remained high in a number of countries in the first quarter of 2014 - for instance, prices increased in real terms in China (+13%), the Philippines (+13%) and Malaysia (+5%). In Latin American countries, the increase in real residential property prices was more moderate. Prices in Brazil increased by 3.9% in the first quarter of 2014, whereas in Mexico real prices were mostly stable compared with one year ago. Price developments were mostly negative among central and eastern European countries, but prices in the Baltic countries rebounded sharply.
Sustainability of house prices: valuation benchmarks
Are current house prices sustainable? Property valuations are a subject of intense debate given the inherent subjectivity of the assessment and the volatility in the demand trends. Comparisons of recent developments across countries and benchmarking against historical valuation guides can provide additional insights with which to assess the sustainability of recent house valuations. Two such valuation guides widely used among economists and practitioners are the ratio of rental income to the purchase price of the property (the housing asset equivalent to the dividend ratio for stocks) and the ratio of house prices to household income (a metric of affordability).
Graph 2 juxtaposes recent house price growth rates with the deviation of current valuation ratios from their longer-term average values for the countries in the database with sufficiently long series.13 The horizontal axis in both panels measures the three-year growth rate of residential property prices for each country on the basis of the selected price series. The graph clearly shows the very different recent experience across countries, with declines of more than one quarter in some countries and price hikes in excess of one third in others. Are these movements indicative of market corrections or, instead, of shocks that suggest overshooting in one direction or the other?
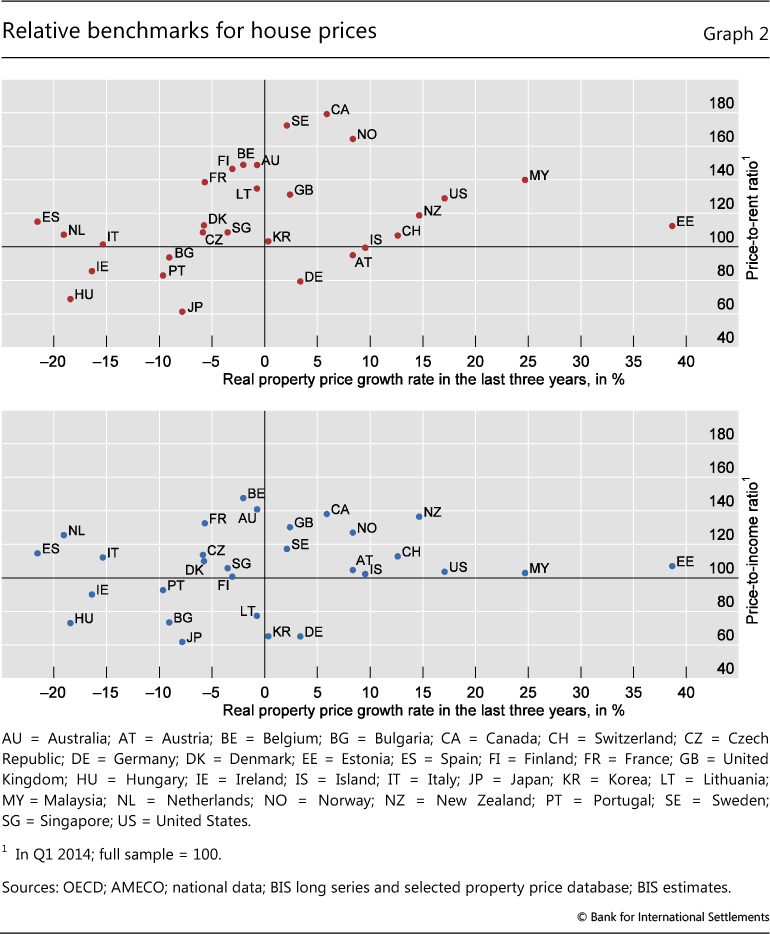
The vertical axis in the top panel shows the most recent value of the ratio of house prices to rents, rebased using its historical average. A value of 110 indicates that the current ratio is 10% higher than the historical average. Countries are quite dispersed with respect to this benchmark. While for most countries the current ratio implies that price movements are not diverging from rental values in ways that imply unsustainability, for a number of other countries current property prices are much higher than those implied by the historical relationship to rents. A priori, this could be a reason to expect a price correction in the future. Interestingly, some of these countries have experienced only moderate price growth recently (eg Canada, Norway and Sweden), or even price declines (eg Australia, Belgium and France).
The vertical axis in the bottom panel shows the most recent value of the affordability benchmark: the ratio of prices to disposable income per capita, also rebased using its historical average. The graph suggests that for most countries the current ratio is not too far from this benchmark, suggesting that prices have not diverged dramatically from income trends. For a number of countries, however, current property prices are at least one fifth higher than those implied by the historical relationship to incomes, suggesting potential downward pressures on real house prices. This might lead to a reversal or moderation of recent growth (eg in Canada) or a further sliding of prices (eg in Belgium and France). This argument would be more compelling for markets where prices have grown rapidly in the recent past, and where income growth is projected to be rather moderate.
House price cycles and international co-movement
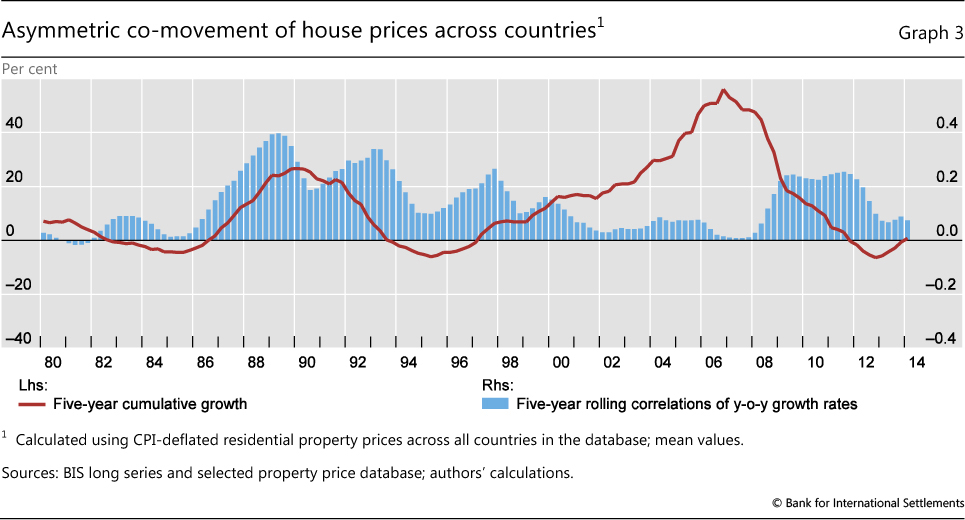
Long time series are also useful for understanding the dynamics of house prices. Research has pointed to long cycles in property prices that are associated with similar cycles in the availability of credit (Drehmann et al (2012)). Graph 3 shows the average growth rate of real house prices across all countries in the Selected and Long series databases over five-year rolling time windows (red line). The series shows the remarkable regularity of a global cycle with length in excess of 10 years and of increasing amplitude over time.
Interestingly, the intensity of house price co-movement varies over time (blue bars). It was generally high for the years between the mid-1980s and late 1990s, whereas it declined markedly during the boom years of the first decade of this century, only to increase again in the aftermath of the global financial crisis. Closer inspection suggests that while most of the time the intensity of co-movement mirrors the direction of average real property prices, there are periods when the two move in opposite directions (1989-93, 1997-99, 2000-08).
House prices as early warning indicators for financial instability
How can property prices contribute to financial stability analysis? Work at the BIS has pointed to the early warning indicator properties of real estate prices. Leverage-fuelled housing booms that turn into busts have so often been at the very heart of episodes of systemic distress. Historical experience has demonstrated that the interactions between rapidly growing house prices and excessive credit expansion are a tell-tale sign of the build-up of vulnerabilities in the household sector and the source of future losses for banks (Borio and Drehmann (2009)).
We follow Drehmann and Juselius (2014) to illustrate the statistical relationship between residential price booms and systemic banking crises in the form of the AUC statistic.14 In short, the AUC measures the success rate of a particular indicator in correctly predicting future occurrences (in this case, a systemic crisis) while at the same time minimising false positive signals (ie flagging a potential crisis without one occurring). The closer to unity the value of the AUC for a given indicator at a specific horizon, the more informative the indicator.
The left-hand panel of Graph 4 shows the AUC metric for real property price growth over forecast horizons that range from 20 quarters to one quarter prior to a banking crisis.15 The AUC for the house price indicator is clearly above 0.5, the threshold for being informative (see footnote 14), for several years prior to the crisis. However, the quality of its signal drops significantly in the five quarters prior to the crisis date. This is because property price declines are in many instances a hallmark of the early stages of a financial bust. However, up to that point the signal they emit is quite stable.
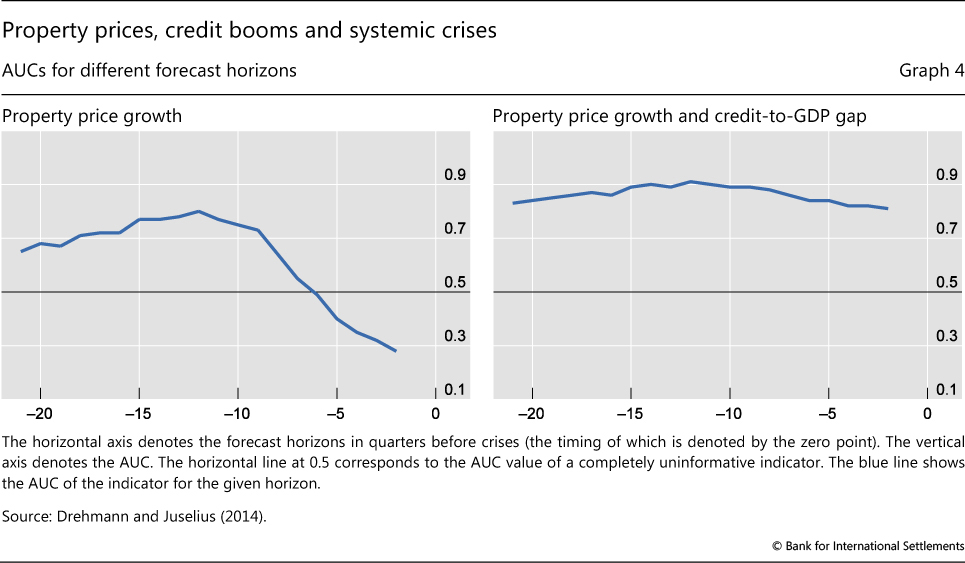
The performance of property prices dramatically improves when their signals are combined with those of other early warning indicators, and in particular indicators more directly linked to the behaviour of credit. The right-hand panel of Graph 4 shows the AUC of a signal combining real property growth and the credit-to-GDP gap, defined as the difference of the credit-to-GDP ratio from its historical trend.16 The AUC of the combined indicator is much higher than that of real property price growth, and most importantly it stays high throughout the forecast horizon up to the crisis date.
Conclusions
House prices are important inputs to conjunctural analysis of macroeconomic and financial stability risks as well as to research into the interactions of the real and financial sectors. The three sets of residential price data published by the BIS should provide analysts of international housing markets with a wealth of easily accessible and comparable data on price developments. This should stimulate further analysis, including in the form of cross-country benchmarking of valuations and the commonalities in house price dynamics. In addition, the availability of price series with long time spans should stimulate research on property price cycles and interactions with other macroeconomic and financial variables.
The BIS residential price series could potentially also act as a catalyst in improving the availability of property price statistics. For one, it may stimulate efforts towards greater standardisation of the statistical processes underpinning the national compilation of these data. Importantly, this could possibly extend to the compilation of comparable price indices for commercial property prices. Recalling that exposure to frothy commercial real estate markets was at the root of many an episode of banking system stress, this would greatly enhance our analytical tools. Data on commercial property markets are very patchy and hard to come by, at the national level and especially across countries.
References
Bank for International Settlements (1989): 59rd Annual Report, June.
Borio, C and M Drehmann (2009): "Assessing the risk of banking crises - revisited", BIS Quarterly Review, March, pp 29-46.
Borio, C, N Kennedy and S Prowse (1994): "Exploring aggregate asset price fluctuations across countries: measurement, determinants and monetary policy implications", BIS Economic Papers, no 40, April.
Chow, G and A Lin (1971): "Best linear unbiased interpolation, distribution and extrapolation of time series by related series", The Review of Economics and Statistics, vol 53, no 4, November, pp 372-5.
Davis, E and H Zhu (2005): "Commercial property prices and bank performance", BIS Working Papers, no 175, April.
Drehmann, M, C Borio and K Tsatsaronis (2012): "Characterising the financial cycle: don't lose sight of the medium term!", BIS Working Papers, no 380, June.
Drehmann, M and M Juselius (2014): "Evaluating early warning indicators of banking crises: satisfying policy requirements", International Journal of Forecasting, forthcoming (also available as BIS Working Paper no 421, August 2013).
Drehmann, M and K Tsatsaronis (2014): "Countercyclical capital buffers and the credit-to-GDP gap: questions and answers", BIS Quarterly Review, March, pp 55-73.
Égert, B and D Mihaljek (2007): "Determinants of house prices in central and eastern Europe", BIS Working Papers, no 236, September.
Eurostat (2013): "Handbook on Residential Property Prices Indices (RPPIs)", Methodologies and Working papers, available at http://epp.eurostat.ec.europa.eu/portal/page/portal/hicp/methodology/hps/rppi_handbook.
Glindro, E, T Subhanij, J Szeto and H Zhu (2010): "Determinants of house prices in nine Asia-Pacific economies", BIS Papers, no 52, July.
Takáts, E (2012): "Aging and house prices", Journal of Housing Economics, vol 21, no 2, June, pp 131-41.
Tsatsaronis, K and H Zhu (2004): "What drives housing price dynamics: cross country evidence", BIS Quarterly Review, March, pp 65-78.
1 The views expressed in this article are those of the authors and do not necessarily reflect those of the BIS. We wish to thank Claudio Borio, Dietrich Domanski, Hyun Song Shin and Christian Upper for constructive comments on earlier drafts.
2 Estimated as the sum of outstanding mortgages in Australia, Canada, the euro area, Japan, the United Kingdom and the United States in the first quarter of 2014.
3 Central property registries can function as surrogate centralised marketplaces for the purpose of compiling price indices. Unfortunately, these registries are not always organised in a way that makes it easy to extract useful information on price and property characteristics.
4 BIS researchers have used commercial property price indices, mostly sourced from proprietary commercial compilers, for research and analysis, including for various editions of the BIS Annual Report.
5 For more details, see Eurostat (2013), Chapter 9.
6 See Eurostat (2013), Chapters 4-7.
7 This is, of course, subject to the caveat raised earlier about diverging trends in major segments of the property market.
8 International comparisons of less aggregated data (for example, based on cities or specific types of dwelling) are complicated because of the diversity in the definition of these segments as well as the unavailability of the relevant series in many countries. Moreover, the importance of each segment varies considerably across countries.
9 The series in the Detailed data set are presented at the same frequency as originally published by the compiler.
10 A note on residential property price developments accompanies the quarterly publication, analysing the recent evolutions of these indicators.
11 See eg Borio et al (1994) and Drehmann et al (2012).
12 The documentation accompanying the long series data set provides a full explanation of the sources and methodologies used (http://www.bis.org/statistics/pp_long_documentation.pdf). For instance, in order to interpolate annual values and construct quarterly series, the Chow-Lin procedure (Chow and Lin (1971)) was used with construction costs or the housing component of the CPI as reference series (or a combination of the two).
13 We require that we have at least 15 years of data for both ratios. The choice is somewhat arbitrary, but consistent with the observation that credit and property cycles are of average duration in excess of 15 years (Drehmann et al (2012)). We use the Selected series for all countries and, where available, the long series to calculate the historical average of the ratio in each panel.
14 The area under the curve (AUC) captures the trade-off between true positives and false positives for the full range of policymaker preferences (see Box A in Drehmann and Tsatsaronis (2014) for a description). A completely uninformative indicator has an AUC of 0.5: it is no better than tossing a coin. The greater the difference of the AUC from 0.5, the better the indicator balances the trade-off between missed crises and false positives. The perfect indicator has an AUC of 1 or zero, depending when higher or lower values of the indicator predict crises.
15 The analysis is based on approximately 50 crisis episodes (see Drehmann and Juselius (2014) for details).
16 The indicators are combined by considering that a signal has been emitted if either of the two is signalling (Drehmann and Juselius (2014)).