FX and derivatives markets in emerging economies and the internationalisation of their currencies
Derivatives markets in emerging economies have continued to grow since 2010, driven mostly by very strong growth in the OTC market. Emerging market currencies have become more international as offshore markets are a major contributor to FX turnover. The Chinese renminbi is actively traded within emerging Asia. Trading of emerging market currencies is positively related to the size of cross-border financial flows.1
JEL classification: F31, G15, G20, P45.
Over the past decade, FX and derivatives markets in emerging market economies (EMEs) have grown rapidly. In previous work, Milhaljek and Packer (2010) noted that EME derivatives were strongly outgrowing those of advanced economies, as well as becoming increasingly international. Has this trend continued? In EMEs, which derivatives are now traded, and who trades them? Which EME currencies are now most traded, and where are they traded? Have some EME currencies become regional lead currencies? Is there a relationship between turnover in EME currencies and cross-border financial flows into and out of emerging markets?
Our main findings are as follows. First, average daily turnover in EME derivatives has continued to grow since 2010, driven mainly by very strong growth in the over-the-counter (OTC) segment. Second, growth of FX derivatives turnover has been strongest with "other financial institutions", which include official sector financial institutions. Third, offshore trading of EME currencies has surged, far outpacing the growth in total FX turnover in EME currencies. Among the currencies with the highest turnover growth are the Chinese renminbi, Mexican peso, Turkish lira and Russian rouble. Fourth, the Chinese renminbi is playing an increasingly prominent role in emerging Asia, although the regional significance of other EME currencies is much more limited. Fifth, the trading of EME currencies is positively related to the size of cross-border financial flows.
The remainder of this article is organised as follows. The first section looks at the overall trends in derivatives trading in EME jurisdictions, both over-the-counter and on exchanges. In the second section, we shift our focus to EME currency trading, which goes well beyond the shores of the home economies. The third section analyses the link between financial flows and FX turnover in EME currencies. The final section concludes.
The size and structure of derivatives markets in EMEs
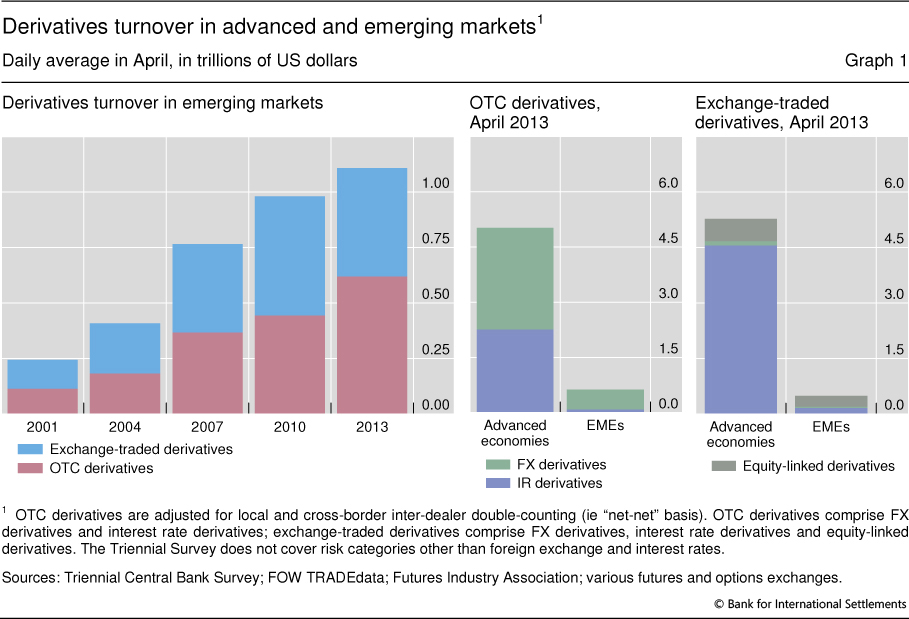
Derivatives markets in EMEs remain small compared with those in advanced economies. Across the 32 EMEs for which data are available, average daily turnover in EME jurisdictions calculated on a "net-net" basis (ie correcting for both local and cross-border inter-dealer double-counting) was $1.1 trillion in April 2013, which is around 4% of those countries' GDP, compared with $10.3 trillion in advanced economies, or 24% of GDP (Graph 1).
The overall pace of growth exceeds that of advanced economies, although it remains rather modest at 13%. As discussed below, this reflects declining trading on EME exchanges; growth in OTC transactions has been strong. Another caveat to keep in mind is that trading in emerging market jurisdictions accounts for only a part of trading in EME derivatives owing to active offshore trading.
Derivatives turnover in EME jurisdictions tends to be more concentrated in the exchange rate segment. FX derivatives account for just over half of total daily turnover, and equity and interest rate instruments for around one fifth each. By contrast, derivatives in advanced economies are used for the most part to trade interest rate risk (around 66% of overall turnover) with FX and equity market derivatives turnover accounting for only 28% and 6%, respectively. The smaller role of interest rate derivatives in EMEs likely reflects the lesser depth and liquidity of their bond and money markets, together with the greater relevance of exchange rate risk for many EME economies.
OTC derivatives appear to play a bigger role in EMEs than exchange-traded derivatives. Around 56% of the derivatives are traded over the counter in emerging markets, relative to a ratio of less than one half traded over the counter in advanced economies.2 This ratio of OTC to total derivatives transactions continues to rise in EMEs; for the remainder of the paper, we will focus on developments in OTC derivatives markets as well as FX spot markets.
OTC FX derivatives markets
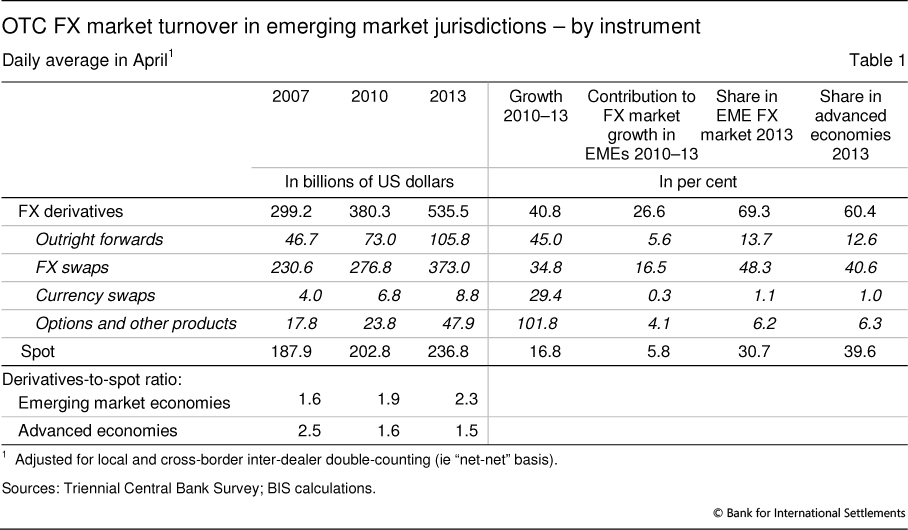
Growth in OTC FX derivatives turnover in emerging market economies has been very strong in recent years. Turnover rose from $380 billion to $535 billion, or by more than 40% over the period 2010-13 (Table 1). Growth has been considerable across the entire range of instruments, including outright forwards (45%), FX swaps (35%), currency swaps (29%) and options (102%). In each of these instruments, growth in turnover was greater than in advanced economy markets.
The OTC markets' growth in FX derivatives - at 41% over the 2010-13 period - far exceeds the growth in FX spot market turnover (17%). FX derivatives transactions constituted 69% of all OTC FX transactions during the survey period of 2013, compared with 65% in 2010, and 61% in 2007. The share of FX derivatives in OTC FX market turnover is now significantly higher (and spot turnover significantly lower) than the corresponding shares in advanced economies.
The major contribution of FX derivatives to the growth in EME currencies turnover is consistent with the view that hedging demand and speculation by foreign portfolio investors - interested in mitigating the exchange rate risks of their local currency investments or speculating on currency movements - has grown in importance. At the same time, international capital flows are increasingly having an impact on the stability of domestic economies and financial systems (Lane (2013)). The relatively smaller share of spot trading in the FX market turnover of EME currencies may also reflect the still limited scale of high-frequency trading (HFT) in these currencies, as HFT is more common in spot than in derivatives markets.
The increasing importance of "other financial institutions"
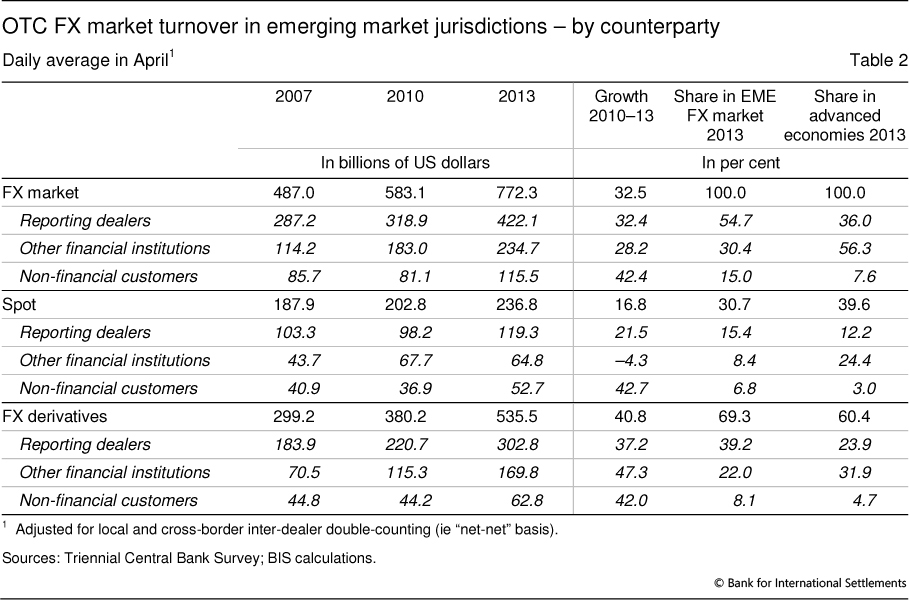
Growth of OTC FX derivatives turnover in emerging markets has differed considerably across types of counterparty (Table 2). Increased dealing is most evident with "other financial institutions", which include non-reporting banks, institutional investors, hedge funds and proprietary trading firms as well as official sector financial institutions. The share of FX derivatives in total OTC derivatives turnover increased from 30% to 32% over the period 2010-13, after an even more pronounced increase in 2007-10. Meanwhile, the share of trade with reporting dealers, usually commercial and investment banks, has fallen from 61% to 58% in 2007 and 2010, and to 57% in 2013.
Several factors underpin this trend. In particular, whereas trading in major currencies has incurred very low transaction costs for some time, many EME currencies have only recently achieved lower costs of trading (see Rime and Schrimpf (2013)).3 It is also possible that high interest rate differentials and the scope for leveraged carry trades in some EME currencies have increased investor interest: particularly strong growth was seen between April 2010 and April 2013 in many high-interest rate currencies commonly identified as carry trade targets, such as the Indian rupee, Mexican peso and Turkish lira. The reduction of barriers to capital mobility in some countries may also account for an increasing importance of turnover with "other financial institutions". In the past, limited capital account openness reduced the share of trading with financial customers (Tsuyuguchi and Wooldridge (2008)).
Another possible explanation is that the activity of "other financial institutions" may in part reflect official sector interaction with currency markets, such as FX intervention where the official sector has leaned against appreciation pressures. The new survey breaks down the category of other financial institutions into subcategories. Notably, official sector financial institutions generally occupy a larger share in the category of "other financial institutions" in emerging economies (around 7%) than in advanced ones (2%). The share is highest in emerging Asia (8%), even more so when the region's two largest financial centres are not included (10%).
OTC interest rate derivatives
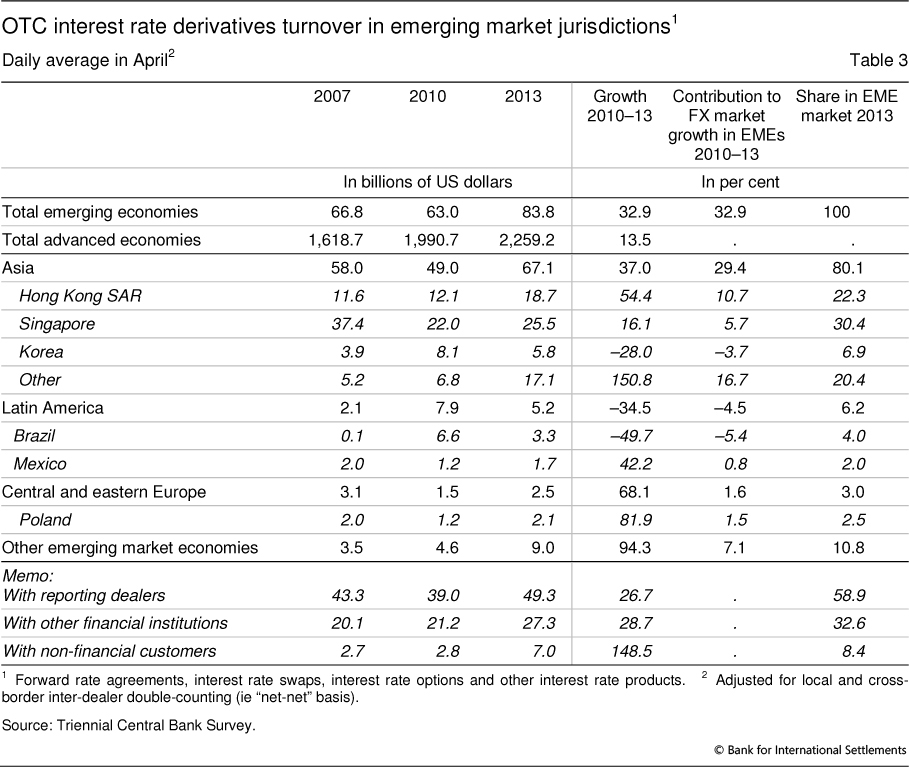
Interest rate derivatives markets in EMEs are still at an early stage of development. They have grown by one third over the past three years, but the average daily turnover of $84 billion (Table 3) remains at only 15% the size of FX OTC markets. Interest rate derivatives turnover in EMEs is also less than 4% of that in advanced economies, compared with a much larger proportion of 19% for OTC FX derivatives turnover. When it comes to turnover on exchanges only, EMEs also lag, at 3% of the turnover on advanced economy exchanges.
Growth in EME interest rate derivatives turnover was almost completely driven by Asia. Activity was particularly strong in Hong Kong SAR and Singapore, which together accounted for 16 percentage points of the 33% growth. By contrast, turnover fell by 35% in Latin America, owing to a 50% decline in interest rate derivatives in Brazil, the most active market in the region.
The lagging development of EME interest rate derivatives relative to FX markets is also reflected in the large share of the reporting dealer segment. Nearly 60% of transactions go through reporting dealers, only marginally lower than in previous surveys. By contrast, in advanced economies the turnover share of reporting dealers is barely more than one third.4
The trading of EME currencies: onshore versus offshore
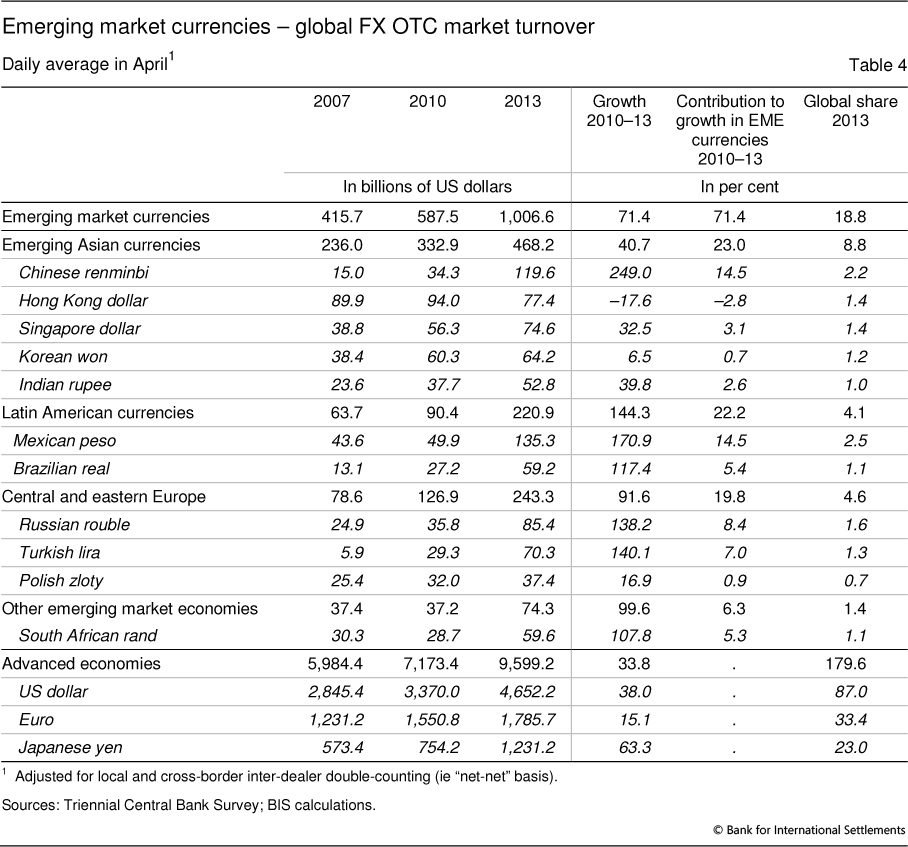
The earlier analysis has focused on FX trading in EME jurisdictions, but in recent years the trading of EME currencies - in particular offshore - has been even more buoyant. Global OTC FX spot and derivatives transactions grew by more than 71% in the 2010-13 period (Table 4). This is well above the growth of FX transactions taking place in EME jurisdictions alone. This increase in global turnover is far greater than the 34% increase in turnover seen for advanced economy currencies.
Among emerging market currencies, those of emerging Asia still account for almost half (47%) of total turnover, while those of Latin America and central/eastern Europe account for 22% and 24%, respectively. Turnover in Latin American currencies has increased the most, by 144% between 2010 and 2013. Although starting from a much lower base, Latin America contributed virtually the same amount to the growth of EME currency turnover as did emerging Asia. Among specific currencies, turnover growth in the Chinese renminbi, Mexican peso and Brazilian real has been particularly rapid at 249%, 171% and 117%, respectively.
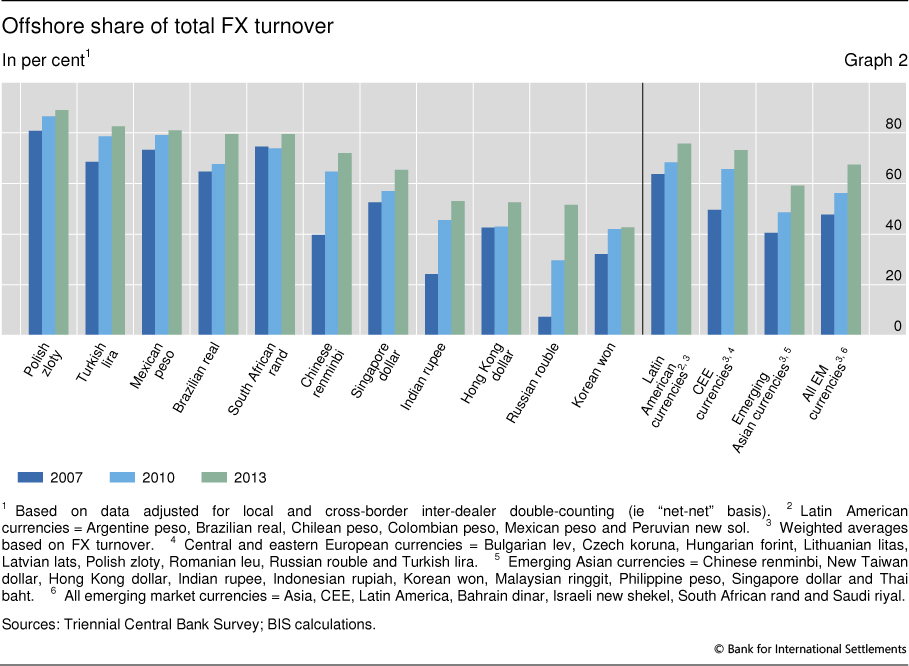
The most rapid growth in the turnover of EME currencies has been in the offshore component:5 the offshore share of total FX transactions has steadily increased across a broad spectrum of currencies (Graph 2). While the offshore trading share of a currency is not the only indicator, it is an important gauge of how international a currency is.6 Overall, growth in the daily offshore turnover of Asian currencies contributed 35 percentage points to their total growth of 41% in the 2010-13 period. A similar pattern emerges for the other major EME regions Latin America and central/eastern Europe. This is also consistent with previous periods such as 2007-10, when offshore trades were an equally dominant driver of turnover in EME currencies.7 Growth in EME FX turnover is also far in excess of related country trade growth, suggesting that the "financialisation" of EME currencies has continued as in earlier periods (McCauley and Scatigna (2013)).
Role of the renminbi and limited regional trading of EME currencies
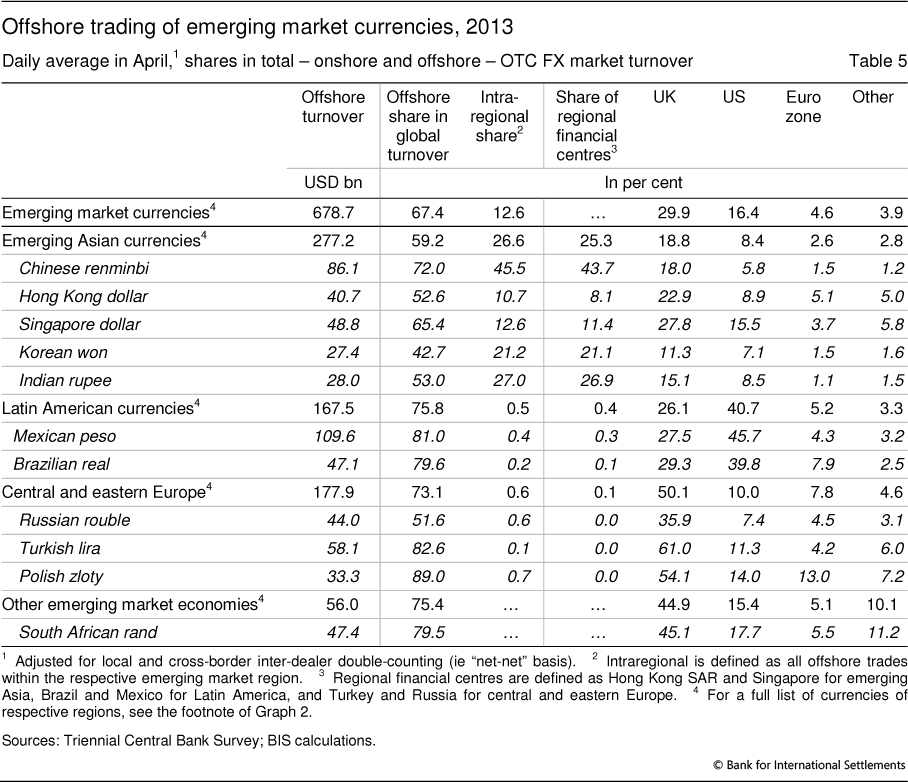
Despite the growth in offshore trading, the trading of most EME currencies within their proximate geographical region remains quite limited. Emerging Asia currencies are the most regionally traded among the major emerging market regions, with more than a quarter (26%) of trading taking place offshore, but within emerging Asia (Table 5). Nevertheless, offshore trading in the United Kingdom (19%) and the United States (8%) together account for a larger share in the turnover of emerging Asia currencies - and this despite the large offshore trading hubs in Hong Kong SAR and Singapore.
Within emerging Asia, the Chinese renminbi is playing an increasingly prominent role, as a significant part of its turnover is generated offshore within the region. Offshore turnover amounts to $86 billion per day, equivalent to 72% of its total volume globally, and nearly two thirds is within emerging Asia. In this respect the Chinese renminbi is unique among all major emerging market currencies. Even though the high offshore ratio is in part due to restrictions on onshore trading, its greatly increased turnover within emerging Asia reflects China's increasingly dominant economic and financial role in the region (Park and Song (2011), Cheng et al (2013)).
No other major emerging market region possesses a regional currency with similar importance. Even though both Latin American and central/eastern European (CEE) currencies are to a large extent traded outside their home jurisdiction (offshore ratios of 76% and 73% respectively), their offshore penetration within their respective geographical regions is virtually zero. While the Mexican peso and the Brazilian real are now the first and fifth most traded EME currencies globally, their growth has been driven mainly by derivatives markets located in the United States (41%) and the United Kingdom (26%). Meanwhile, the euro area's role for the trading of CEE currencies has become quite limited (8% of total and 11% of offshore turnover) - perhaps the result of its banks shifting trading desks to London.
The UK as offshore trading hub and the US dollar as vehicle currency
As EME currencies became increasingly international, the United Kingdom established itself as their leading offshore trading hub. In total, 30% of all FX OTC market turnover involving EME currencies takes place in the United Kingdom (Table 5). The next largest offshore trading hub is the United States at 16%, with growth driven largely by the Mexican peso and Brazilian real. The United Kingdom, however, hosts a large share of turnover in all EME currencies, with virtually no exceptions. And its role as an offshore trading hub has been expanding. In 2007, the United Kingdom reported a share of 13% of the global FX market for EME currencies, which had risen to 22% by 2010, and further to 30% by 2013.8
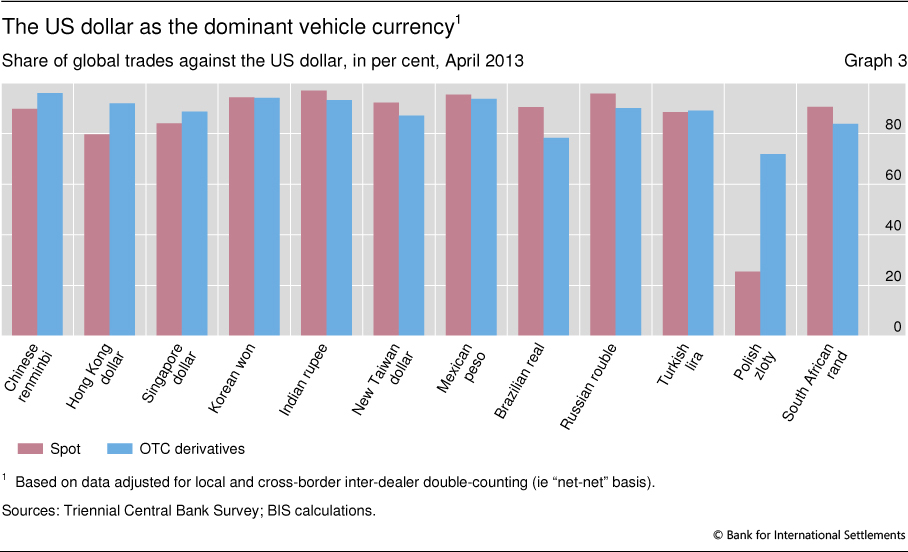
Consistent with the growing internationalisation but limited regionalisation of EME currencies is the dominant and established role of the US dollar as a vehicle currency. The improved reporting of offshore trades against major EME currencies in the 2013 survey allows, for the first time, a precise and comprehensive view on EME currency trades against the US dollar.9 Graph 3 shows all EME currencies for which these data have been collected. Overwhelmingly, the major EME currencies are traded against the US dollar - and this holds true for both the spot and the OTC derivatives market.10
Cross-border financial flows and the internationalisation of emerging market currencies
The large increase in FX turnover has coincided with surging cross-border financial flows to and from emerging markets over the same period. Very low interest rates and unconventional monetary policies in advanced economies during 2010-13 have increased the appetite of international investors and banks for emerging market assets (Caruana (2013), Rey (2013)). In addition, Europe's crises have encouraged many international investors to shift their focus more towards emerging markets.
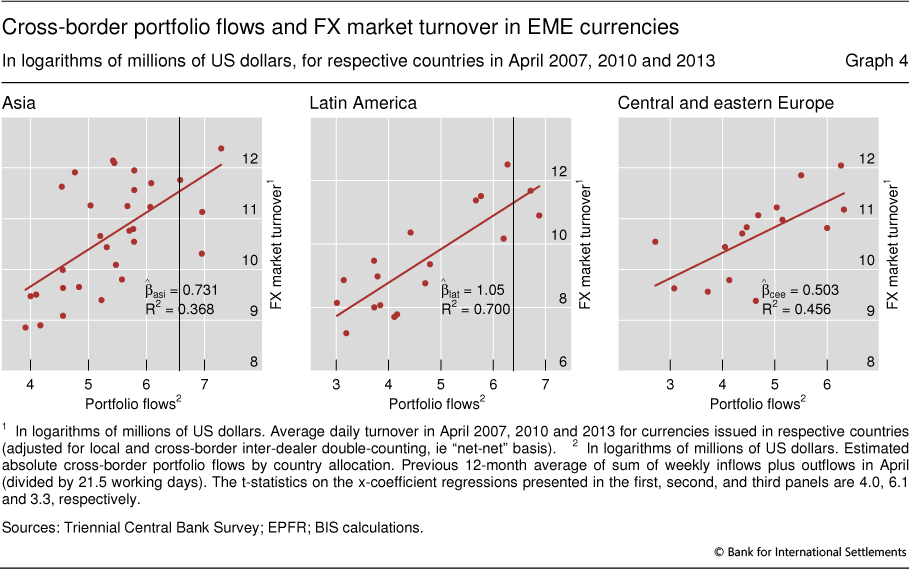
Whereas the link between more broad-based macroeconomic measures, such as GDP per capita or cross-border trade, and FX market development is well documented, the link between cross-border financial linkages and FX market development has been less intensively studied.11 We investigate the potential importance of this link by analysing the correlation between mutual fund flows12 and FX market turnover. From EPFR, a data provider, we obtain weekly equity and bond mutual fund flows and their allocation to individual EMEs. We then approximate daily absolute turnover by averaging the sum of absolute weekly flows in April (divided by the average number of working days) over the 12 months leading up to the respective Triennial Survey dates (April 2007, 2010 and 2013). FX market turnover is measured as the global turnover of the respective EME currencies from the Triennial Surveys.
Graph 4 shows the bivariate correlations of mutual fund portfolio flows and FX turnover for the major EME regions. The scatter plots depict one point for each country's gross cross-border portfolio flows (x-axis, in logs) and global FX market turnover in the corresponding currency (y-axis, in logs). In each panel we plot all available portfolio flow-currency turnover pairs for the last three Triennial Surveys together.
Consistent with the idea that international investors could be an important driver of the growing demand for EME currencies, each panel in Graph 4 exhibits a positive and statistically highly significant relationship between portfolio flows into and out of emerging markets and the FX market turnover in the respective currencies. The estimated size of the link varies across EME regions, but is in all cases economically meaningful. In the case of Asia, for instance, a 10% increase in cross-border fund flows is associated with a 7% increase in global FX turnover in emerging Asia currencies; in Latin America the link is even stronger, at 10%.13 While the results are tentative and should be interpreted with caution, they are nevertheless suggestive of a significant role for financial flows in explaining the increased turnover in EME currencies.
Conclusion
FX market growth in emerging market currencies is driven mainly by growth in derivatives markets. At the same time, an increasing share of emerging market currencies is traded offshore and, in that sense, these currencies are becoming more international. However, with the significant exception of the Chinese renminbi in emerging Asia, the offshore trading of EME currencies within their proximate geographical region is relatively small. One explanation for both the strong growth in the derivatives market and the internationalisation of EME currencies is the increasing demand from international investors to expand or hedge exposure to currency risk, as reflected in the strong correlation between growth in EME currency turnover and cross-border mutual fund flows.
References
Caruana, J (2013): "Global liquidity: where do we stand?", speech at the Bank of Korea International Conference 2013 on "Assessing global liquidity in a global framework", Seoul, Korea, June.
Cheng, X, D He and C Shu (2013): "Impact of the renminbi on Asian currencies: role of the offshore market", mimeo.
Forbes, K and F Warnock (2012): "Capital flow waves: surges, stops, flight and retrenchment", Journal of International Economics, vol 88 (2), pp 235-51.
Frankel, J (2012): "The rise of the RMB as an international currency: Learning from historical precedents", presentation at the Asia Pacific Equity Conference, Boston, Massachusetts, September.
Goldberg, L (2013): "The international role of the dollar: Does it matter if this changes?", in F Westermann and Y Cheung (eds), Global Interdependence, De-Coupling, and Re-Coupling, MIT Press.
King, M and D Rime (2010): "The $4 trillion question: what explains FX growth since the 2007 survey?", BIS Quarterly Review, December.
Lane, P (2013): "International capital flows and domestic financial conditions", paper presented at the Bank of Thailand and International Monetary Fund conference on "Monetary Policy in an Interconnected Economy", Bangkok, Thailand, November.
McCauley, R and M Scatigna (2013): "Currencies getting more financial", BIS Quarterly Review, in Highlights of the BIS international statistics, December.
Mihlajek, D and F Packer (2010): "Derivatives in emerging markets", BIS Quarterly Review, December.
Park, Y and C Song (2011): "Renminbi internationalization: prospects and implications for economic integration in East Asia", Asian Economic Papers, vol 10 (3), pp 42-72.
Rey, H (2013): "The global financial cycle and monetary policy independence", paper presented at the 2013 Economic Policy Symposium, Federal Reserve Bank of Kansas City, Jackson Hole, Wyoming, August.
Rime, D and A Schrimpf (2013): "The anatomy of the global FX market through the lens of the 2013 triennial survey", BIS Quarterly Review, December.
Thimann, C (2008): "Global roles of currencies", International Finance, no 11 (3), pp 211-45.
Tsuyuguchi, Y and P Wooldridge (2008): "The evolution of trading activity in Asian foreign exchange markets", BIS Working Papers, no 252.
1 The views expressed in this article are those of the authors and do not necessarily reflect those of the BIS. We are grateful to Claudio Borio, Robert McCauley, Andreas Schrimpf, Ilhyock Shim, Chang Shu, Christian Upper and Philip Wooldridge for comments on earlier drafts of the article. We thank Jimmy Shek, Denis Petre and Bat-el Berger for their help with statistical analysis.
2 This may be due to partial coverage of emerging market economies in the BIS exchange-traded derivatives data.
3 High-frequency trading was a reason cited earlier for the rapid growth in advanced economies of trading with "other financial institutions" (King and Rime (2010)). But we think that is unlikely to be the case in emerging markets, at least not to the same extent, because HFT is more common in spot than in derivatives markets. High-frequency trading in EME currencies, however, may pick up in the future, as EME currencies are increasingly featured on the relevant electronic trading platforms.
4 The other main category, "other financial institutions", accounts for only 33% of OTC IR derivatives turnover in EMEs (59% in advanced economies). Although a further breakdown of this category is not available, this likely reflects the smaller turnover share of institutional investors, hedge funds and proprietary traders. Typically, this is an indication of an early stage of market development.
5 We define offshore trades as all trades executed outside the jurisdiction where a currency is issued.
6 A currency's internationalisation involves many more dimensions than just the location of its trades. More generally, internationalisation implies a currency's increasing use by non-residents as a store of value (eg international reserve holdings), a medium of exchange (eg invoicing of trade), and a unit of account (Frankel (2012)). See also the discussion in Goldberg (2013).
7 Since 2013 the reporting of offshore trades in 24 non-G8 currencies is compulsory, correcting a downward bias affecting previous surveys. Until 2010, the reporting for "non-major" currencies was compulsory only in the issuing country, whereas reporting of offshore trades in non-major currencies was left to the discretion of the offshore jurisdiction.
8 As reporting requirements have changed over time, this growth to some extent reflects underreporting in previous periods. See also footnote 5.
9 In addition to offshore trades of the US dollar against the Brazilian real, Chinese renminbi, Hong Kong dollar, Indian rupee, Korean won and South African rand as well as the G8 currencies covered in the 2010 survey, the latest survey requires reporting of US dollar trades against six additional emerging market currencies plus two advanced economy currencies: the Mexican peso, the Polish zloty, the Russian rouble, the Singapore dollar, the New Taiwan dollar and the Turkish lira; plus the New Zealand dollar and the Norwegian krone. Reporting of offshore turnover against the euro and Japanese yen has also been extended (for more details, see www.bis.org/publ/rpfx13.htm).
10 This applies to both onshore trades and offshore trades (89% and 86% of trades are made against the US dollar respectively). An exception is the Polish zloty, which particularly in the spot market is exchanged mainly with the euro.
11 One exception is Thimann (2008), who finds that the development of financial instruments denominated in an emerging economy's domestic currency helps to explain the size of cross-border portfolio holdings.
12 Mutual fund flows are also proxy for the investment activity of international investors, who are likely to be a main driver for currency hedging demand. Hence, our measure allows a more direct interpretation of the results, but it is narrower than the portfolio flows from balance of payments data used in the literature (Forbes and Warnock (2012)).
13 This represents the total effect of financial flows on FX OTC turnover, including the potential effects of other variables such as GDP or trade on financial flows. When GDP is included in the regression, the coefficients on fund flows remain consistently positive, but the coefficients on GDP are insignificant or negative. Estimates are highly similar when looking at the correlation between cross-border flows and derivatives market turnover only.