Chapter I: Sustaining stability amid uncertainty and fragmentation - read the chapter
|
| Data set |
| Chapter I data set (xlsx) |
| Images |
Title |
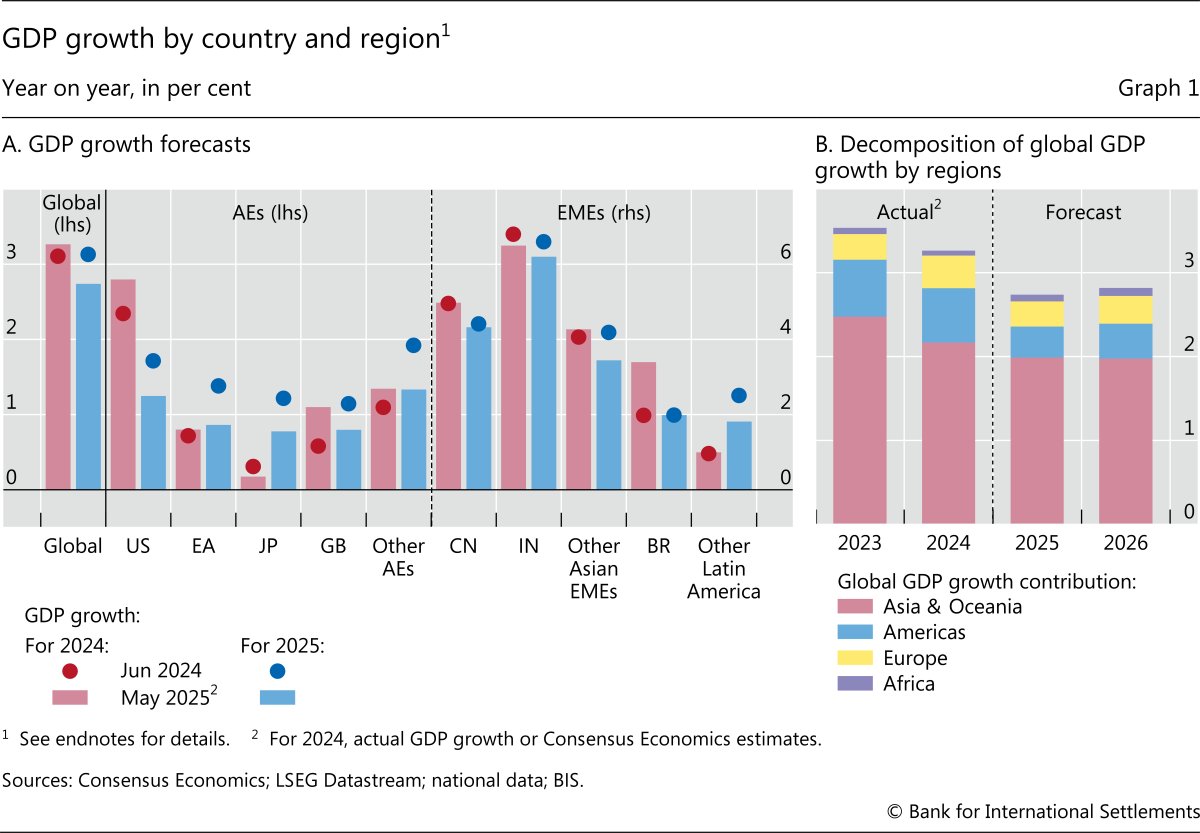
| Graph 1 |
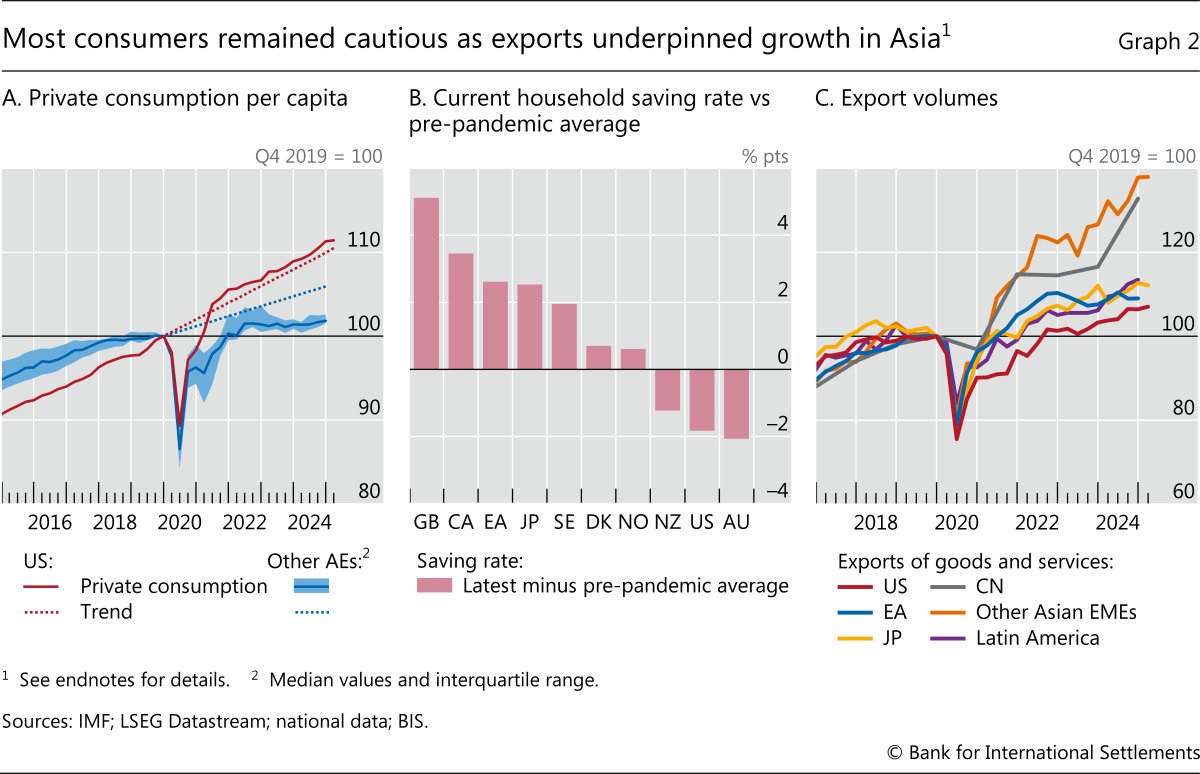
Most consumers remained cautious as exports underpinned growth in Asia |
| Graph 2 |
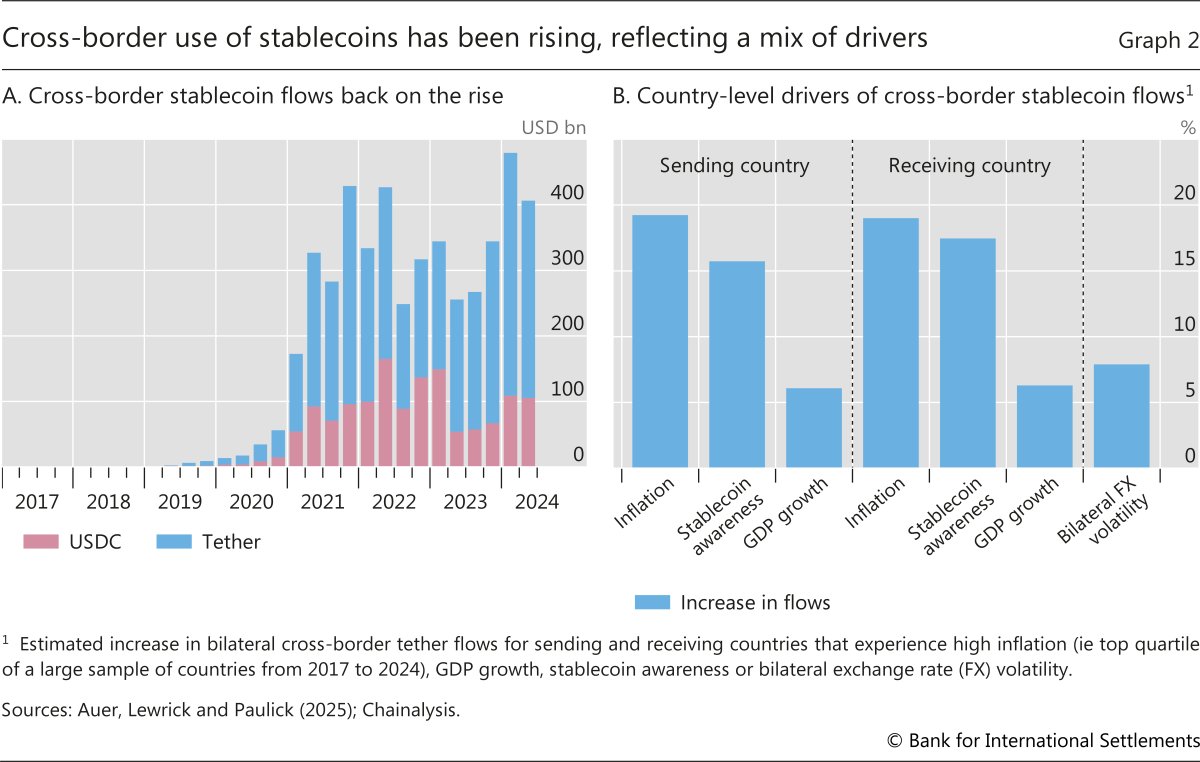
Cross-border use of stablecoins has been rising, reflecting a mix of drivers |
| Graph 3 |
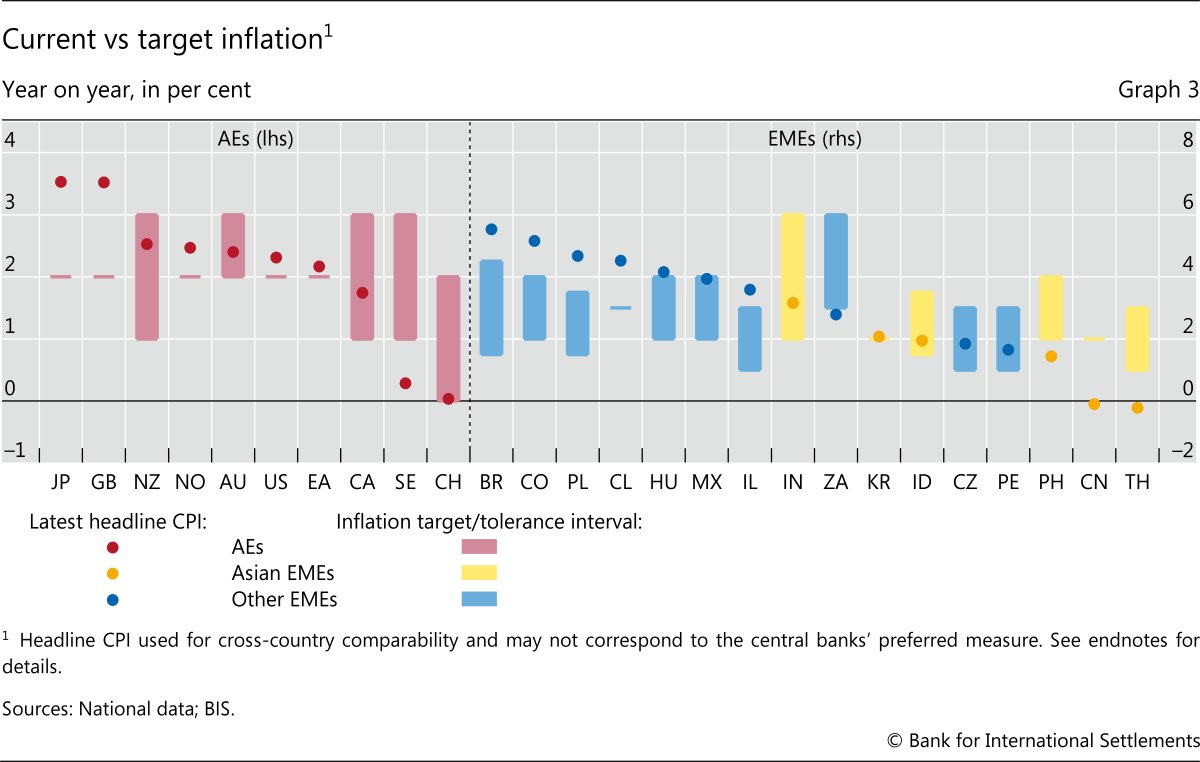
Current vs target inflation |
| Graph 4 |
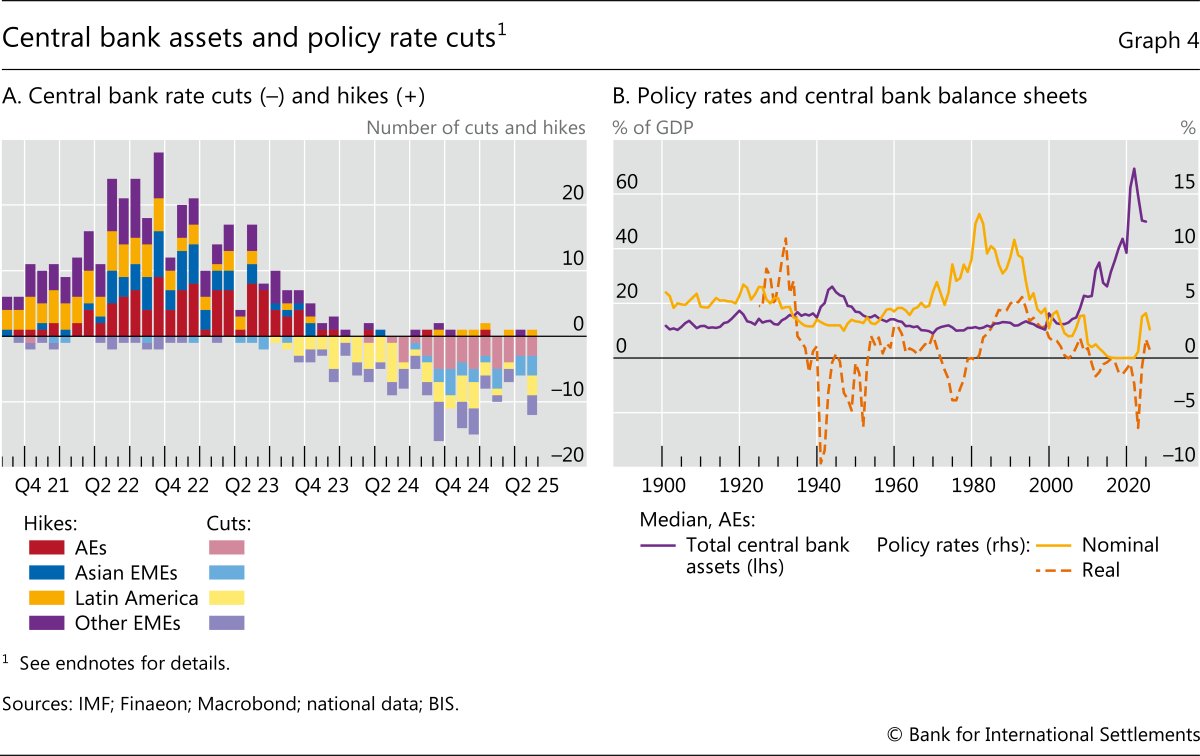
Central bank assets and policy rate cuts |
| Graph 5 |
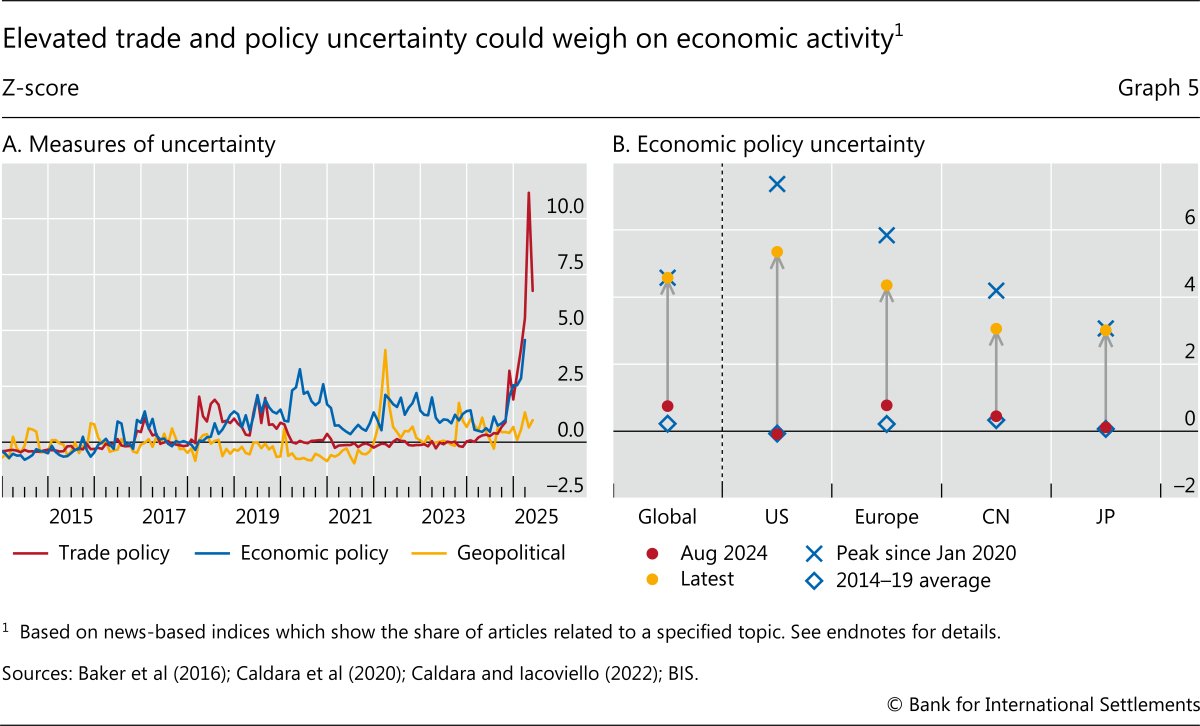
Elevated trade and policy uncertainty could weigh on economic activity |
| Graph 6 |
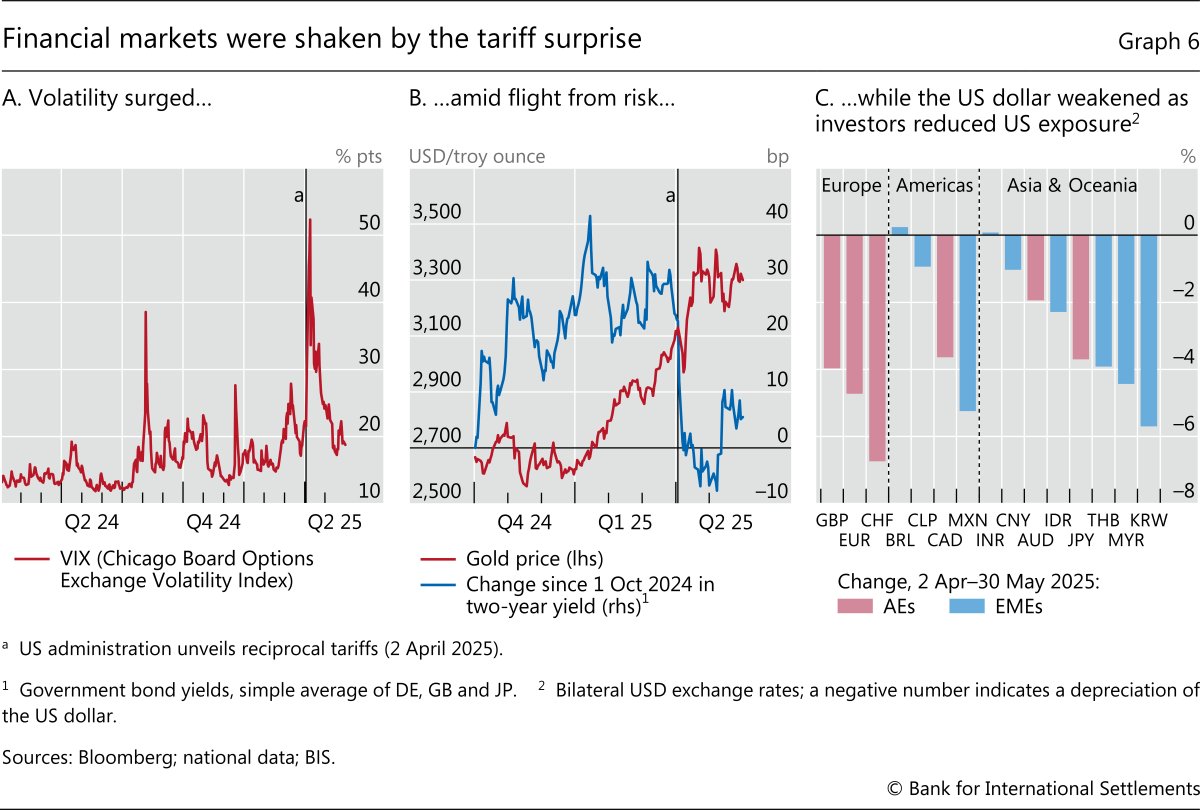
Financial markets were shaken by the tariff surprise |
| Graph 7 |
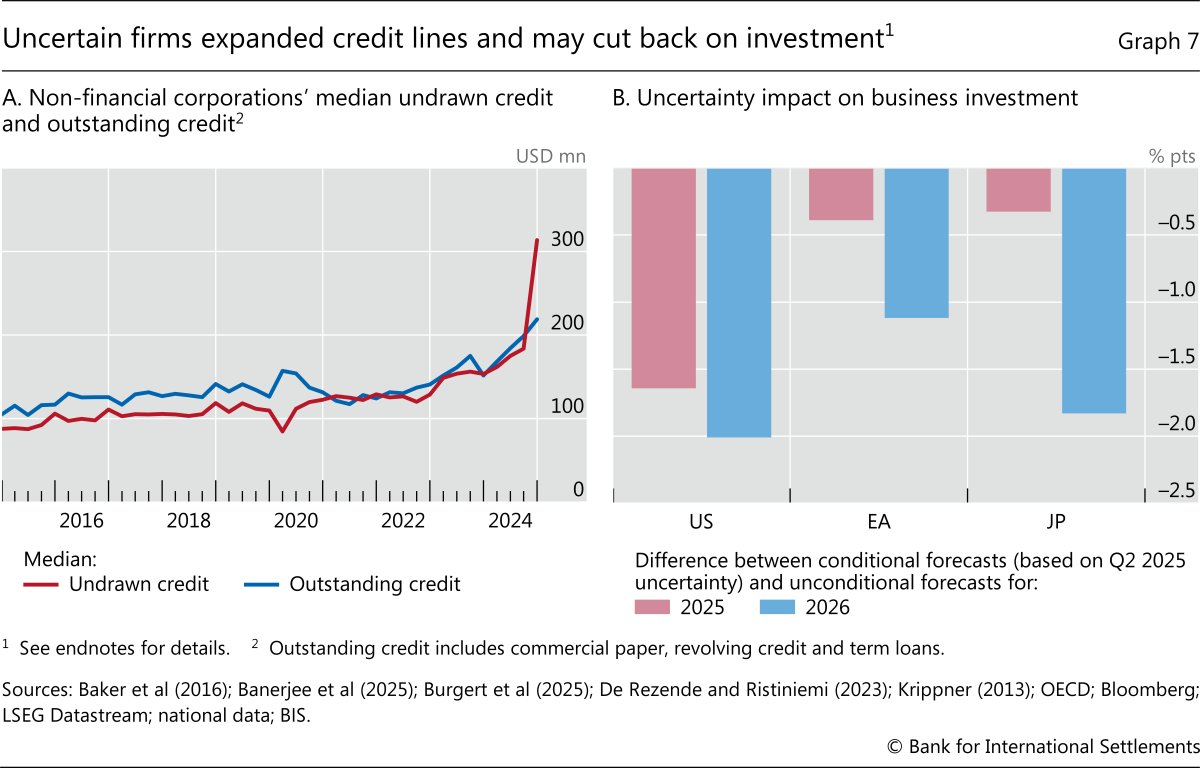
Uncertain firms expanded credit lines and may cut back on investment |
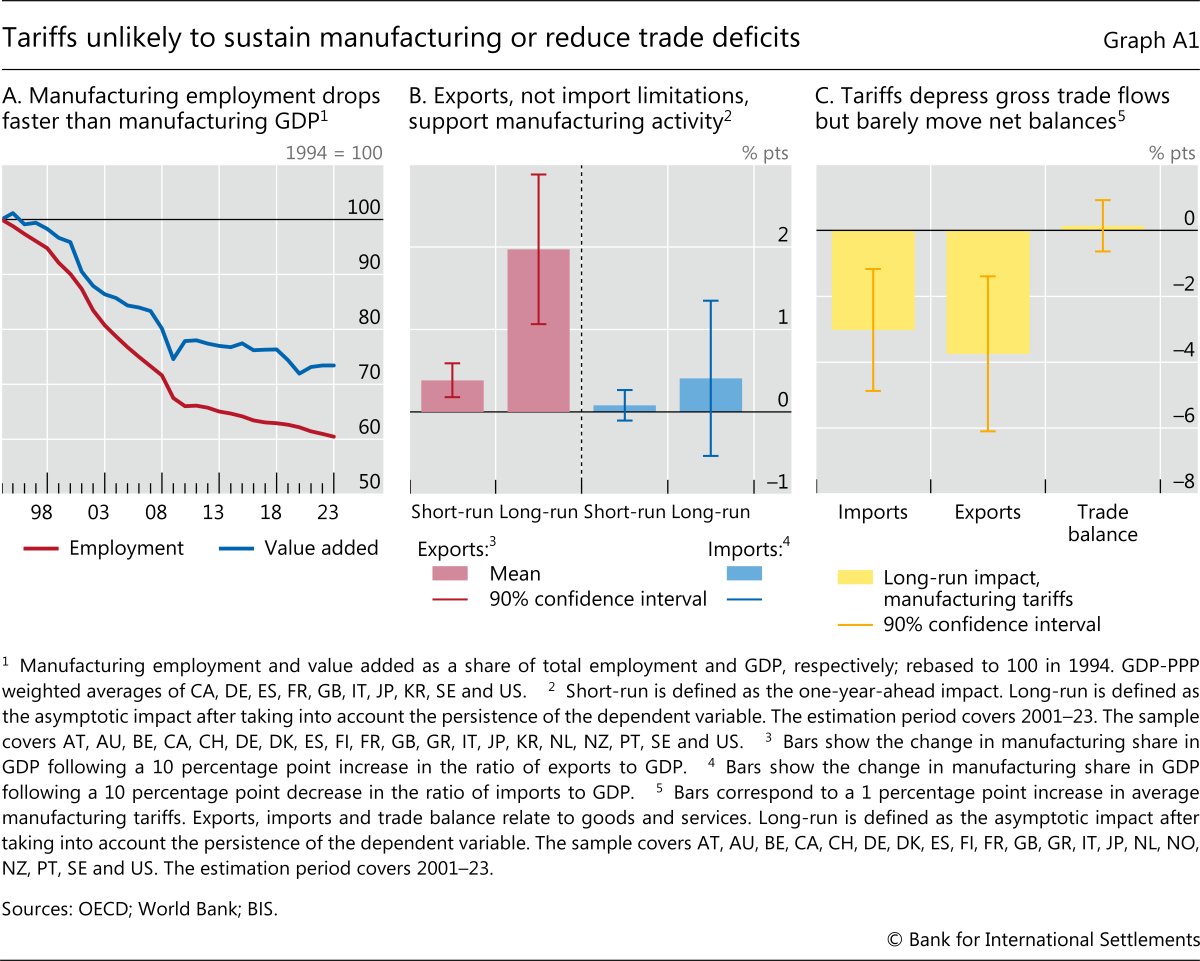
| Graph A1 |
Tariffs unlikely to sustain manufacturing or reduce trade deficits |
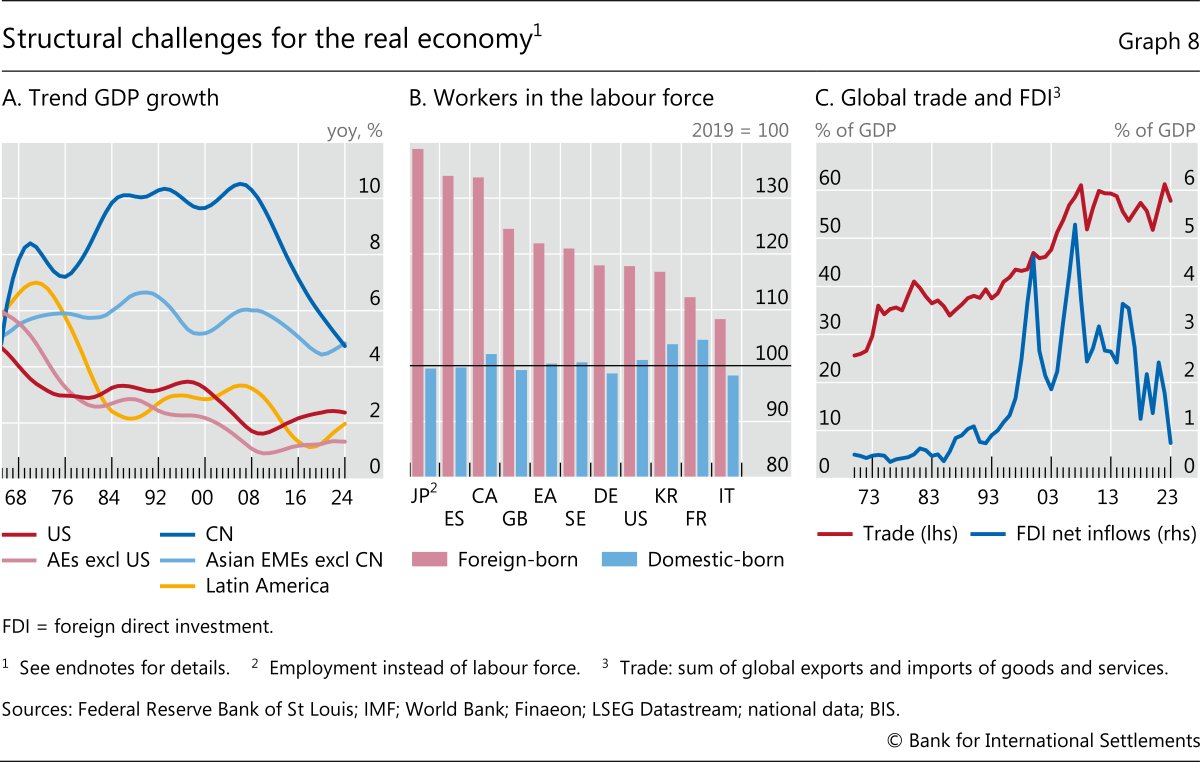
| Graph 8 |
Structural challenges for the real economy |
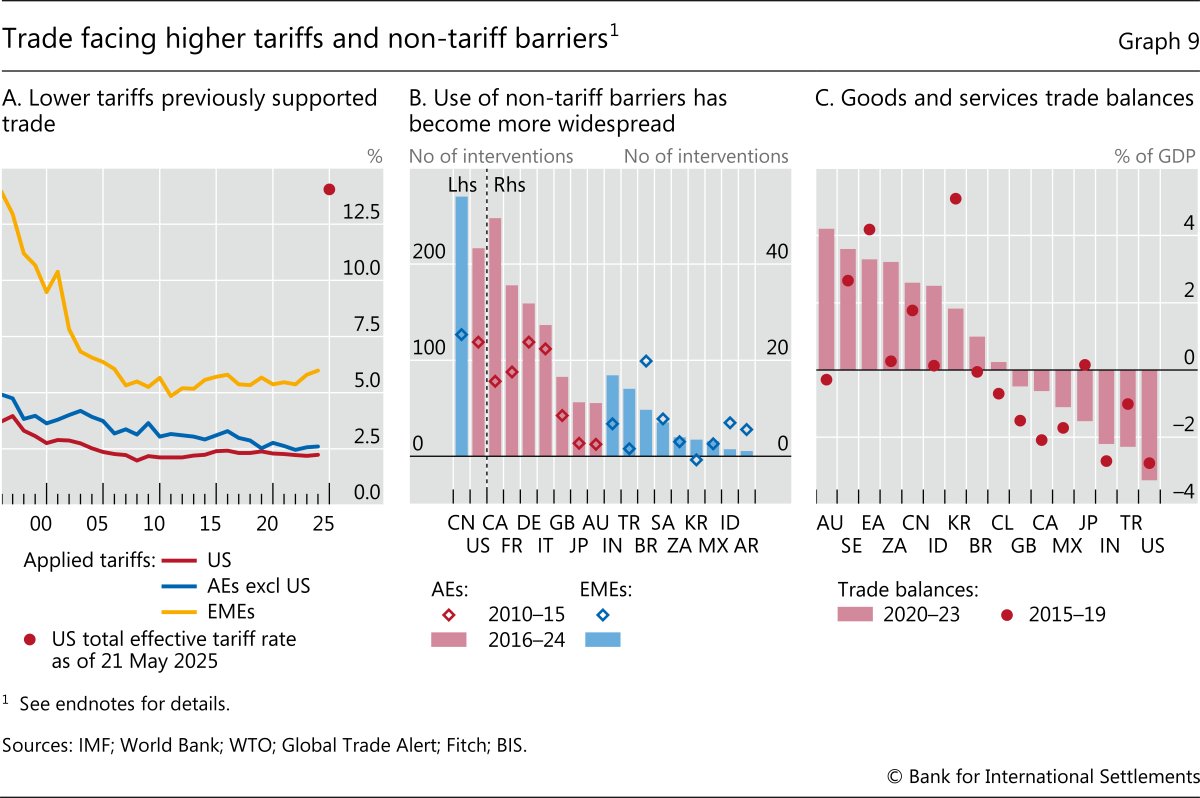
| Graph 9 |
Trade facing higher tariffs and non-tariff barriers |
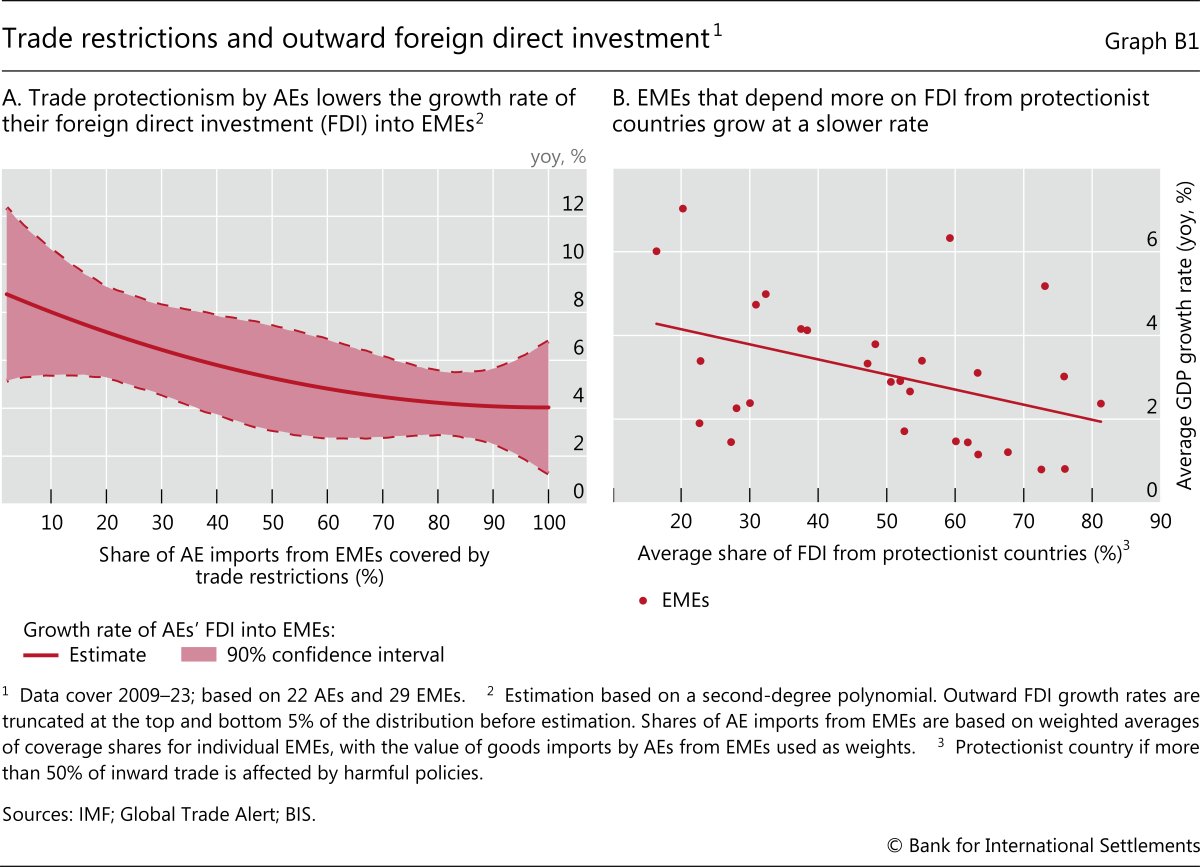
| Graph B1 |
Trade restrictions and outward foreign direct investment |
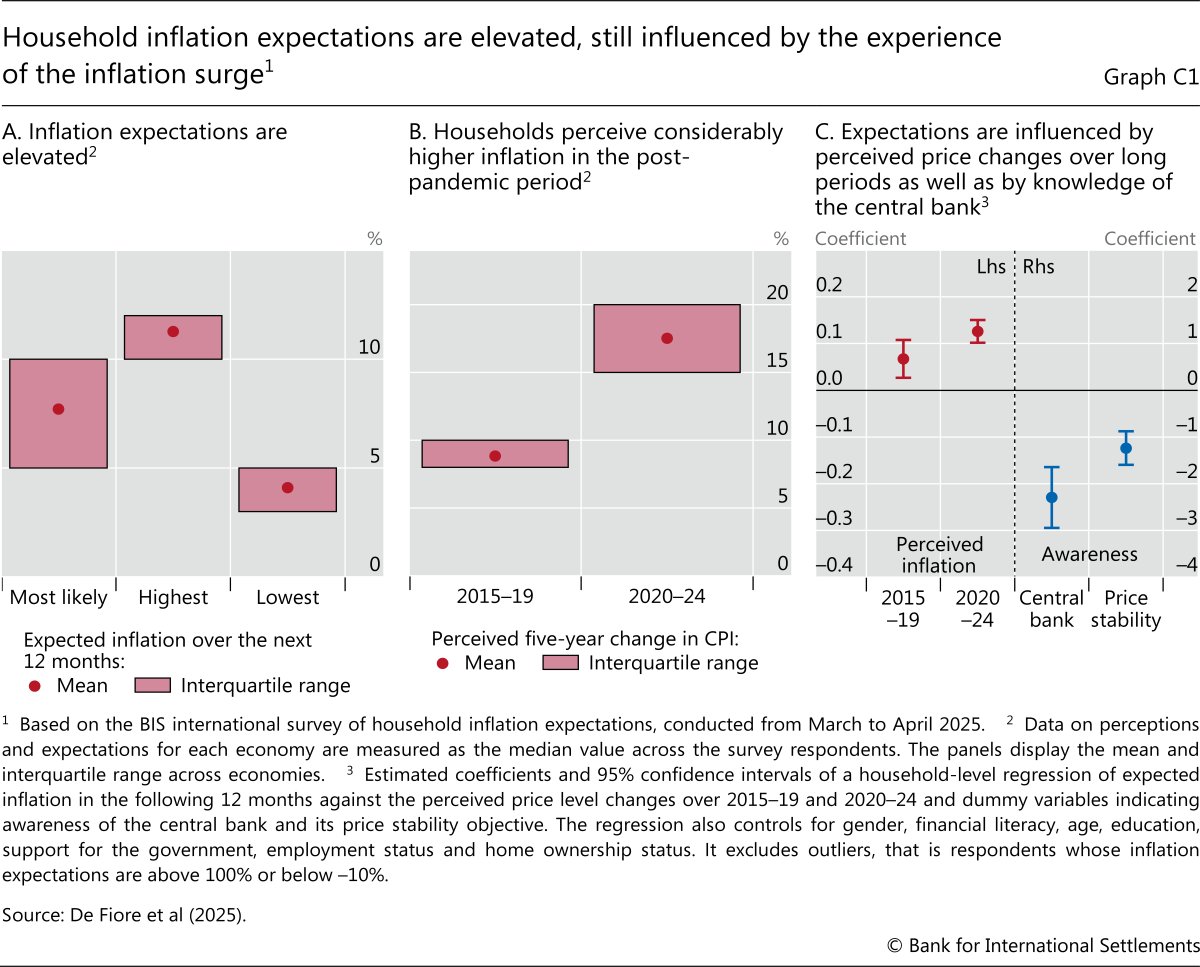
| Graph C1 |
Household inflation expectations are elevated, still influenced by the experience of the inflation surge |
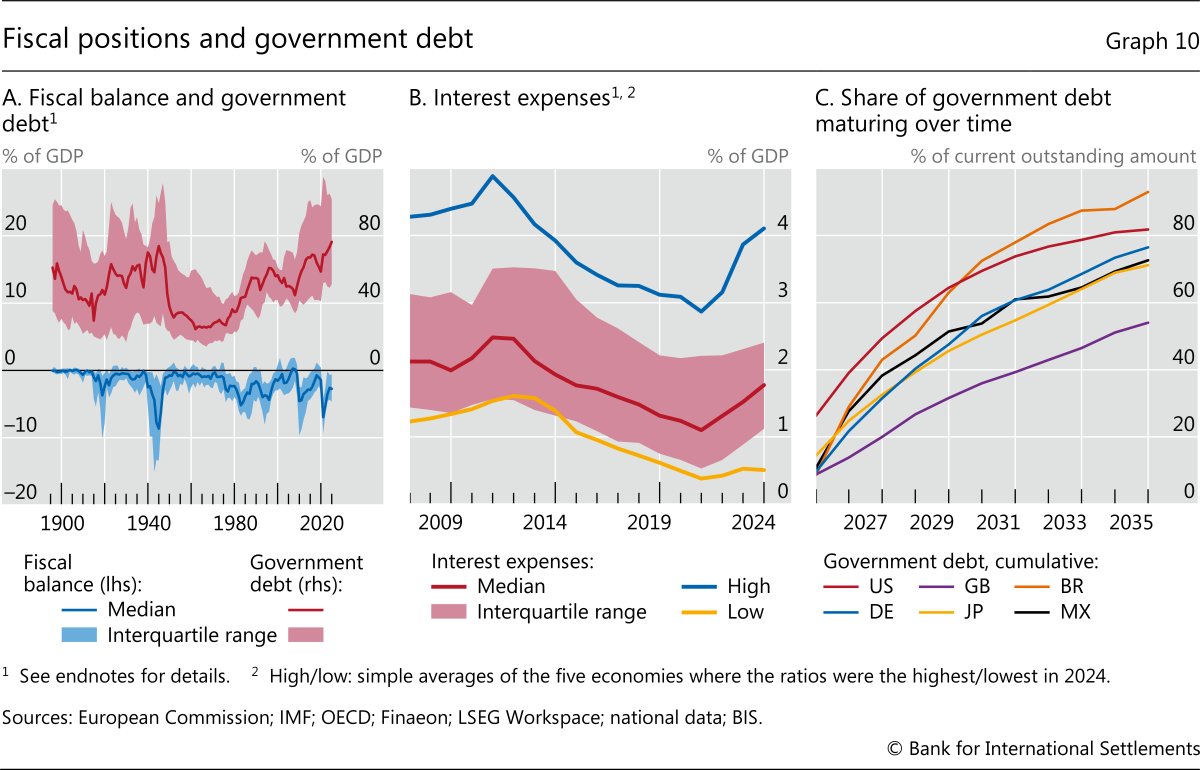
| Graph 10 |
Fiscal positions and government debt |
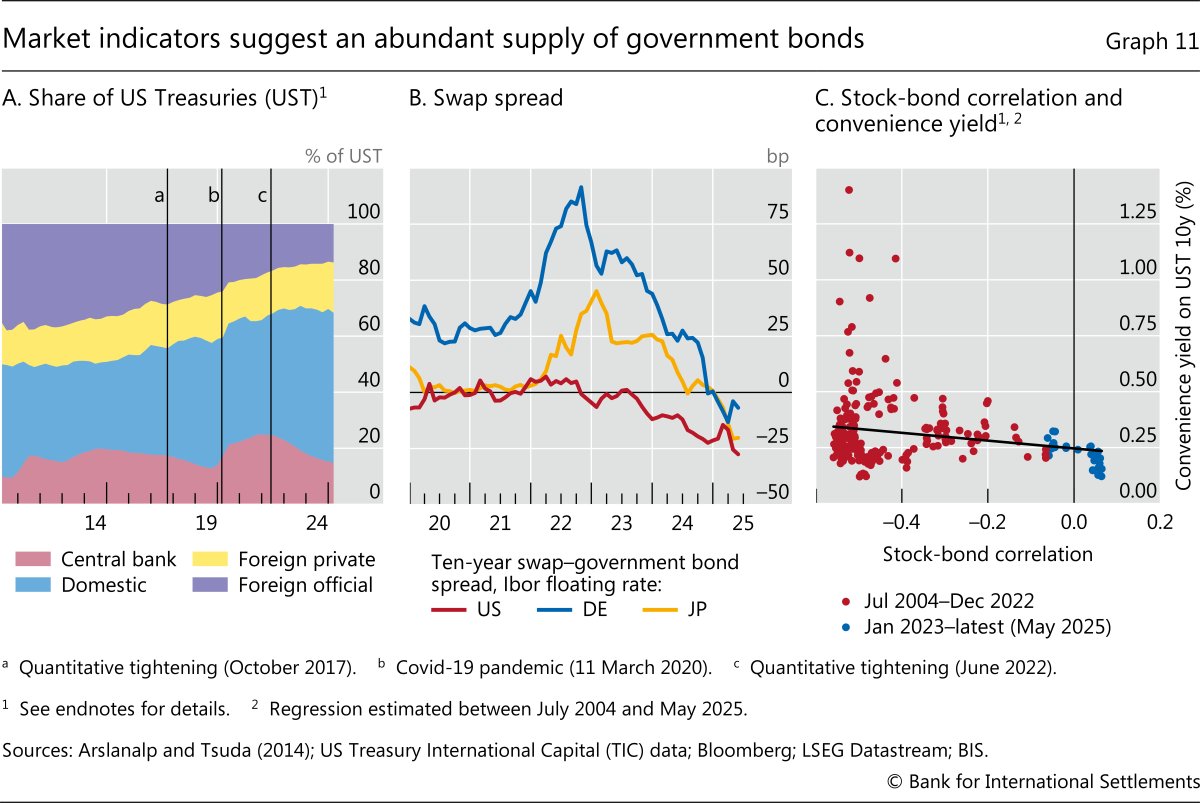
| Graph 11 |
Market indicators suggest an abundant supply of government bonds |
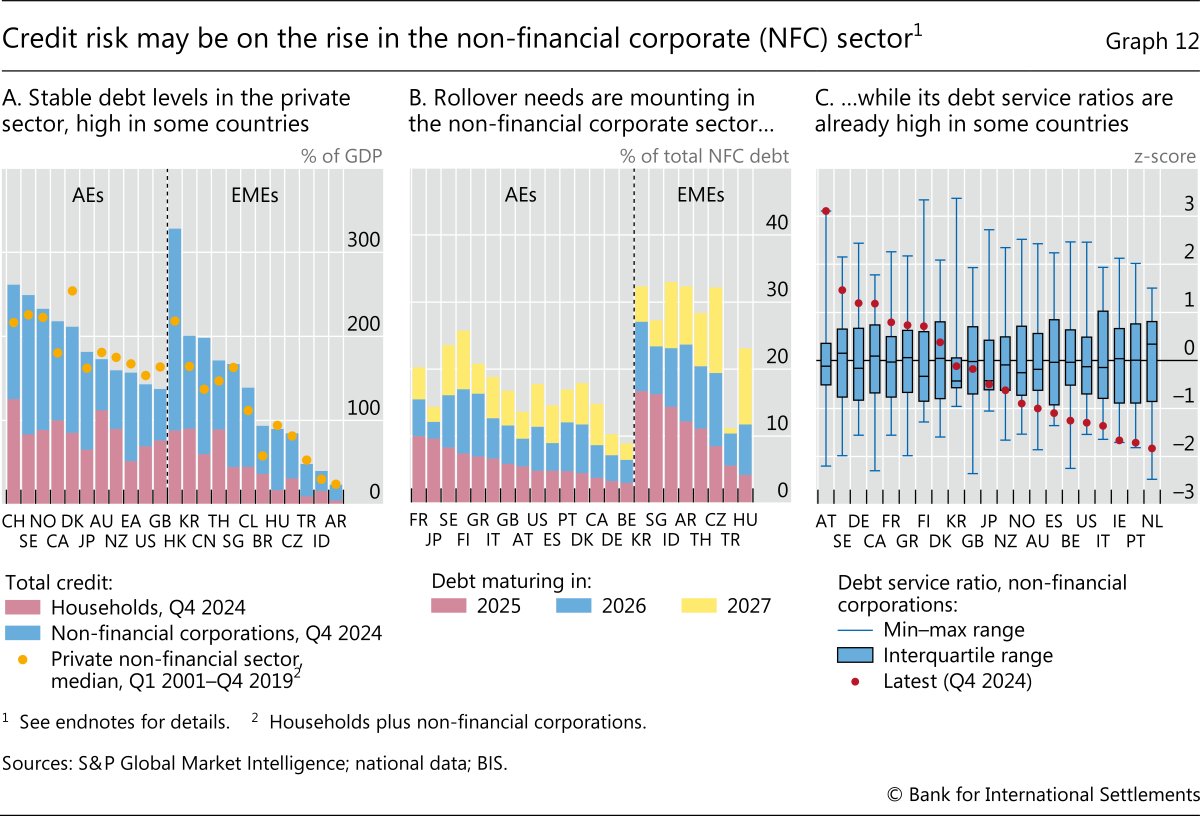
| Graph 12 |
Credit risk may be on the rise in the non-financial corporate (NFC) sector |
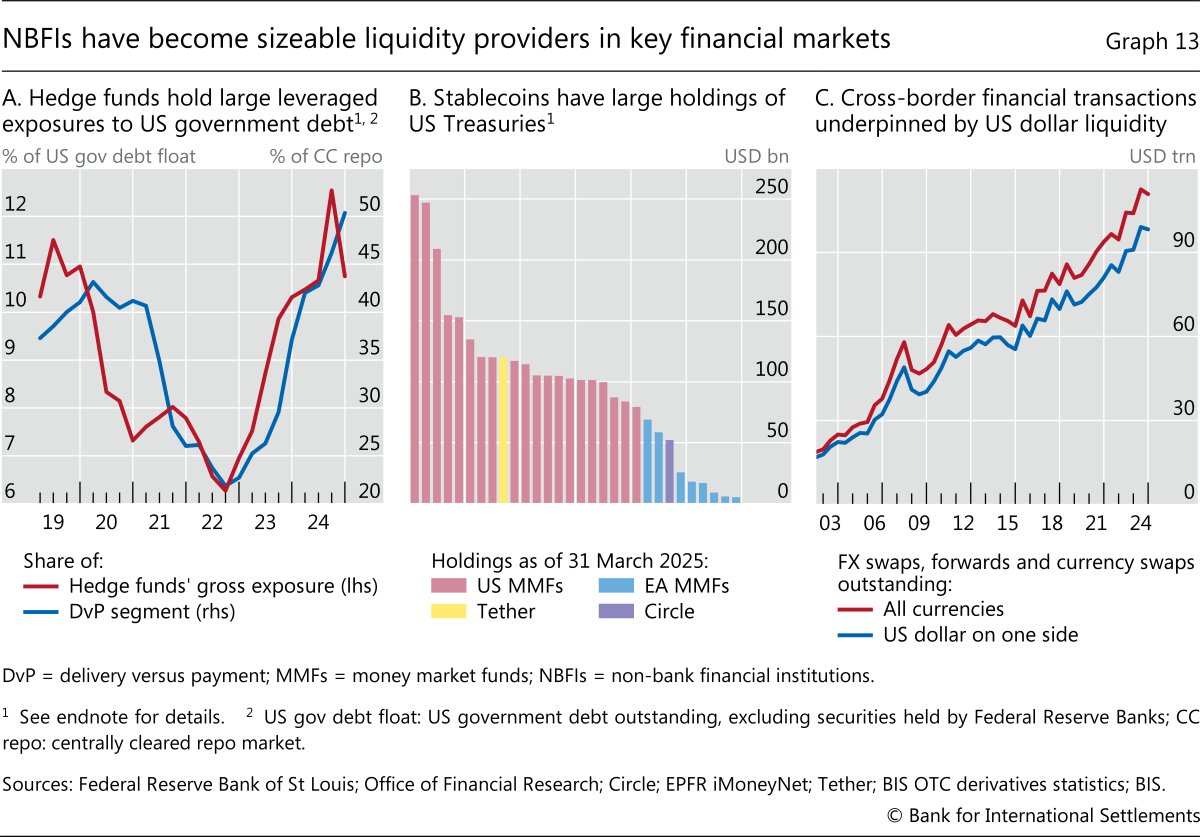
| Graph 13 |
NBFIs have become sizeable liquidity providers in key financial markets |
Chapter II: Financial conditions in a changing global financial system - read the chapter
|
| Data set |
| Chapter II data set (xlsx) |
| Images |
Title |
| Graph 1 |
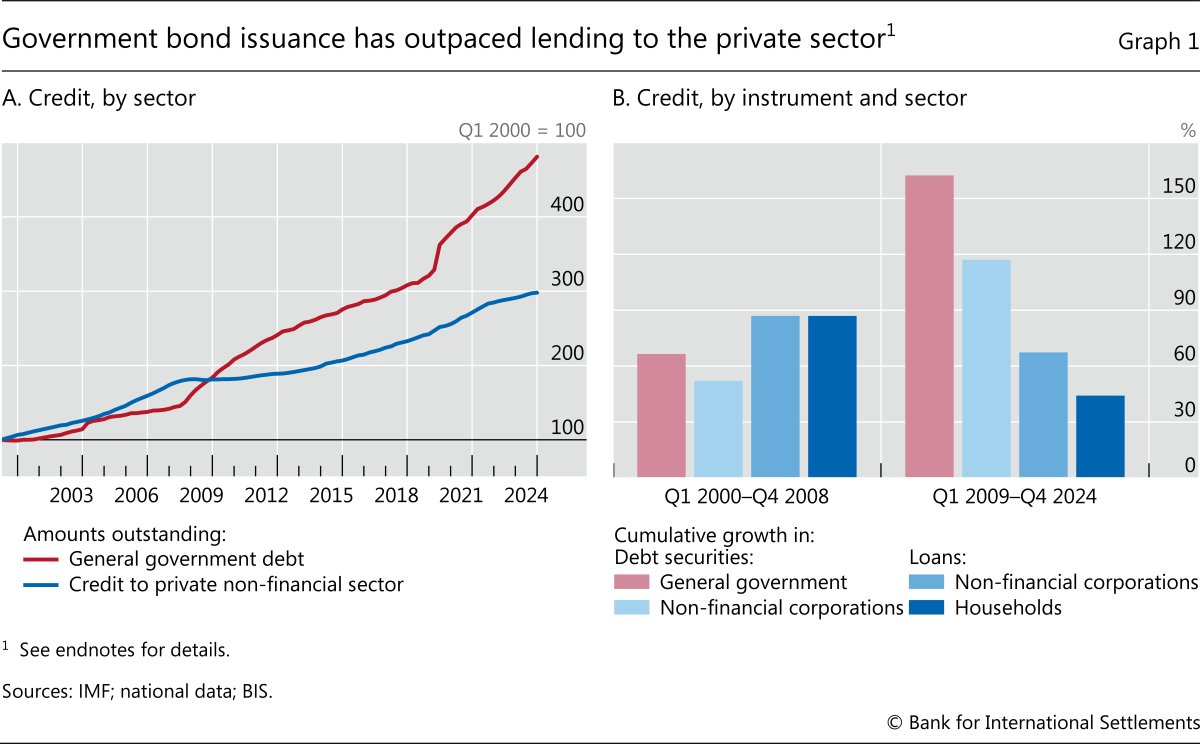
Government bond issuance has outpaced lending to the private sector |
| Graph 2 |
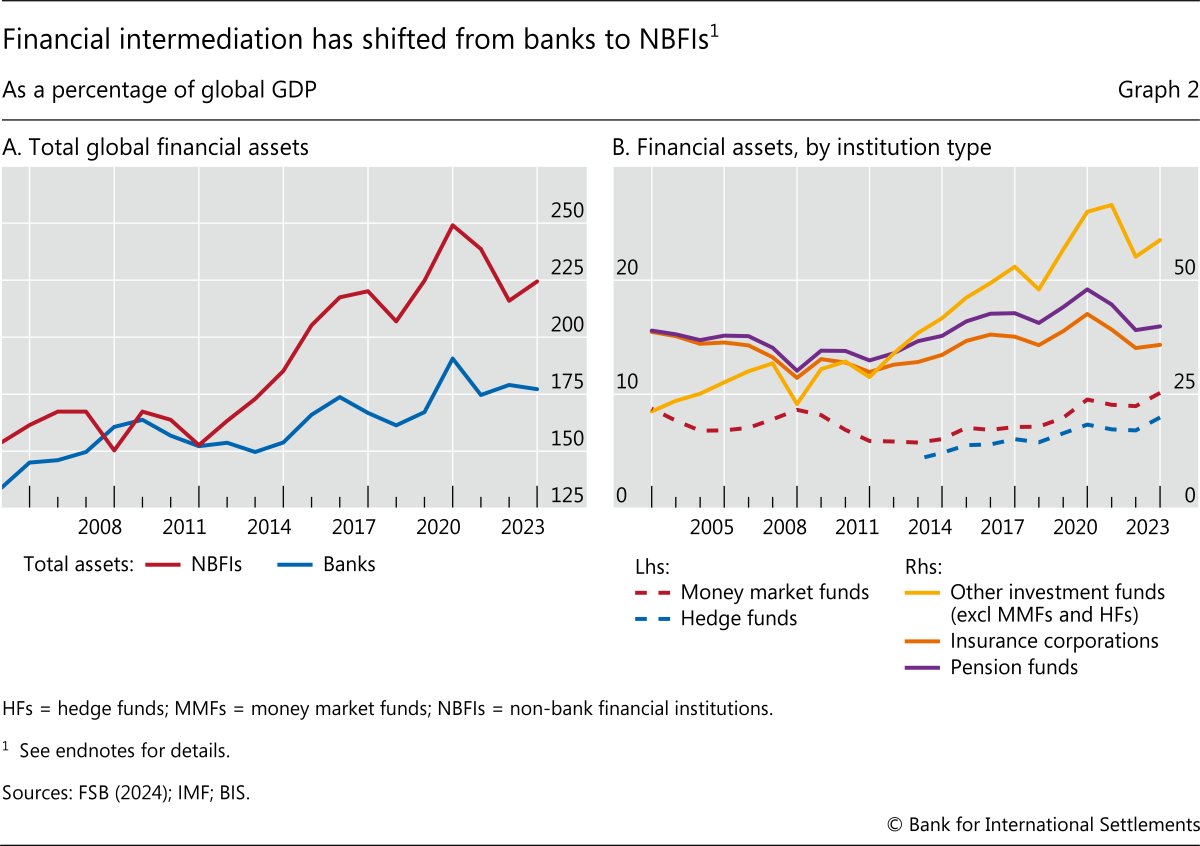
Financial intermediation has shifted from banks to NBFIs |
| Graph 3 |
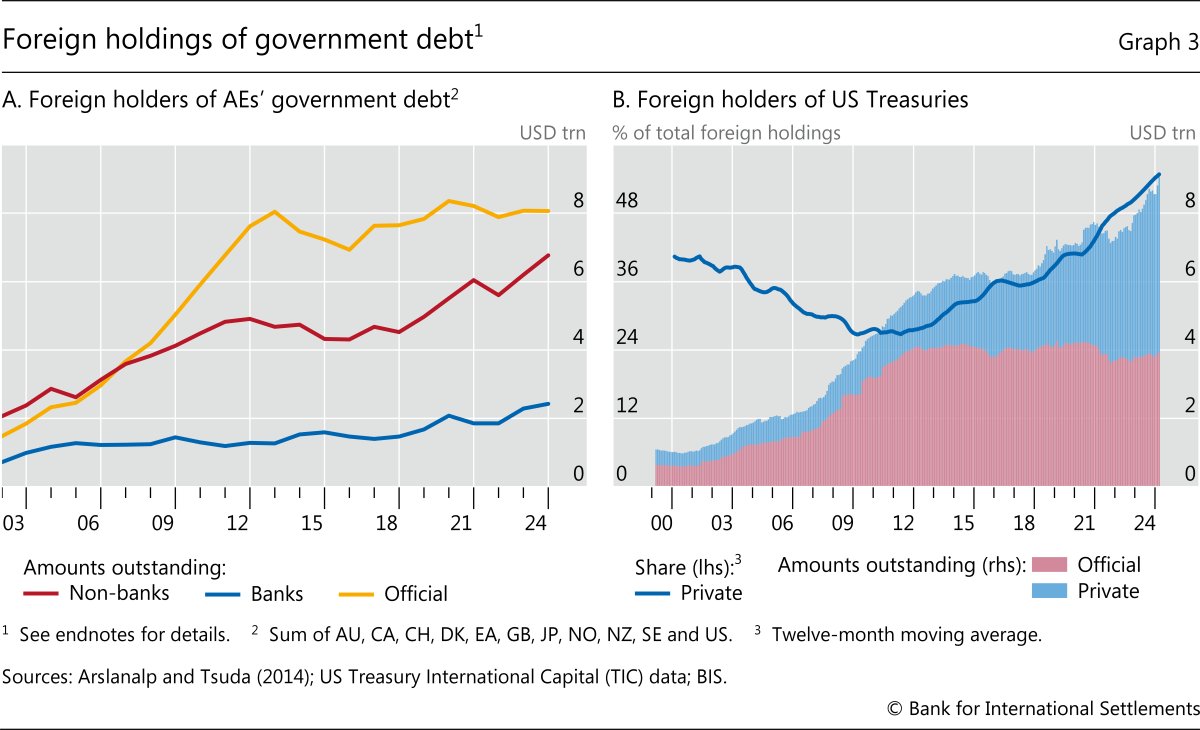
Foreign holdings of government debt |
| Graph 4 |
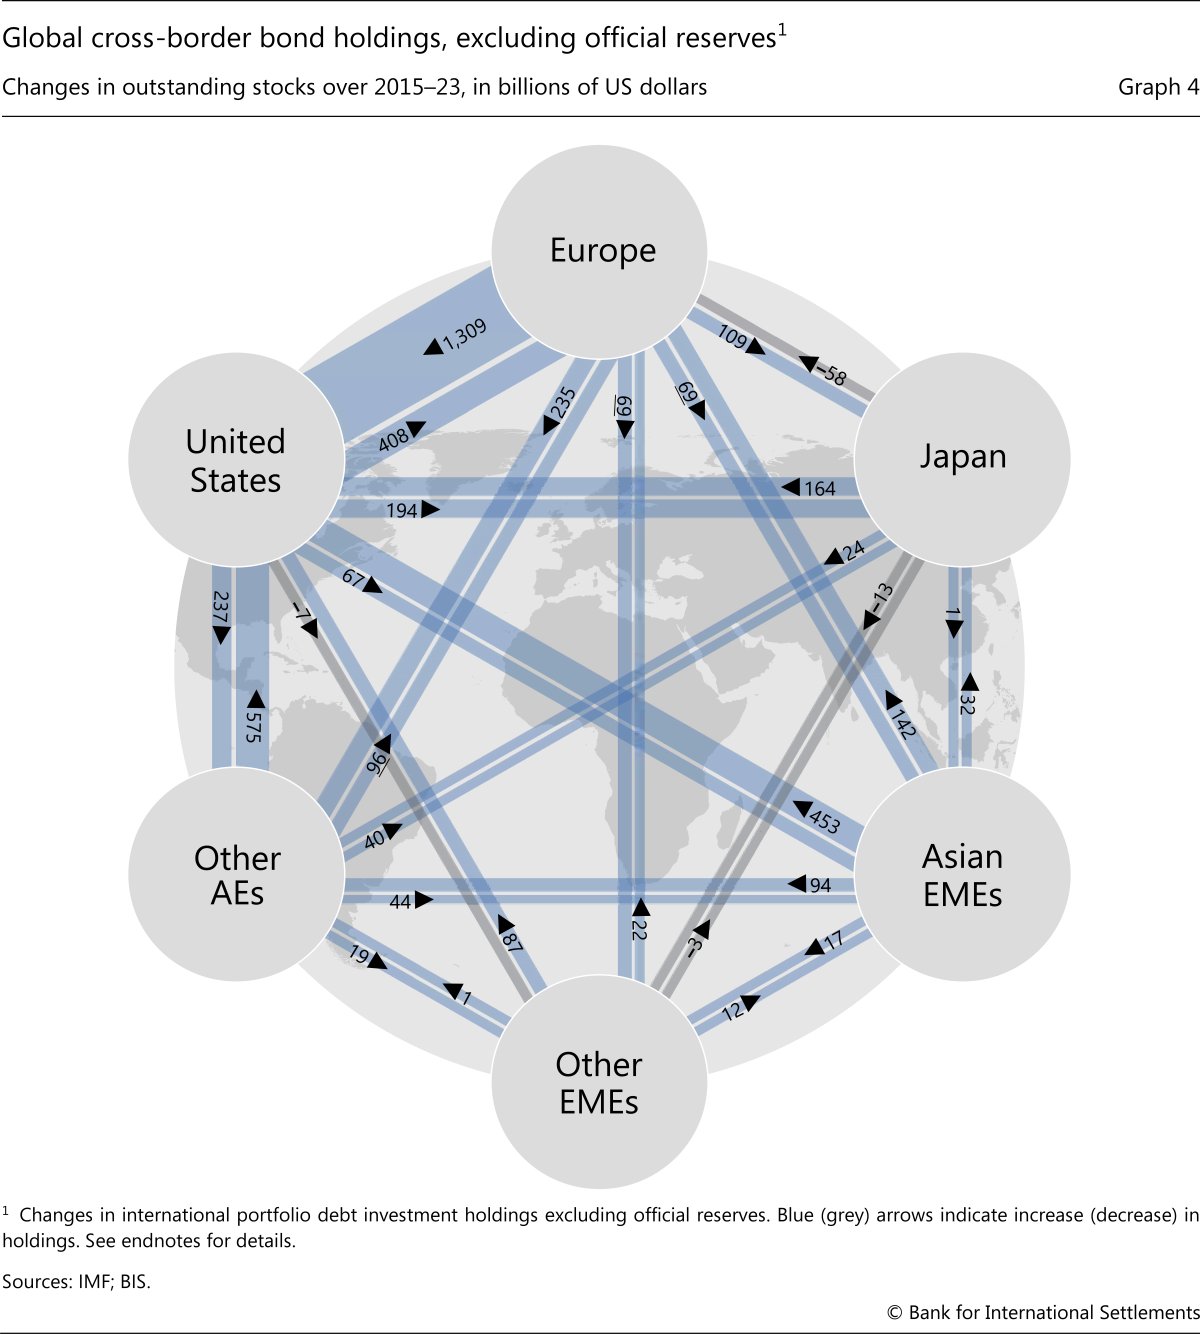
Global cross-border bond holdings, excluding official reserves |
| Graph 5 |
FX swaps |
| Graph A1 |
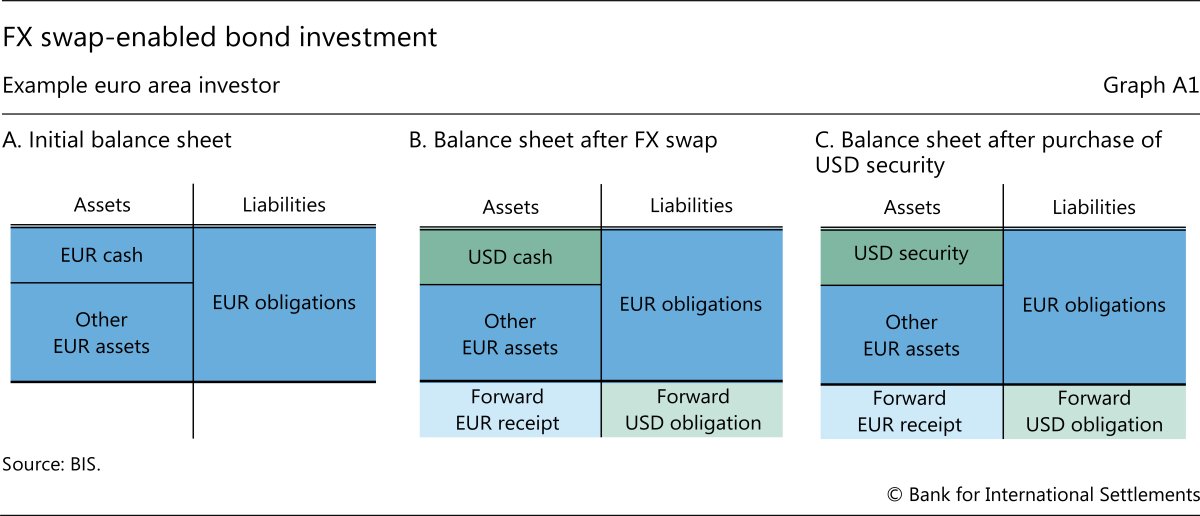
FX swap-enabled bond investment |
| Table A1 |
Hedging-related determinants of OFIs' FX swaps outstanding |
| Graph 6 |
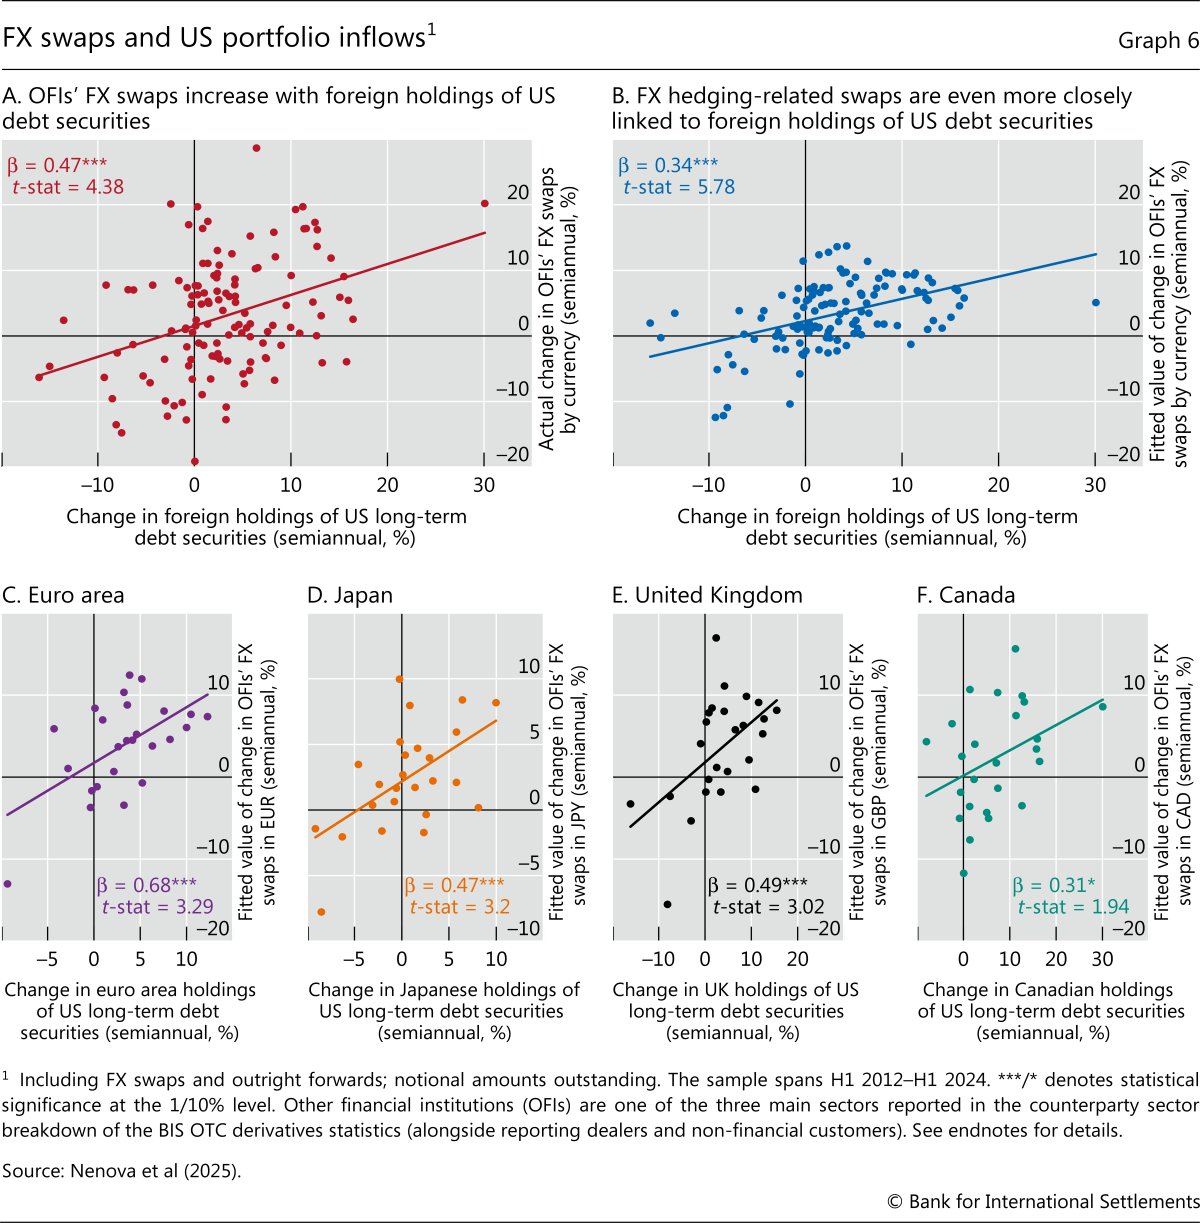
FX swaps and US portfolio inflows |
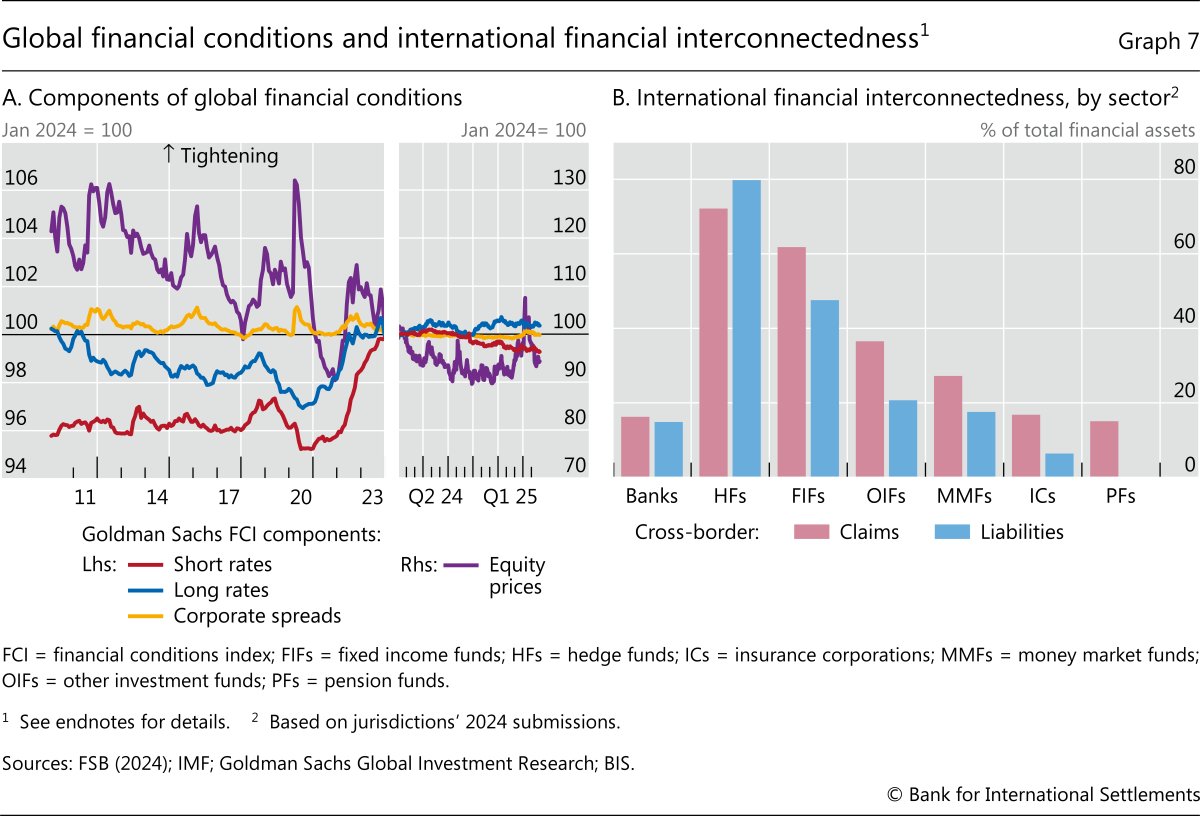
| Graph 7 |
Global financial conditions and international financial interconnectedness |
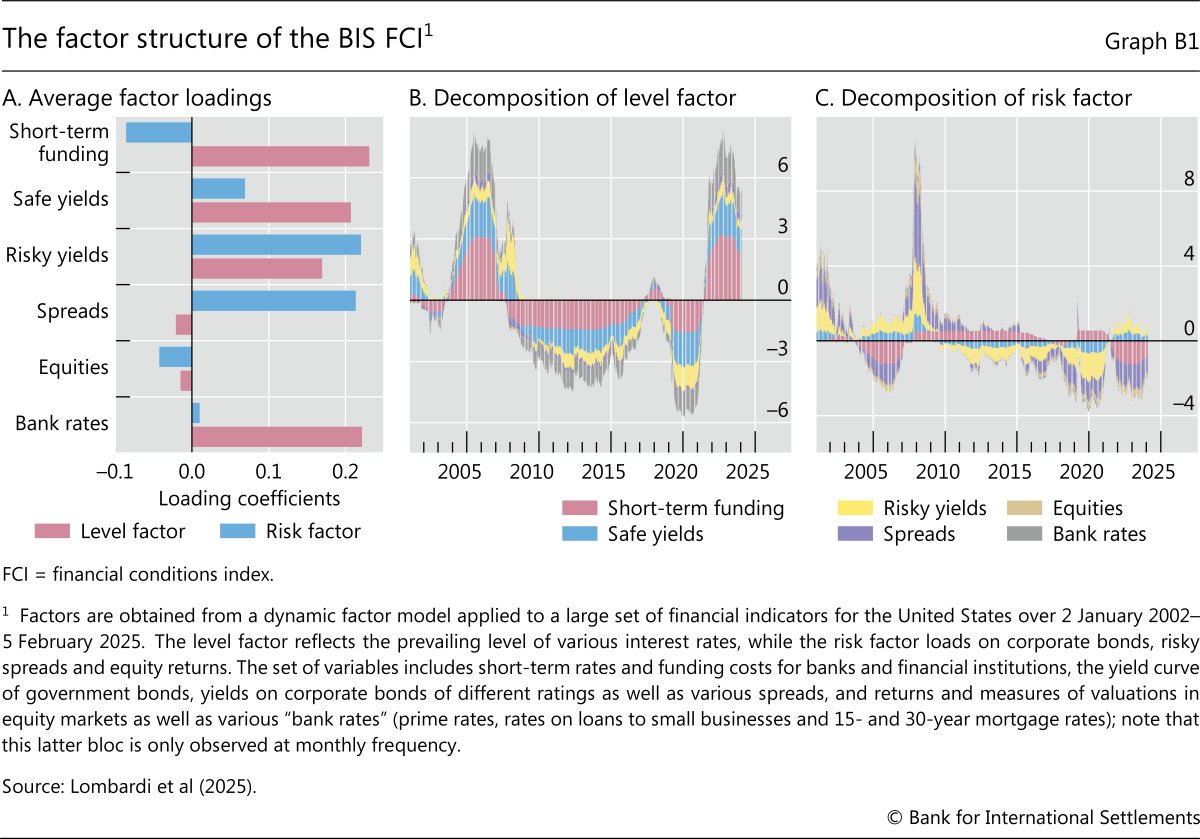
| Graph B1 |
The factor structure of the BIS FCI |
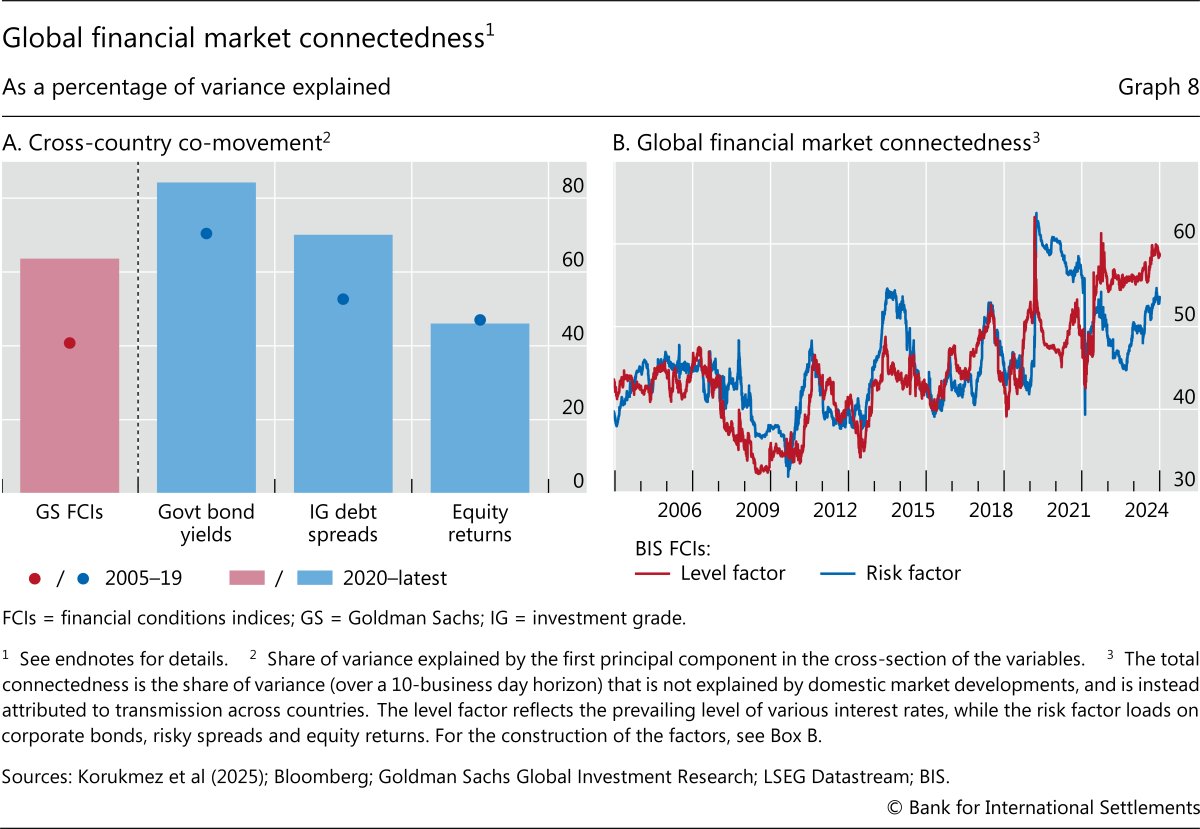
| Graph 8 |
Global financial market connectedness |
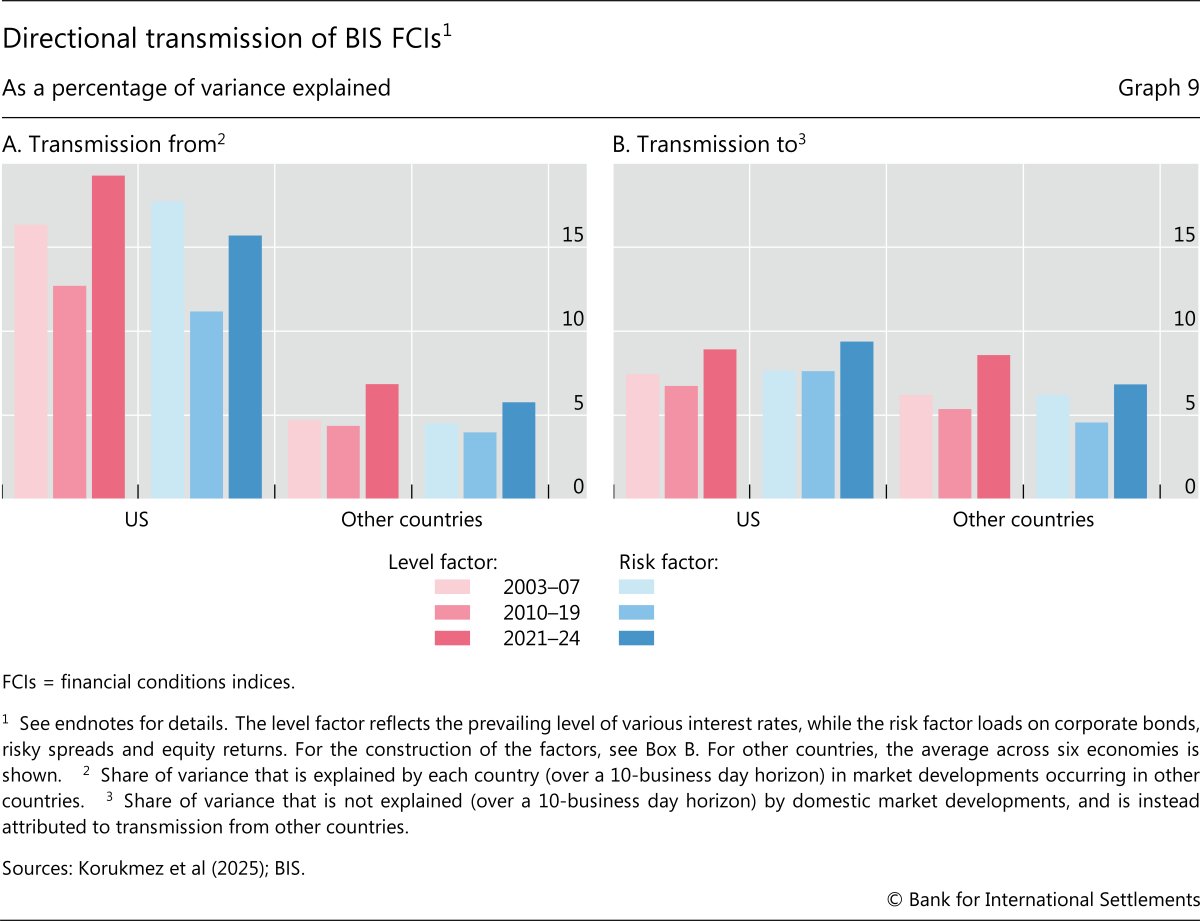
| Graph 9 |
Directional transmission of BIS FCIs |
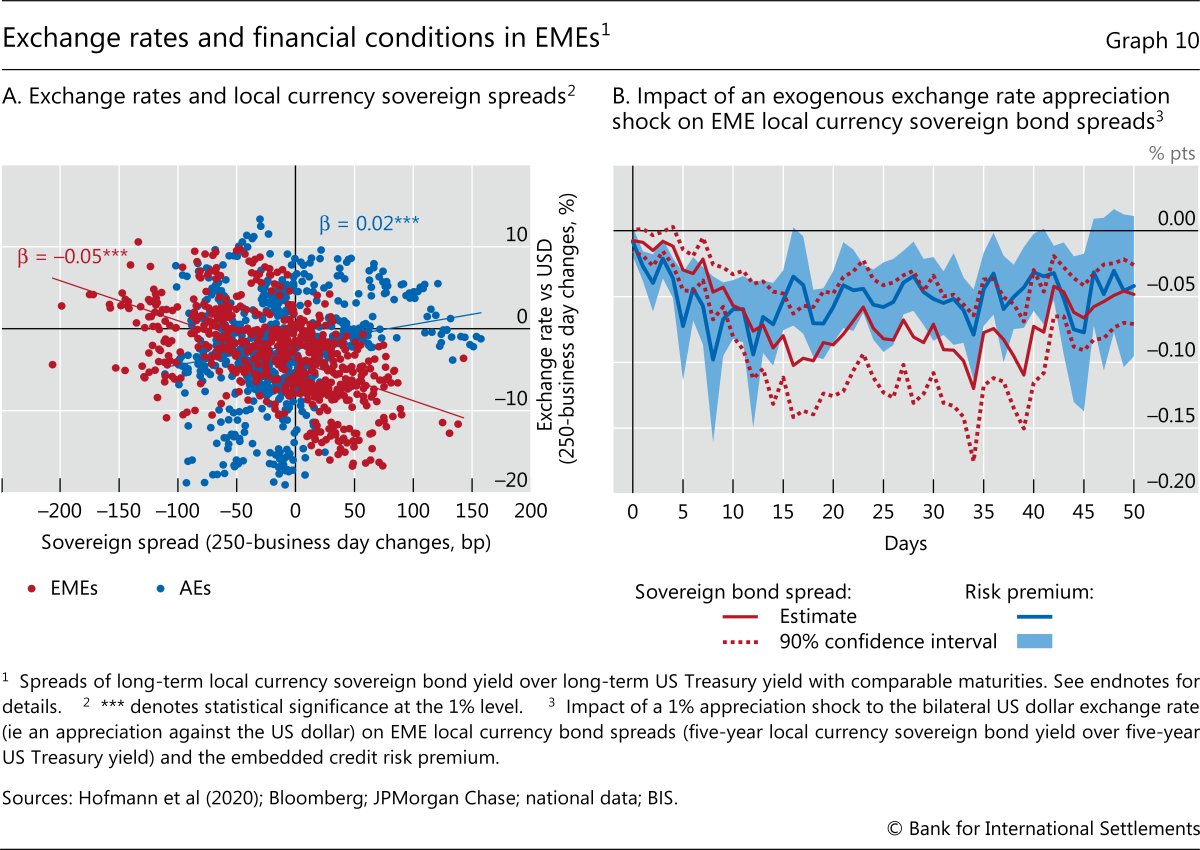
| Graph 10 |
Exchange rates and financial conditions in EMEs |
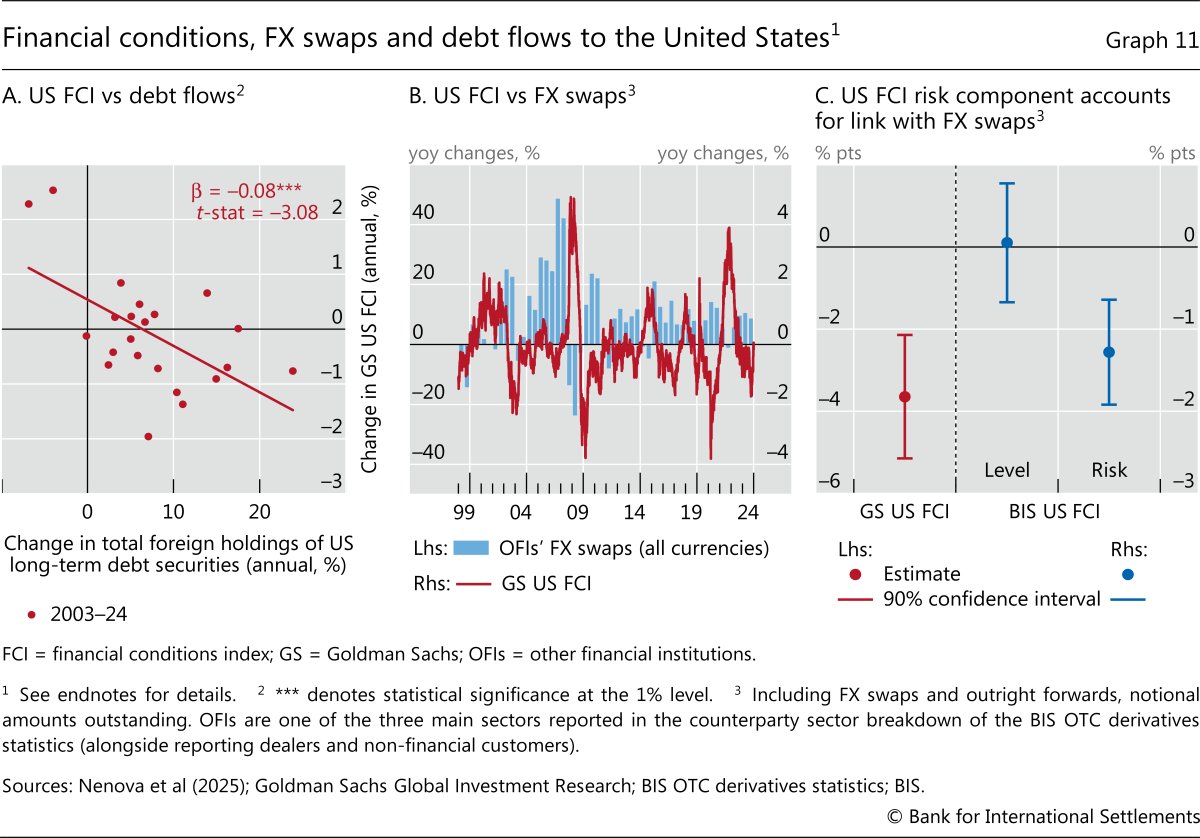
| Graph 11 |
Financial conditions, FX swaps and debt flows to the United States |
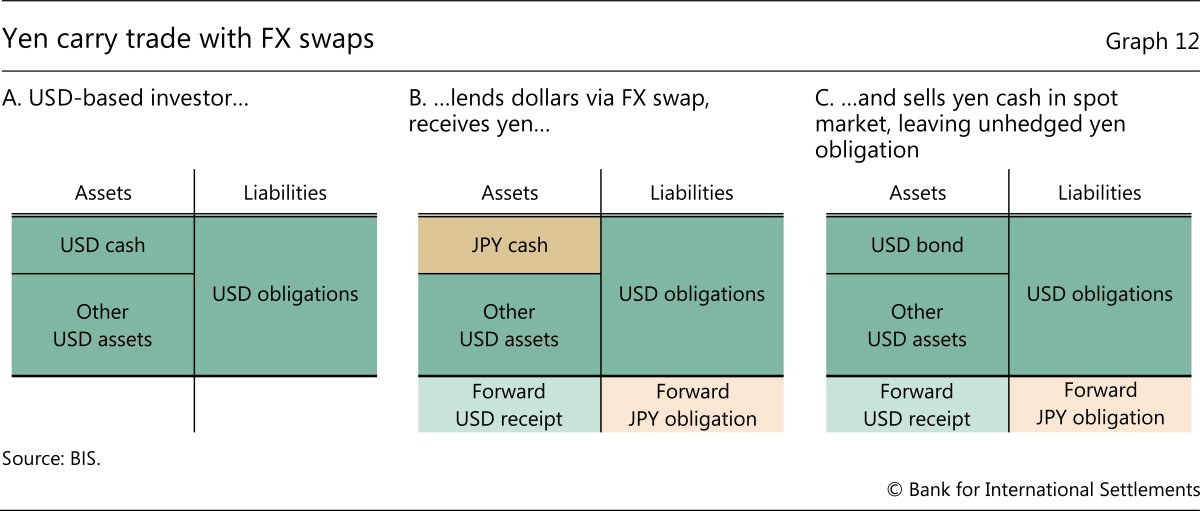
| Graph 12 |
Yen carry trade with FX swaps |
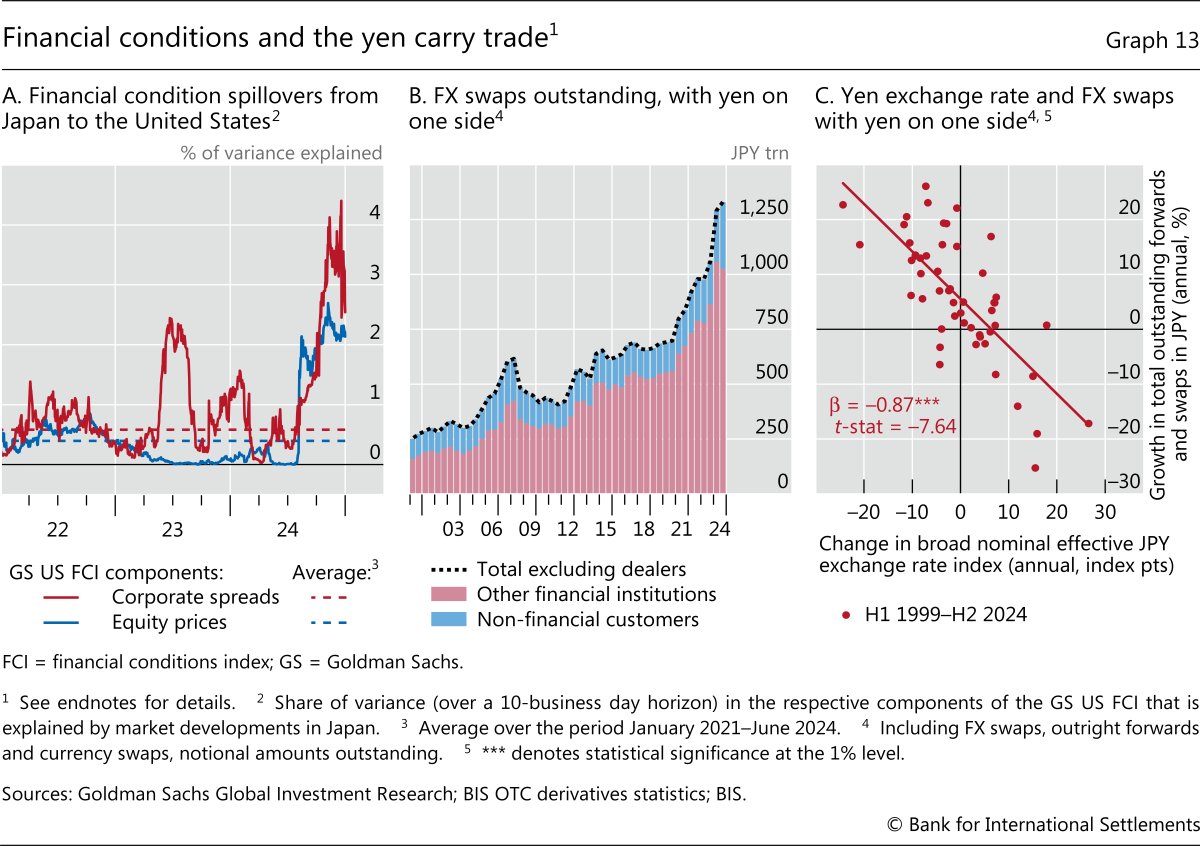
| Graph 13 |
Financial conditions and the yen carry trade |
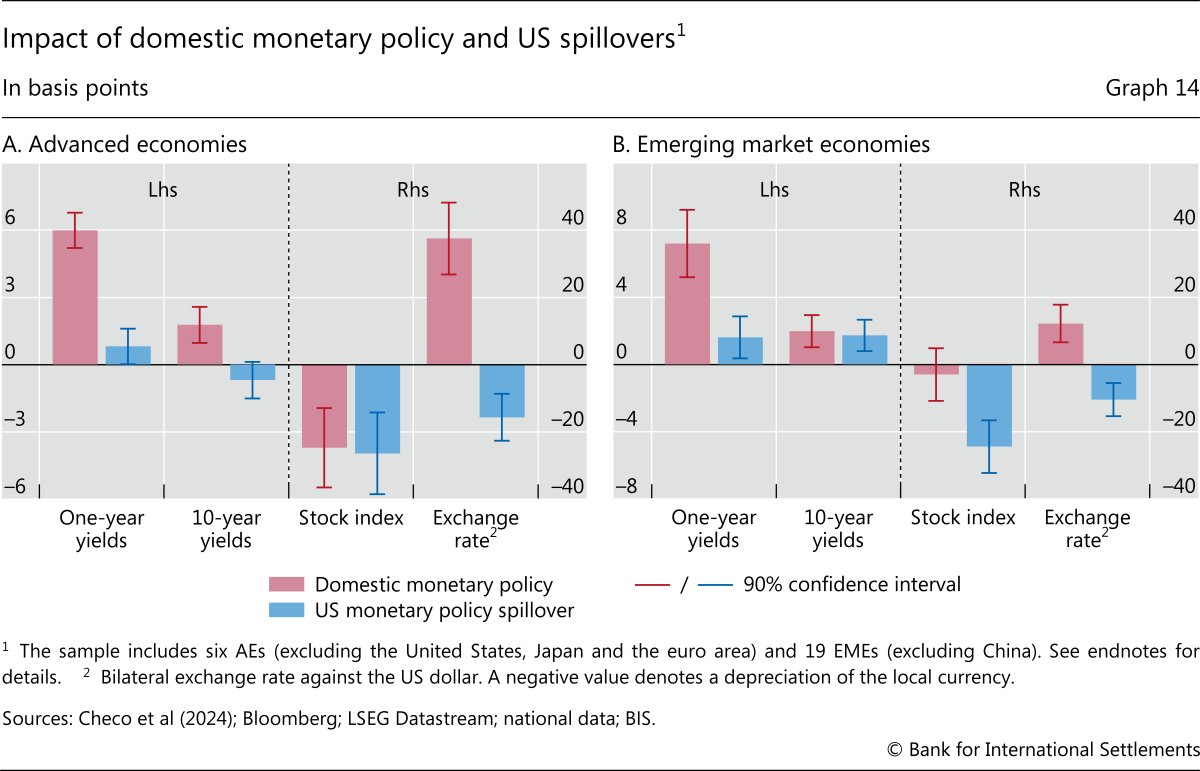
| Graph 14 |
Impact of domestic monetary policy and US spillovers |
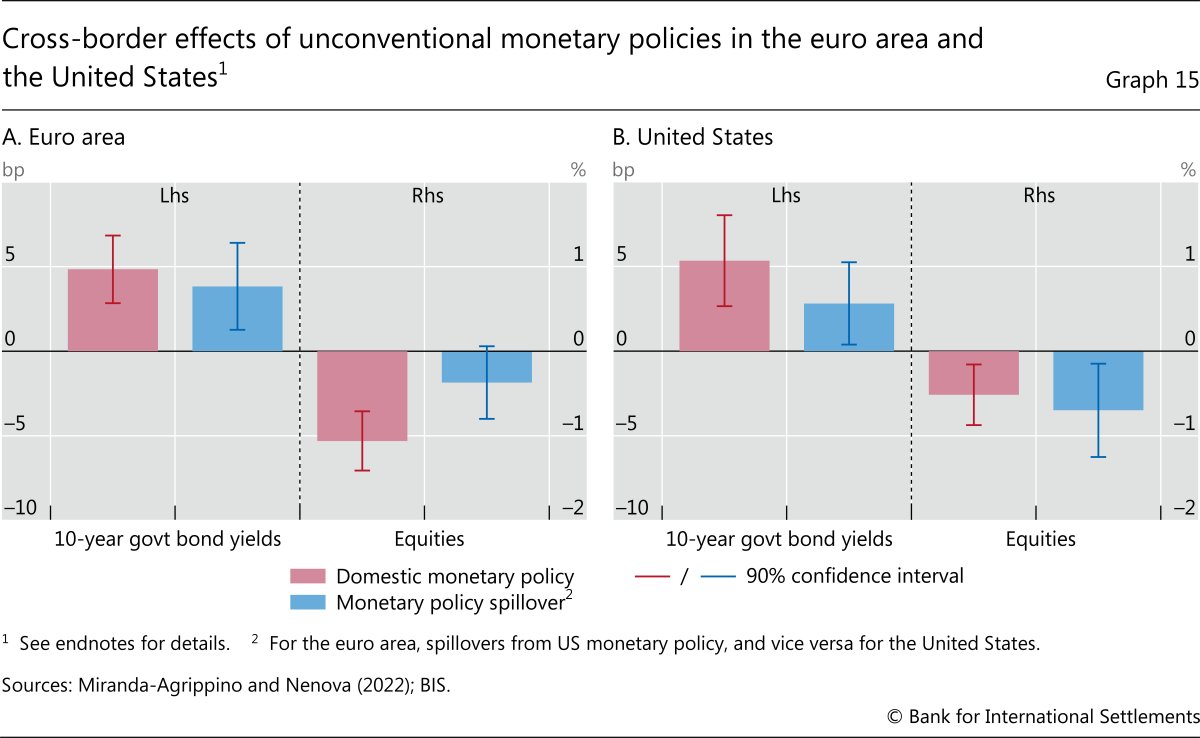
| Graph 15 |
Cross-border effects of unconventional monetary policies in the euro area and the United States |
Chapter III: The next-generation monetary and financial system - read the chapter
|
| Data set |
| Chapter III data set (xlsx) |
| Images |
Title |
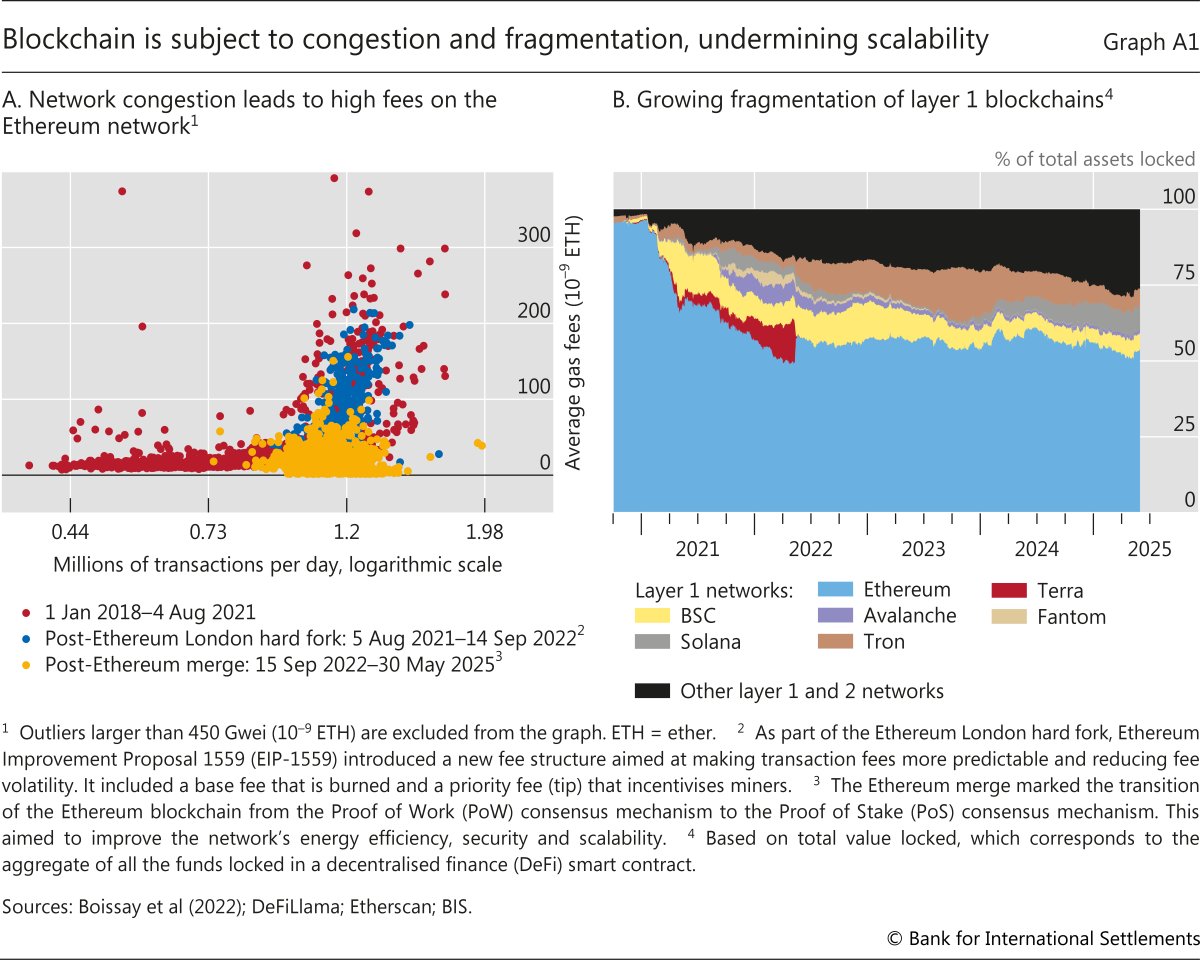
| Graph A1 |
Blockchain is subject to congestion and fragmentation, undermining scalability |
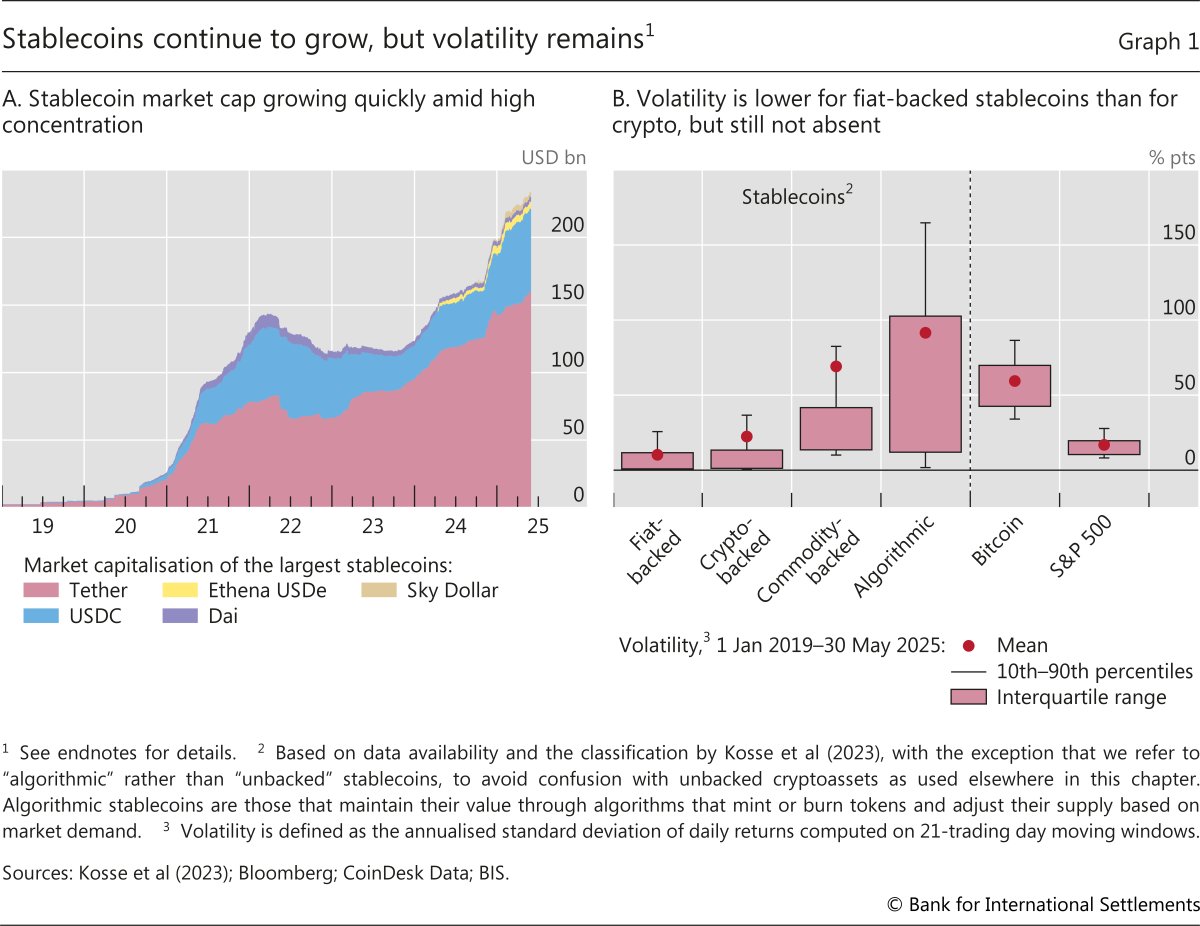
| Graph 1 |
Stablecoins continue to grow, but volatility remains |
| Graph 2 |
Cross-border use of stablecoins has been rising, reflecting a mix of drivers |
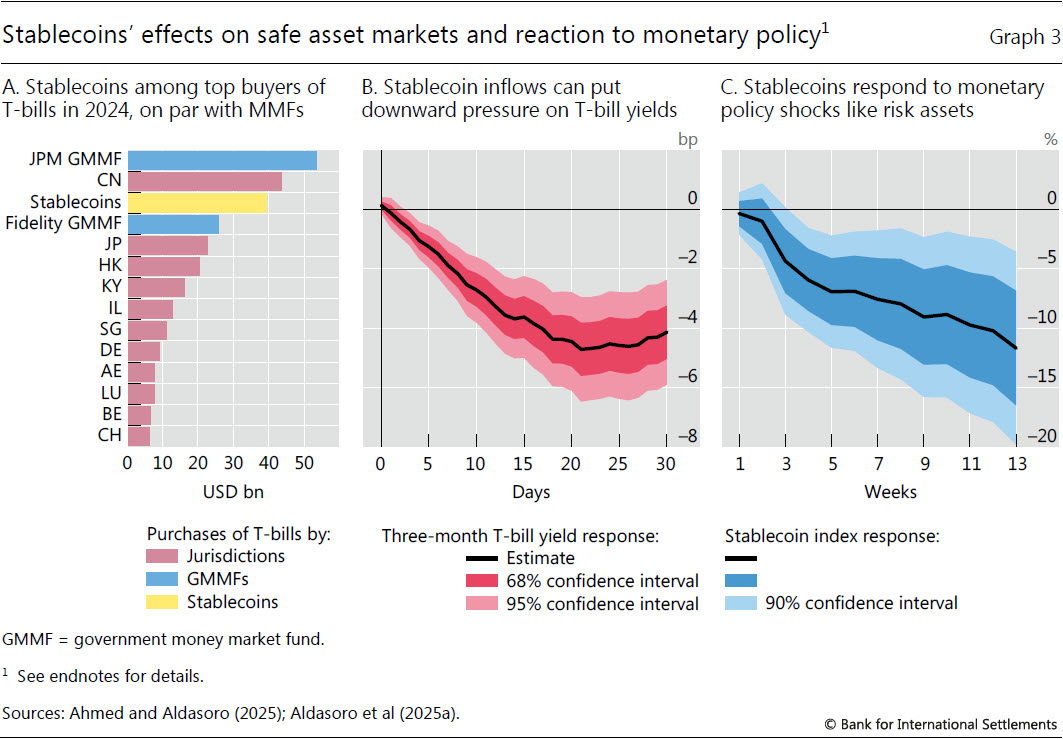
| Graph 3 |
Stablecoins' effects on safe asset markets and reaction to monetary policy |
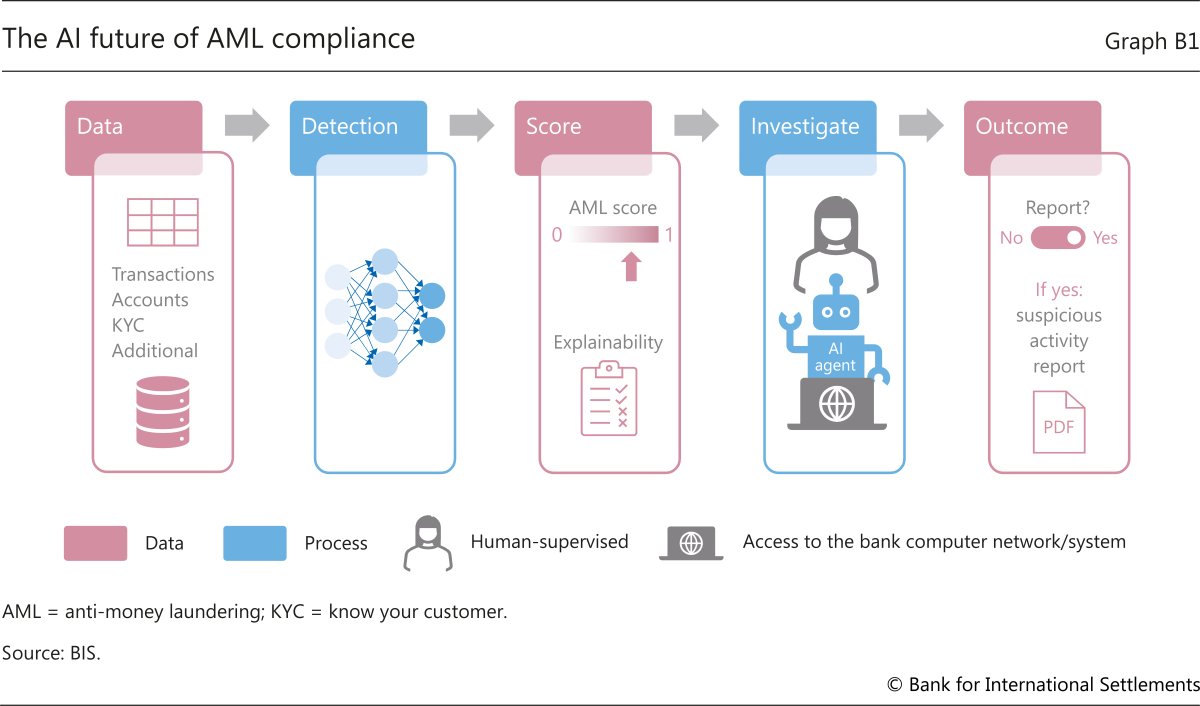
| Graph B1 |
The AI future of AML compliance |
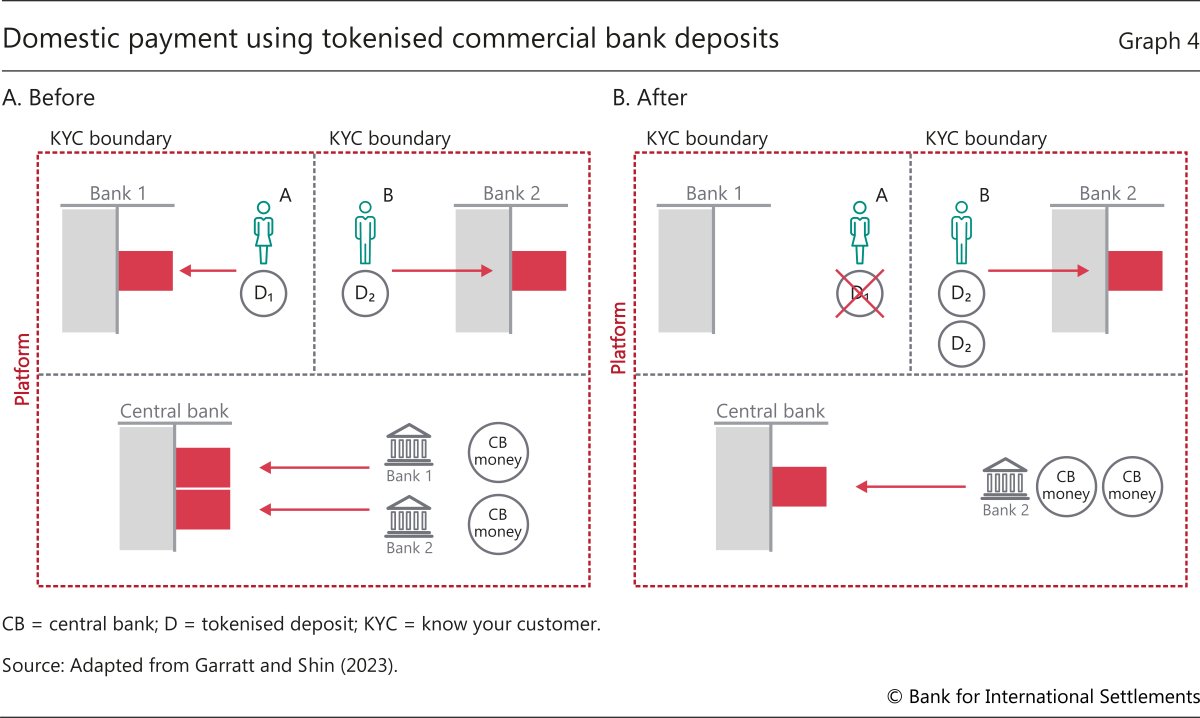
| Graph 4 |
Domestic payment using tokenised commercial bank deposits |
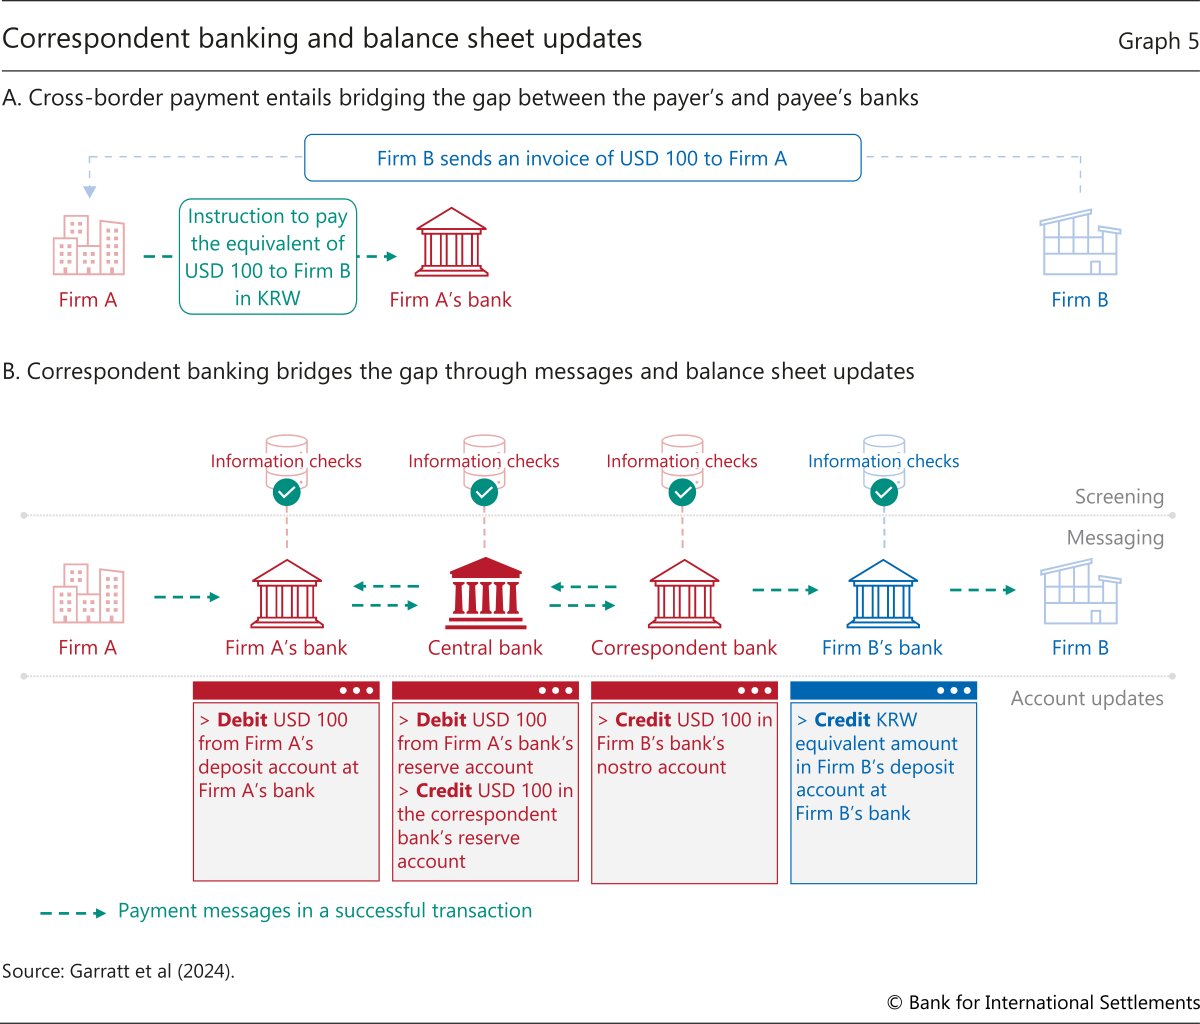
| Graph 5 |
Correspondent banking and balance sheet updates |
| Graph 6 |
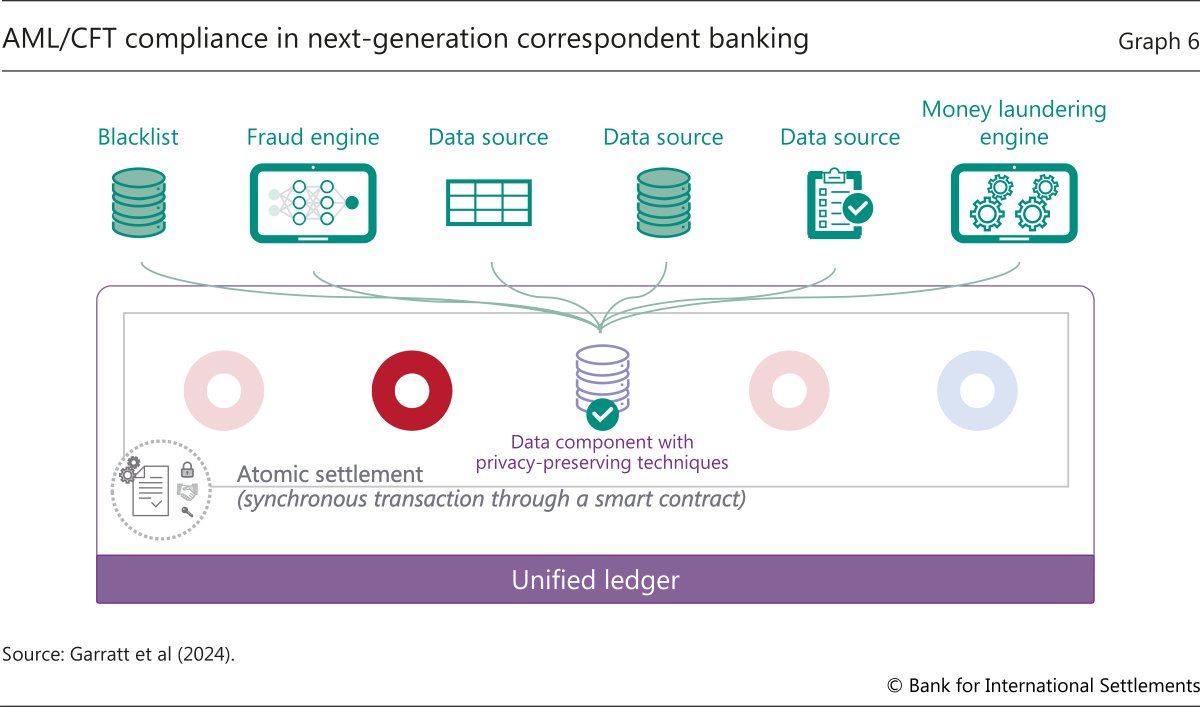
AML/CFT compliance in next-generation correspondent banking |
| Graph C1 |
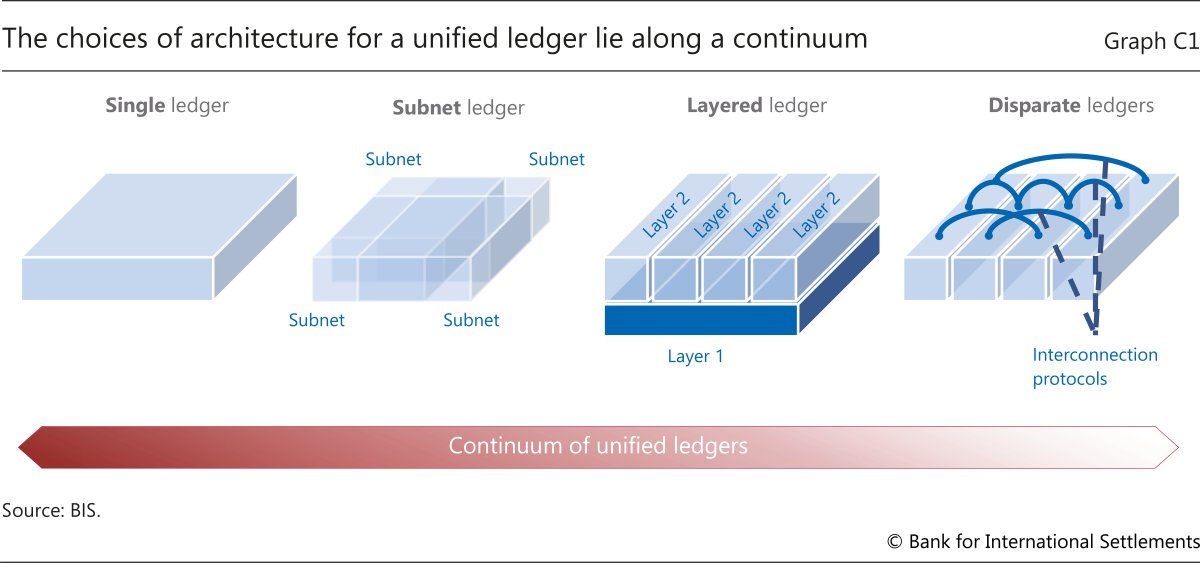
The choices of architecture for a unified ledger lie along a continuum |
| Graph 7 |
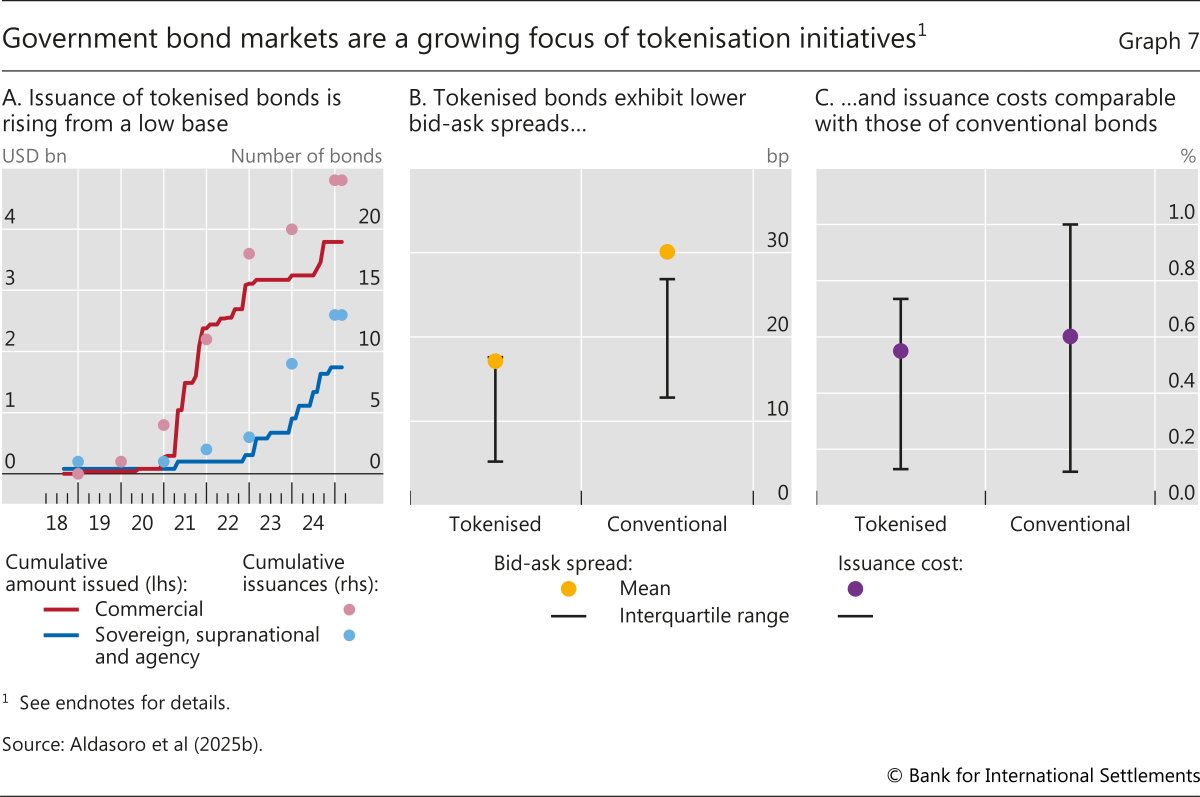
Government bond markets are a growing focus of tokenisation initiatives |
| Graph 8 |
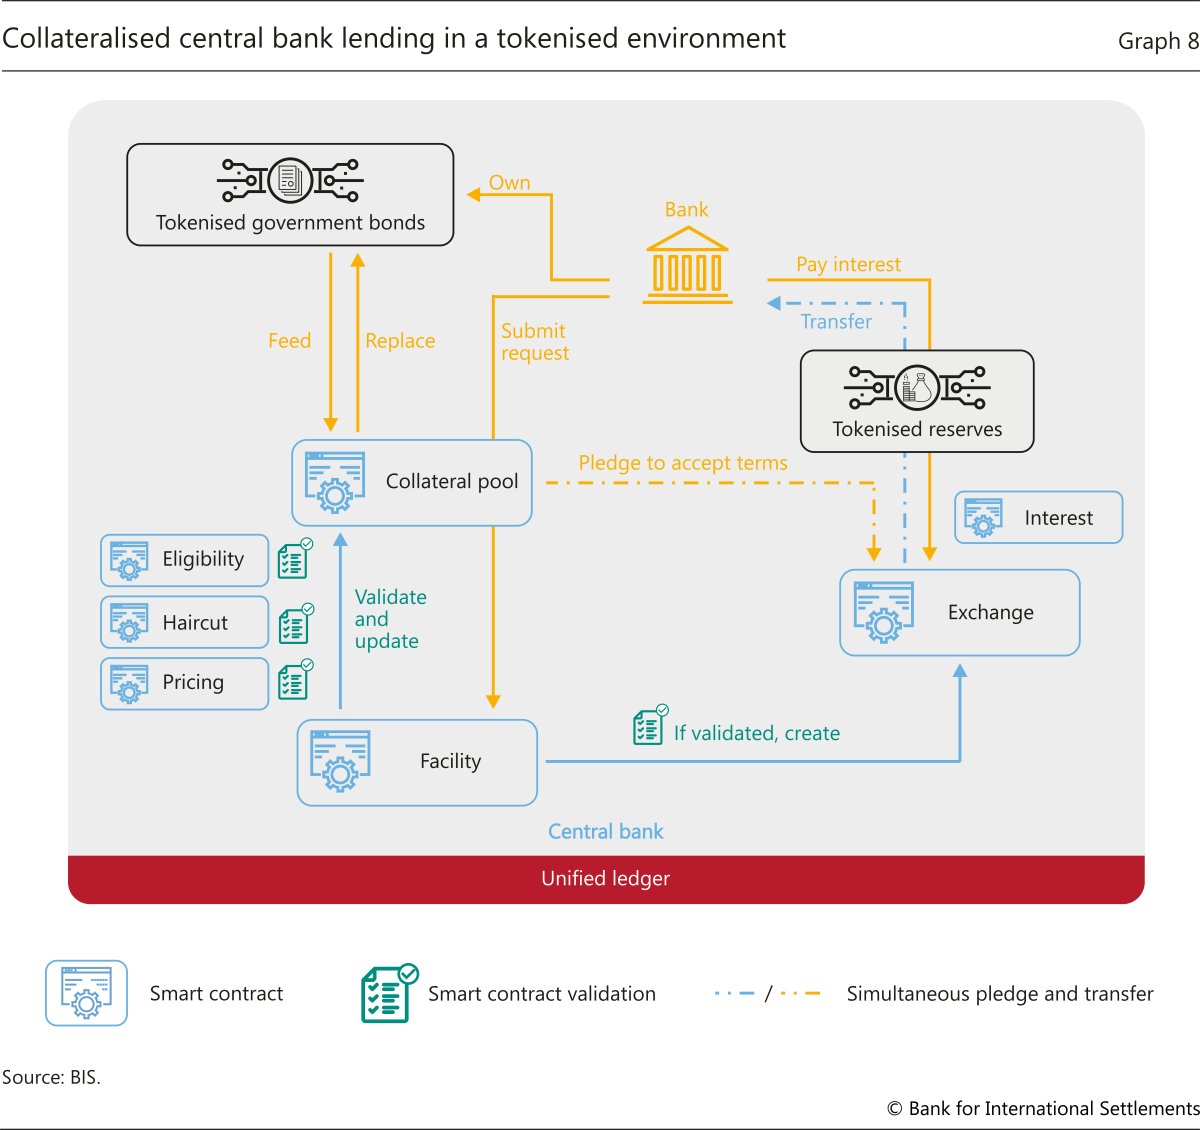
Collateralised central bank lending in a tokenised environment |