Commonality under pressure: banks and funds

We study the joint evolution of financial strain at banks and investment funds. When market pressure on banks intensifies from an elevated level, net flows decline at open-ended corporate bond mutual funds (MFs), corporate bond exchange-traded funds (ETFs) and prime money market funds alike. This commonality has risen materially over time for all three fund types. That said, bond ETFs can be a stabilising force, as salient features of their business model help attract investor inflows in times of stress. By contrast, outflows from bond MFs tend to contribute to a tightening of market conditions when banks are already under pressure.1
JEL classification: G21, G22, G23
Over the past two decades, the heft of non-bank financial intermediaries (NBFIs) has grown and so has their interdependence with banks. NBFIs provide funding to banks and count on banks to make markets. In addition, NBFIs and banks might have similar investors and may be active in similar asset classes (Acharya et al (2024), Aradillas Fernandez et al (2024)). This interdependence has an international dimension (Aldasoro et al (2020)).
We study a specific channel through which bank-NBFI interdependence may affect financial stability. In particular, we seek to shed light on whether strain at investment funds tends to contribute to a tightening of market conditions when market pressure on banks intensifies from an already elevated level. Such joint dynamics would have adverse system-wide effects.
Our analysis relies on readily available data. We use credit default swap (CDS) spreads to identify episodes of low and high market pressure in the banking sector, as well as to capture how pressure evolves within such an episode. In turn, we measure strain in investment funds with net flows relative to assets under management (AUM). We are agnostic as to what drives the joint evolution of bank CDS spreads and net fund flows – that is, establishing causal effects is out of scope.
We focus on prime money market funds (MMFs), corporate bond exchange-traded funds (ETFs) and open-ended corporate bond mutual funds (MFs). Each of these investment fund sectors comprises homogeneous entities, which allows us to conduct the analysis at the fund-type level. In addition, because of liquidity transformation, the funds are vulnerable to investor flows that force fire sales. Such fire sales can be triggered by a common investor base in the fund and banking sectors and can influence the market conditions in which banks operate.
The focus of our analysis is inspired by, but distinct from, the standard one in the literature on systemic risk. In the spirit of the so-called SRISK measure (Acharya et al (2017), Brownlees and Engle (2017)), our main interest is in episodes of high market pressure in the banking sector. We stand apart, however, by not exclusively focusing on extreme stress. The high-pressure episodes in this article also include more benign spells that only hold the potential to affect financial stability. It is during such episodes that liquidity management tools or structural disincentives to investor outflows would make a big difference. Furthermore, whereas the broad-based stress in a financial crisis makes financial intermediaries look alike, the episodes we consider are more likely to reveal any structural heterogeneity across NBFI types.
Key takeaways
- When elevated market pressure in the banking sector intensifies, net flows decline at several investment fund sectors engaging in liquidity transformation. This relationship has strengthened greatly over time.
- In episodes of high market pressure on banks, exchange traded funds specialising in corporate bonds can be a stabilising force, as their business model helps attract investor inflows.
- By contrast, investor outflows from open-ended corporate bond mutual funds may contribute to a tightening of market conditions when banks are already under high pressure.
When market pressure on banks intensifies from a high level, we find the following about investment funds. First, net flows decline at bond MFs, bond ETFs and prime MMFs alike. This commonality with banks has strengthened materially over time. Second, despite their decline, net flows at bond ETFs remain in inflow territory, probably reflecting salient features of these funds' business model that attract investors at times of stress. Third, by contrast, the bond MF sector faces material investor outflows, similar in magnitude to those experienced during the initial phase of the Covid-19 pandemic. A key driver of this finding is the behaviour of bond MFs that face outflows with initially low cash buffers – such funds respond by hoarding cash. Since cash hoarding is the flip side of illiquid asset sales, bond MFs tend to tighten market conditions at an unfavourable time for banks.
This article proceeds as follows. The first section discusses the growth of the three investment fund sectors and their interdependence with banks. The second describes our empirical approach. The third studies the joint evolution of fund flows and market pressure in the banking sector. The fourth section and an accompanying box analyse the economic significance of this evolution. The final section concludes.
Systemic relevance of investment funds
The past 20 years have witnessed strong growth of NBFIs and of investment funds in particular. While the banking sector grew threefold from 2002 to 2023, reaching $189 trillion in total assets, NBFIs roughly quadrupled over the same period, reaching $239 trillion in assets (FSB (2024)). Among NBFIs, bond and money market funds – including the corporate bond ETFs, open-ended corporate bond MFs and prime MMFs that this article focuses on – grew nearly fivefold as a group, from $11 trillion to $52 trillion.2 They are currently by far the largest component of NBFIs involved in bank-like activities.
NBFIs and banks – direct and indirect links
As NBFIs grew, they became increasingly intertwined with banks. This is a key conclusion of Acharya et al (2024), who gauge the contribution of banks and NBFIs to systemic risk by studying the evolution of their stock returns in times of extreme stress. The increased interdependence has an international dimension, as cross-border links between banks and NBFIs – notably investment funds – rose by more than 60% between 2015 and 2020 (Aldasoro et al (2020), FSB (2024)).
Some of the links between the three investment fund types we study and banks relate to debt funding. MMFs hold bank commercial paper and certificates of deposit, and ETFs and MFs invest in bonds issued by banks. Focusing on European entities, Franceschi et al (2023) find that MMFs hold about 40% of bank debt with maturities shorter than six months, whereas MFs account for 10% of such debt with maturities longer than three years. In the United States, MMFs are a key source of dollar funding for non-US banks (Aldasoro et al (2020), Aldasoro, Balke, Barth and Eren (2022)).3 The funding links also go in the other direction. Banks provide investment funds – as well as other NBFIs – with short-term loans and credit lines. And in times of stress, funds rely on repo borrowing from banks (Bank of England (2024)).
Other links stem from shared ownership, market making activity and common asset exposures. For one, fund managers rely on support from banks belonging to the same holding company (Bagattini et al (2023)). In addition, prime MMFs typically interact with one bank dealer and rely on this dealer if they need to sell any of their illiquid assets (Novick et al (2020), FSB (2021)). Furthermore, corporate bond ETFs, corporate bond MFs and prime MMFs trade and invest in similar assets as banks. Consistent with these funds' capacity to influence conditions in markets where banks operate, Cetorelli et al (2023) find that bond funds play the largest role among NBFIs in the propagation of price shocks that ultimately hit bank capital.
A common investor base can create important indirect links between banks and funds. For instance, US data reveal that the "real" sector – which includes households and non-financial businesses – held approximately 60% of banks' liabilities as well as between 60 and 80% of MFs' and MMFs' shares in 2023.4 A retrenchment by these investors from both banks and investment funds would have systemic consequences. Relatedly, Acharya and Rajan (2024) highlight that, while the large post-Great Financial Crisis (GFC) expansion in the Federal Reserve's balance sheets generated flighty claims on commercial banks, these claims did not decline with the subsequent balance sheet contraction. Flush with liquidity, the holders of these claims are also likely to seek exposure to investment funds for a yield pickup.
Investors' behaviour in times of stress – differences across fund types
When investment flows force funds to sell illiquid assets, they contribute to a tightening of market conditions. The systemic effects of such fire sales are stronger if they coincide with elevated market pressure elsewhere in the financial system.
The potential for disruptive fire sales in a risk-off environment is a feature of the fund types we study because they all engage in pronounced liquidity transformation.5 Prime MMFs promise same day liquidity to their investors, and redemptions at bond MFs and ETFs are typically executed one day after investors request them. At the same time, the assets in these funds' portfolios trade in illiquid secondary markets.
That said, there are important differences across these fund types. The exposures of prime MMFs are of shorter maturity and typically to higher-quality borrowers than those of bond MFs or bond ETFs. Thus, prime MMFs may actually benefit from a flight to liquidity when investors' risk appetite declines. Of course, in systemic events such as the GFC and the pandemic-related crisis – when investors sought refuge in government MMFs – the prime MMF sector may be at the epicentre of the stress.
In turn, the business model of bond ETFs is less prone to destabilising dynamics. Authorised participants (APs) – the only entities that can create or redeem ETF shares in primary markets – and bargain hunting end investors step in to put a lid on discrepancies between the share price of the actively traded bond ETFs and the value of the underlying illiquid portfolio (Aquilina et al (2023), Aramonte and Avalos (2020), Gorbatikov and Sikorskaya (2022)). Such stabilising behaviour is viable because of bond ETF design features that reduce the risk of runs. For one, because there is a small number of APs in each ETF, they take into account the adverse price impact that redemptions would have on their holdings. Furthermore – in contrast to MFs – it is standard practice to redeem bond ETF shares in exchange for securities, rather than cash. This in-kind redemption allows ETF sponsors to strategically choose the composition of "redemption baskets" in stress, so that the attractiveness of redemptions declines (Todorov (2021), Shim and Todorov (2021)). All this mitigates the likelihood that – in a risk-off environment – outflows from bond ETFs would necessitate fire sales.
Empirical approach
We now describe our empirical approach to studying the joint evolution of strain in the banking and investment fund sectors. In the first subsection, we describe how we identify episodes of high market pressure on banks. In the second subsection, we explain how we measure sector-level strain within such an episode.
Market pressure in the banking sector
We use CDS spreads to differentiate between low and high market pressure in the banking sector. These spreads capture the premium that creditors demand for their exposure to an entity. Accordingly, they have been used as indicators of banking sector stress (Avino et al (2019), Knaup and Wagner (2012), Indergand et al (2022)).6
We define high market pressure in the banking sector as sustained increases in CDS spreads relative to a threshold. Specifically, we work with almost 20 years of monthly data with global coverage: 53 large banks from 15 jurisdictions. We study two subperiods – from January 2006 to December 2013 and from January 2014 to August 2024. Within each subperiod, "high-pressure" episodes include months that witness the top 10% of four-month changes in the median CDS spread (Graph 1, shaded areas).7 The remaining months are "low pressure".
We chose the two subperiods and the definition of high market pressure for a number of reasons. First, the earlier subperiod roughly coincides with strong growth in the overall NBFI sector, whereas the size of this sector is stable at a high level during the later subperiod (FSB (2024)). Second, the high-pressure episodes capture well known systemic events, such as the GFC (2008–09), part of the European sovereign debt crisis (2010–12) and the initial fallout of the Covid-19 shock (2020). Third, the number and length of high-pressure episodes are roughly the same in the two subperiods. Fourth, by featuring only sustained increases in CDS spreads, high-pressure episodes indicate increases in banks' funding costs. By contrast, if CDS spreads spike abruptly and then quickly revert to low levels, banks would be able to reduce the attendant impact on their funding expenses by slightly delaying some of their new debt issuance. This is why, for instance, the severe but very short-lived banking stress in March–April 2023 is not among the high-pressure episodes.
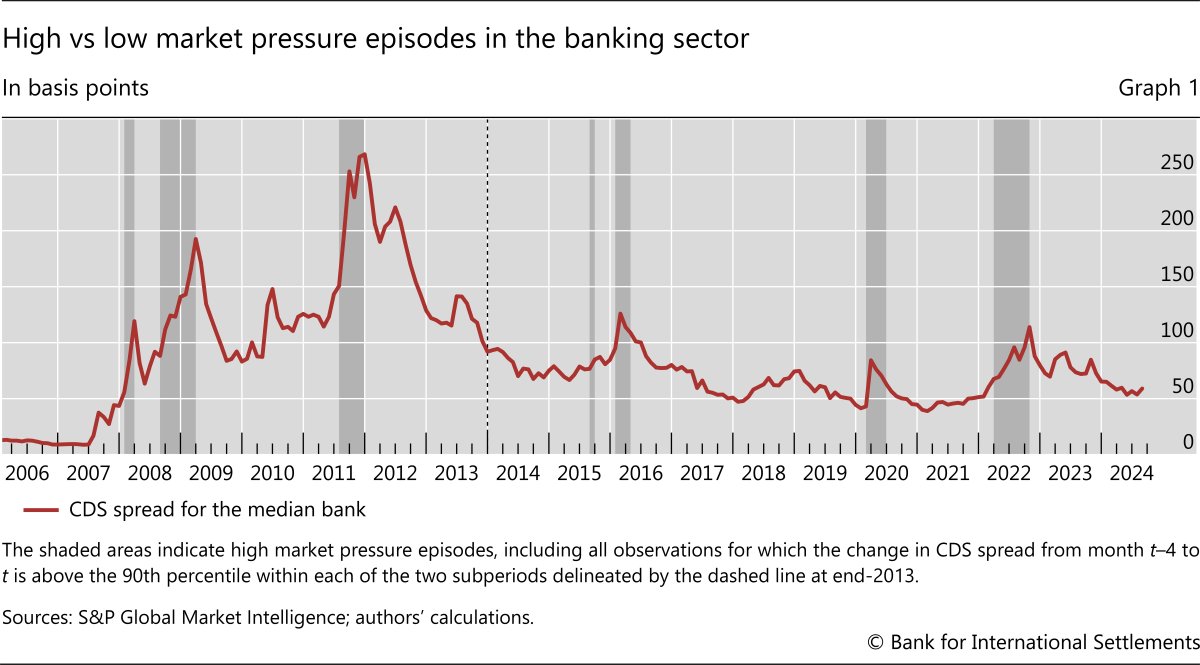
Ultimately, the high-pressure episodes in Graph 1 are not confined to systemic events. Such events affect a critical mass of financial entities and have macroeconomic repercussions – they are thus "deep in the tail". In addition, we include episodes of banking sector fragility that could have evolved into a crisis but did not.8 The latter episodes could be a result of banks succeeding in overcoming their difficulties and reassuring markets, the public sector coming to the rescue (implicitly or explicitly) or NBFIs acting in a way that mitigates the pressure on banks. Below, we shed light on the relevance of the latter explanation for specific fund types.
Strain at investment funds and banks
When we condition on low or high market pressure episodes in the banking sector (per Graph 1), we track the evolution of strain in this sector as well as that in the three investment fund types. We say that strain in the banking sector increases when the median CDS spread rises month to month – that is, when market pressure in the banking sector intensifies (from either low or high levels). In turn, strain in a fund sector increases when there is a decline in net investor flows – defined as inflows minus outflows. We focus on sector-level strain, ie the aggregate net flow across all constituent entities over a month, divided by aggregate AUM at the beginning of the same month.
We work with monthly data on open-ended bond MFs, bond ETFs and prime MMFs from January 2006 to August 2024.9 Seeking to include a representative set of entities that hold global asset portfolios, we draw from the top 500 funds worldwide by AUM within each of the first two sectors. In a slight departure from this principle, we draw only from the top 500 US-domiciled prime MMFs, as the identification of similar MMFs domiciled elsewhere is not clear-cut. Our sample covers about 50% of bond MFs', 70% of bond ETFs' and nearly two thirds of US-domiciled MMFs' total AUM as of December 2005. The findings below are robust to separately studying funds domiciled in specific jurisdictions.
Fund flows and market pressure on banks
We first measure the commonality of strain at investment funds and banks. Then we look into whether net fund inflows or outflows underpin this commonality.
Commonality of strain at investment funds and banks
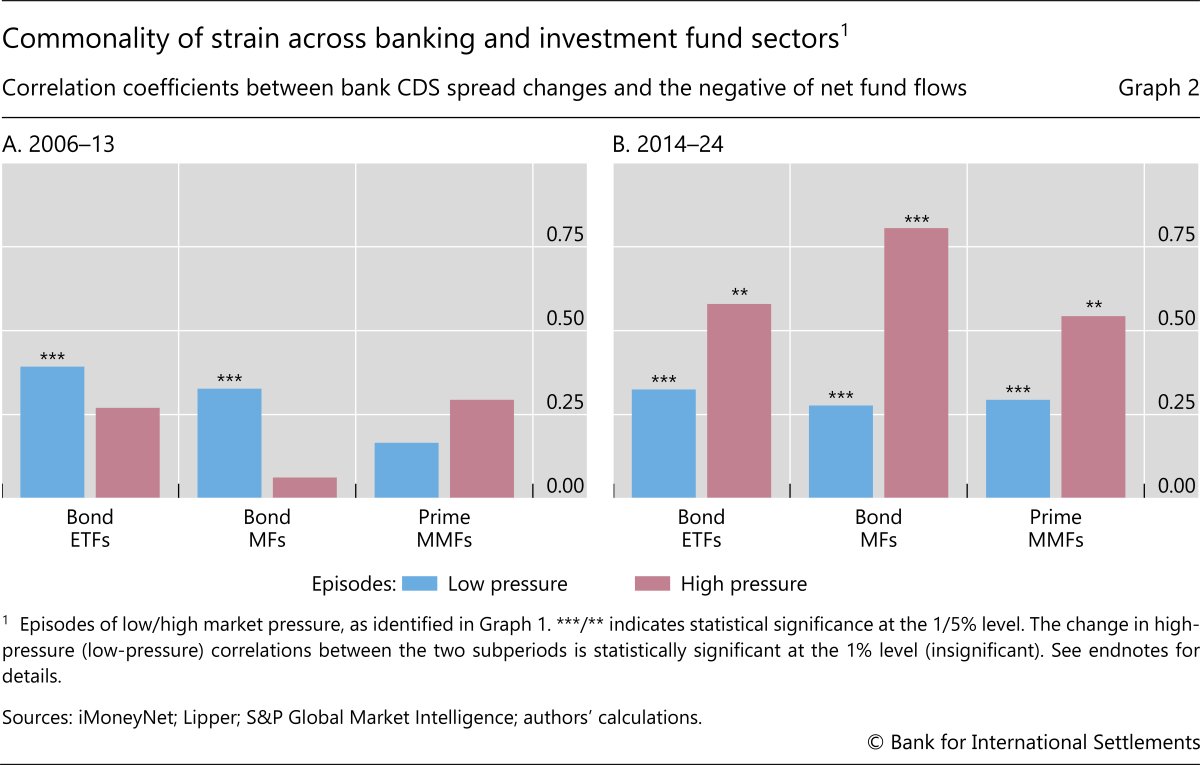
Strain commonality with the banking sector evolved similarly across investment fund sectors, increasing materially from the earlier to the later subperiod only within episodes of high market pressure.10,11 We see this by comparing bars of the same colour across the panels in Graph 2, where we calculate the correlation between CDS spread changes and the negative of net fund flows – thus, a higher correlation implies stronger commonality. While the correlations were below 30% (and statistically insignificant) in high-pressure episodes during the earlier subperiod, they rose to above 50% (and became statistically significant) in the later subperiod. By contrast, the corresponding correlations in low-pressure episodes barely moved (blue bars). The phenomenon is starkest in the bond MF sector, in which the low-pressure correlation declined slightly but the high-pressure correlation shot up from effectively zero to about 80%.
The correlations in the later subperiod (Graph 2.B) are consistent with investors perceiving that the similarity between bank and fund sectors rises in high-pressure episodes. When market pressure is low, a common investor base would exploit diversification benefits by rebalancing its positions across sectors. In such episodes, there is thus a relatively high likelihood that, for example, an increase in banks' CDS spreads would occur together with fund inflows. By contrast, common risk factors come to the fore in episodes of high market pressure in the banking sector. In such circumstances, investors both demand higher compensation for credit exposure to banks and retrench from investment funds.
For market conditions, it is crucial whether the above correlations reflect the evolution of inflows or outflows. While inflows would not force fire sales of fund assets, outflows may have the opposite effect. For this reason, we next consider the level of investor net flows in episodes of low and high market pressure.
Distribution of fund flows
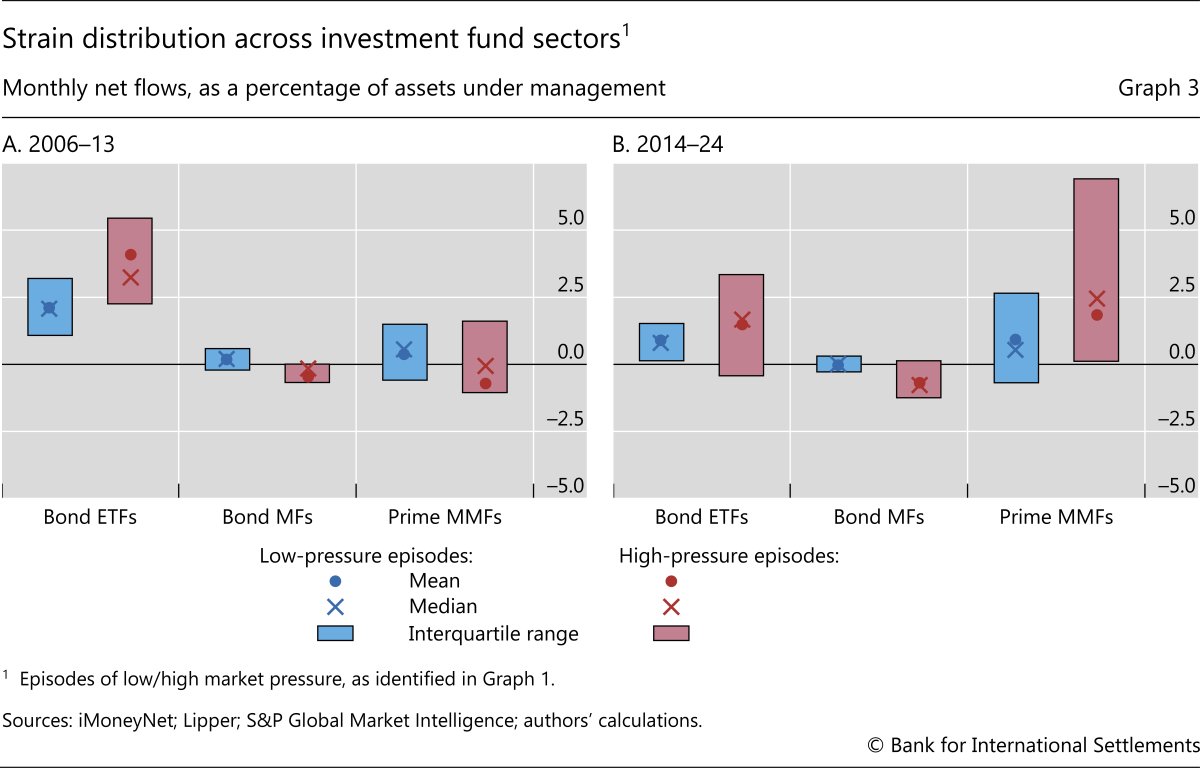
The distribution of net investor flows remains largely similar between the two subperiods but differs markedly across sectors (Graph 3).
The picture is rather benign for bond ETFs and prime MMFs. In each subperiod, bond ETFs tend to face higher net flows – mostly inflows – when banks are under strong market pressure (Graph 3, red vs blue bars). This finding squares with contrarian behaviour by bond ETF investors, supported by these funds' business models (as noted above). The experience of prime MMFs is similar, especially over the later subperiod, probably as a result of the relative safety of these funds' portfolios.
Further reading
The picture is much less benign in the case of bond MFs. Here, higher market pressure on the banking system tends to go together with lower net flows. While inflows and outflows are roughly equally likely in low-pressure episodes, outflows occur 75% of the time in high-pressure episodes. Again, this pattern persisted through both subperiods, consistent with strong incentives for a run to occur on bond MFs in a risk-off episode, as they hold riskier assets than prime MMFs and engage in greater liquidity transformation than bond ETFs.
The heterogeneity of flow distributions across fund types (Graph 3) helps refine the interpretation of the correlation results (Graph 2). In high-pressure episodes in the later subperiod, for instance, an intensification of market pressure in the banking sector tends to go together with declining inflows to bond ETFs and prime MMFs but with rising outflows from bond MFs (Graphs 2.B and 3.B, red bars).
Economic significance of bank-fund commonality
We now study the magnitude by which net fund flows evolve when pressure in the banking sector intensifies. Focusing on one fund sector at a time, we verify whether this relationship differs between episodes of low and high market pressure. In addition, further narrowing our focus to high-pressure episodes, we assess whether asset fire sales are likely to result from net fund flows that tend to go hand in hand with a standard adverse shock to bank CDS spreads. The latter sheds light on the economic significance of bank-fund commonality.
We proceed as follows, focusing on the later subperiod, as it reflects structural features of the financial system that are currently in place. We first estimate the relationship between (de-meaned) changes in the median CDS spreads in the banking sector and net fund flow (NFF) relative to AUM in an investment fund sector.12 We do so separately for low- and high-pressure episodes:

where k stands for bond ETFs, open-ended bond MFs or prime MMFs. Second, focusing on high-pressure episodes, we simulate a "shocked" net flow for each sector by replacing  with its standard deviation and setting εkt to zero.13 As a benchmark for the shocked net flow in fund sector k, we use the maximum net outflow from this sector during the initial three months of the Covid-19 pandemic. These outflows were particularly disruptive, forcing central banks to intervene in order to restore orderly market functioning (Avdjiev et al (2020), Schrimpf et al (2020)).
The regression estimates (Graph 4.A) add to the information about strain commonality that episode-dependent correlations revealed above (Graph 2.B). Consistent with the earlier findings, a higher rise in bank CDS spreads goes hand in hand with a lower net flow at each investment fund sector. However, only for bond MFs is this relationship materially stronger (with marginal statistical significance) in episodes of high pressure than in low-pressure episodes (Graph 4.A, blue vs red bars). Within high-pressure episodes, it is statistically significant only for bond ETFs and bond MFs. We thus focus on these two sectors in the rest of the section.
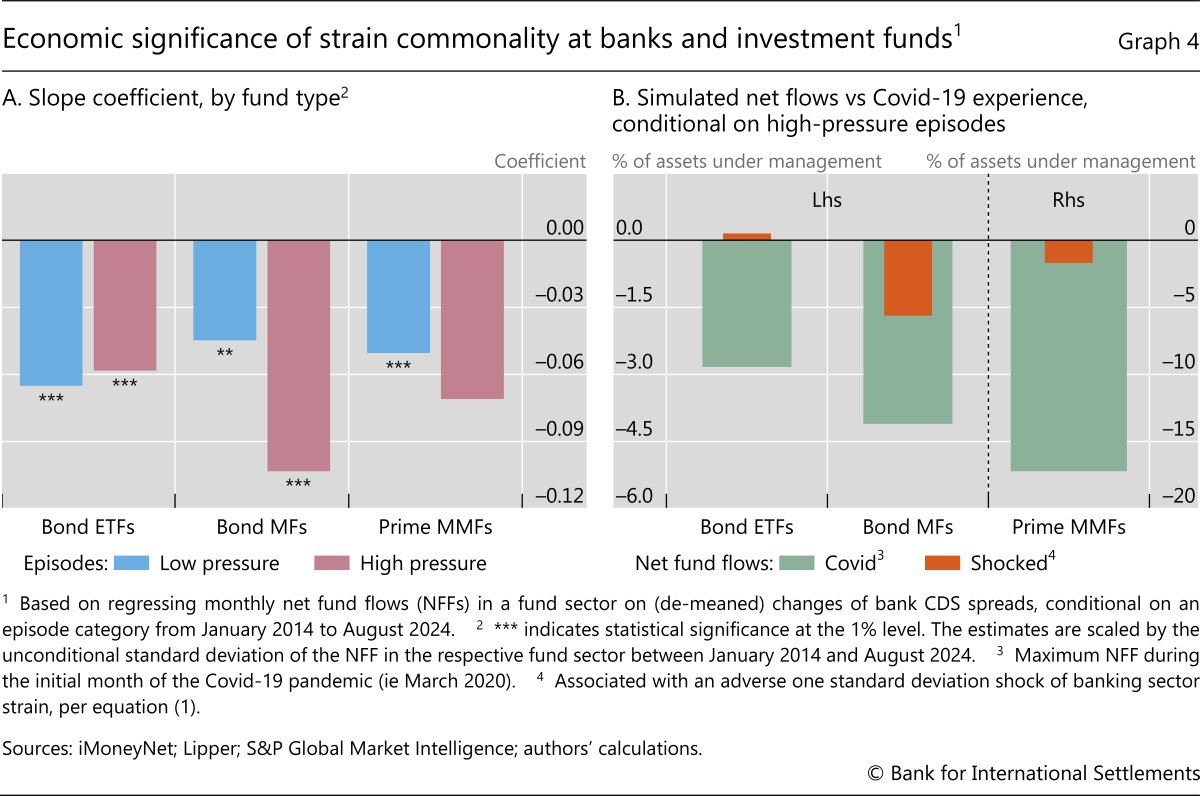
We again find a benign picture for bond ETFs. Echoing earlier results, when the market pressure on the banking sector intensifies from a high level by a typical increment, net flows at bond ETFs decline but remain in inflow territory (Graph 4.B, first orange bar). Since such an outcome would lead these funds to purchase assets, it would contribute to a normalisation of market conditions.
In the case of bond MFs, the shocked net flows are outflows and of high economic significance. The ratio of these outflows to the maximum ones during the pandemic-related crisis is at nearly one half (Graph 4.B, second orange bar relative to green bar). Such a large magnitude of shocked outflows suggests that it is likely to contribute to a tightening of market conditions by necessitating sales of illiquid assets.
Additional analysis, exploiting heterogeneity across individual funds, provides further evidence that the outflows from bond MFs in high-pressure episodes can be expected to generate material sales of illiquid assets. In Box A, we differentiate funds according to the share of highly liquid assets in their investment portfolio, while also accounting for the riskiness of this portfolio. We find that, when market pressure on banks intensifies from a high level, sector-level outflows are driven by funds with relatively low liquidity buffers. Focusing on the bond MF sector – and in line with Morris et al (2017) – we also find that low-liquidity funds are more likely to increase their cash buffers in the face of outflows. Since cash hoarding is the flip side of illiquid asset sales, such fund behaviour would tighten market conditions at an unfavourable time for banks.
Conclusion
Investor flows that lead funds to fire sales of assets would be of greater systemic relevance if they occur when market pressure on banks is already high. This is the case irrespective of whether the fund flows contribute to, or are a consequence of, the pressure on banks, or whether the two developments are the joint manifestation of external risk factors. Either way, financial stability is jeopardised.
We find that investment fund sectors differ in their tendency to experience such destabilising flows. Thanks to salient features of their business models, bond ETFs tend to actually attract investors under stress. By contrast, the bond MF sector would face large outflows when market pressure on banks escalates. This underscores the macroprudential value of containing disruptive redemptions in this sector via reforms that reduce the appeal of procyclical redemptions or via liquidity management tools that reduce investors' first-mover advantage (Lewrick and Claessens (2021)). Indeed, the Financial Stability Board and the International Organization of Securities Commissions have recently published recommendations on this topic (FSB (2023), IOSCO (2024)).
Our findings also suggest important avenues for further research. Notably, they only indirectly reveal the actual evolution of funds' sales of risky assets. The impact of investor redemptions on the volume of such sales and ultimately on market prices may be unstable or highly non-linear. Analyses of this relationship would arise naturally in system-wide stress tests (Bank of England (2024)) and would allow for more definitive conclusions about the financial stability implications of fund flows.
References
Acharya, V, N Cetorelli and B Tuckman (2024): "Where do banks end and NBFIs begin?", NBER Working Paper, no 32316, April.
Acharya, V, L Pedersen, T Philippon and M Richardson (2017): "Measuring systemic risk", Review of Financial Studies, vol 30, no 1, pp 2–47.
Acharya, V and R Rajan (2024): "Liquidity, liquidity everywhere, not a drop to use: why flooding banks with central bank reserves may not expand liquidity", Journal of Finance, vol 79, no 5.
Aldasoro, I, F Balke, A Barth and E Eren (2022): "Spillovers of funding dry-ups", Journal of International Economics, vol 137, article 103622.
Aldasoro, I, T Ehlers and E Eren (2022): "Global banks, dollar funding and regulation", Journal of International Economics, vol 137, article 103609.
Aldasoro, I, W Huang and E Kemp (2020): "Cross-border links between banks and non-bank financial institutions", BIS Quarterly Review, September, pp 61–74.
Aquilina, M, K Croxson, G Valentini and Z Sun (2023): "Authorised participants as shock absorbers in fixed-income ETFs", Finance Research Letters, vol 55, part A, article 103897.
Aradillas Fernandez, A, M Hiti and A Sarkar (2024): "Are nonbank financial institutions systemic?", Liberty Street Economics, October.
Aramonte, S and F Avalos (2020): "The recent distress in corporate bond markets: cues from ETFs", BIS Bulletin, no 6, April.
Aramonte, S, A Schrimpf and H S Shin (2023): "Non-bank financial intermediaries and financial stability", in R Gürkaynak and J Wright (eds), Research Handbook of Financial Markets, Edward Elgar Publishing, pp 147–70.
Avdjiev, S, E Eren and P McGuire (2020): "Dollar funding costs during the Covid-19 crisis through the lens of the FX swap market", BIS Bulletin, no 1, April.
Avino, D, T Conlon and J Cotter (2019): "Credit default swaps as indicators of bank financial distress", Journal of International Money and Finance, volume 94, pp 132–39.
Bagattini, G, F Fecht and A Maddaloni (2023): "Liquidity support and distress resilience in bank-affiliated mutual funds", ECB Working Paper, no 2799.
Bank of England (2024): The Bank of England's system-wide exploratory scenario exercise final report, December.
Brownlees, C and R Engle (2017): "SRISK: a conditional capital shortfall measure of systemic risk", Review of Financial Studies, volume 30, no 1, pp 48–79.
Cetorelli, N, M Landoni and L Lu (2023): "Non-bank financial institutions and banks' fire sale vulnerabilities", Federal Reserve Bank of New York Staff Reports, no 1057.
Financial Stability Board (FSB) (2021): Policy proposals to enhance money market fund resilience: final report, October.
-----(2023): Revised policy recommendations to address structural vulnerabilities from liquidity mismatch in open-ended funds, December.
-----(2024): Global monitoring report on non-bank financial intermediation, December.
Forbes, K and R Rigobon (2002): "No contagion, only interdependence: measuring stock market co-movements", Journal of Finance, vol 57, no 5, pp 2223–61.
Franceschi, E, M Grodzicki, B Kagerer, C Kaufmann, F Lenoci, L Mingarelli, C Pancaro and R Senner (2023): "Key linkages between banks and the non-bank financial sector", European Central Bank Financial Stability Review, May.
Gorbatikov, E and T Sikorskaya (2022): "Two APs are better than one: ETF mispricing and primary market participation", mimeo.
Indergand, M, E Jondeau and A Fuster (2022): "Measuring and stress-testing market-implied bank capital", SNB Working Papers, no 2, February.
International Organization of Securities Commissions (IOSCO) (2024), Revised recommendations for liquidity risk management for collective investment schemes, November.
Knaup, M and W Wagner (2012): "A market-based measure of credit portfolio quality and banks' performance during the subprime crisis", Management Science, volume 58, no 8, pp 1423–37.
Kuong, J, J O'Donovan and J Zhang (2024): "Monetary policy and fragility in corporate bond mutual funds", Journal of Financial Economics, vol 161, article 103931.
Lewrick, U and S Claessens (2021): "Open-ended bond funds: systemic risks and policy implications", BIS Quarterly Review, December, pp 37–51.
Loretan, M and W English (2000): "Evaluating changes in correlations during periods of high market volatility", BIS Quarterly Review, June, pp 29–36.
Morris, S, I Shim and H S Shin (2017): "Redemption risk and cash hoarding by asset managers", Journal of Monetary Economics, vol 89, pp 71–87.
Novick, B, D Veiner, H De Jesus, D Mayston, J Pucci, E Kiely, S Fisher and S DeZur (2020): Lessons from Covid-19: US short-term money markets, BlackRock.
Schrimpf, A, H S Shin and V Sushko (2020): "Leverage and margin spirals in fixed income markets during the Covid-19 crisis", BIS Bulletin, no 2, April.
Shim, J and K Todorov (2021): "ETFs, illiquid assets and fire sales", BIS Working Papers, no 975, November.
Todorov, K (2021): "The anatomy of bond ETF arbitrage", BIS Quarterly Review, March, pp 41–53.
Annex A: Elusive common drivers of volatility and correlation
When the volatility of two observable variables – eg changes to bank credit default swap spreads and net investment fund flows – increases, their correlation may also increase. This would happen if a common risk factor became more volatile – eg a common investor base approached financial constraints. Alternatively, the correlation would rise if the reliance on the common investor base intensified or other contagion channels between banks and investment funds strengthened. The latter is the scenario that Loretan and English (2000) and Forbes and Rigobon (2002) are interested in. By generalising an argument in these papers, this annex explains why the two alternative scenarios would drive observationally indistinguishable outcomes.
Denote the two observable variables by x and y. Suppose that these variables are driven by uncorrelated and unobservable risk factors – u, ε and v, where the first is common to the two variables and the other two are variable-specifc. The factors stem from generic probability distributions, with mean zero and some variances: u ~  , ε ~
, ε ~  and v ~
  . Ultimately, these risk factors enter the observable variables via the loading coefficients px,r ∈ (0,1) and py,r ∈ (0,1):
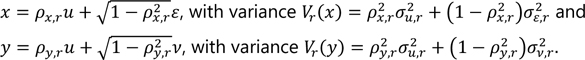
The r subscript stands for an episode category, eg episodes with high (H) or low (L) market pressure in the banking sector.
The correlation of x and y in episode r is:
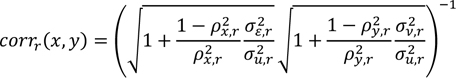
Suppose that the variances and the correlation rise with market pressure in the banking sector: VH(x) > V1(x), VH(y) > V1(y) and corrH(x,y). Either of the following two scenarios could be behind this observation. While the rise in correlation stems entirely from the volatility of the common factor in the first scenario, the corresponding rise is independent of this volatility in the second scenario.
- The volatility of the common factor increases and all else stays the same. Concretely:

- At least one of the common factor loadings increases and the volatilities of all risk factors rise proportionately. Concretely:
 (with at least one strict inequality),
  , where K>1.
If one seeks to disentangle these two scenarios, it is not enough to simply observe that both the volatilities and the correlation rise in high-pressure episodes. Some identification assumptions are necessary, such as those imposed in Loretan and English (2000) and Forbes and Rigobon (2002).
Endnotes
Graph 2: For each sector, the data are for the top 500 entities by assets under management as of December 2005 (only US domiciled MMFs); for ETFs, the data also refer to the top 500 entities as of December 2011. The MMF series do not include observations for the period around the 2016 MMF reform, ie May to October 2016. Each series is winsorised at the 1st and 99th percentiles.
1 The views expressed in this article are those of the authors, not necessarily those of the Bank for International Settlements. For helpful comments, we are grateful to Iñaki Aldasoro, Mathias Drehmann, Bryan Hardy, Gaston Gelos, Ulf Lewrick, Benoit Mojon, Gabor Pinter, Hyun Song Shin, Andreas Schrimpf and Karamfil Todorov.
2 There is no official estimate of the global size of these three fund sectors. That said, available data suggest that their US segments accounted for about 20% of the size of US NBFIs with bank-like activities (the FSB's "narrow measure") in 2023 (FSB (2024), Kuong et al (2024)).
3 From banks' perspective, the importance of this link with prime MMFs has decreased since the 2016 US MMF reform. This reform led to mass conversions from the prime to the non-prime category (Aldasoro, Ehlers and Eren (2022)). Non-prime funds invest in short-term government securities or repos backed by such securities while prime funds can also hold commercial paper of both non-financial and financial entities (including banks) and certificates of deposit.
4 Less comprehensive data indicate that pension funds and insurance companies are also part of banks' and funds' common investor base.
5 This is only one of the main propagation channels involving NBFIs. Another channel stems from fluctuations in leverage due to changes in margin requirements (Aramonte et al (2023)).
6 Since identifying causality is out of scope, we will not try to establish whether the evolution of CDS spreads is due to issues in the banking sector itself, originates in another sector or is the outcome of a market-wide risk-off environment.
7 If a gap between such months is up to two-months long, we also treat it as high pressure.
8 The increase in CDS spreads in early-2016 was likely driven by the near failure of a global systemically important bank (G-SIB). In turn, 2022 witnessed bouts of investor concern about credit risk in general and the CDS spreads of another G-SIB came under intense upward pressure.
9 Working with monthly data prevents us from detecting outsize investor swings that reverse within a calendar month. However, it avoids the noise in higher frequency data. Conducting the analysis with weekly data confirms our findings in qualitative terms but lowers their statistical significance.
10 Loretan and English (2000) and Forbes and Rigobon (2002) warn that an increase in the correlation between two variables can be the "mechanical" outcome of higher volatility. The volatility of flows in the bond MF and prime MMF sectors did increase from the earlier to the later subperiod in our sample but that of flows in the bond ETF sector and of monthly changes in bank CDS spreads declined. In the Annex A, we illustrate that the link between volatilities and correlations can be driven by fundamentally different but observationally indistinguishable mechanisms. Since we are agnostic about the drivers of correlation changes, either mechanism could be behind our findings.
11 This echoes a finding in Acharya et al (2024) on commonalities between the banking and the broad NBFI sectors. Using stock price data, they find that: (i) the systemic risk contributions of these two sectors have become more correlated since the GFC; and (ii) returns in each of the sectors cause – in a statistical sense – returns in the other.
12 By de-meaning the right-hand side variable, we set the intercept equal to the average NFF.
13 Since we condition on high market pressure episodes, this typical shock is in the "tail".