Investor size, liquidity and prime money market fund stress
Massive redemptions at money market funds (MMFs) investing primarily in high-quality short-term private debt securities were an important feature of the market dislocations in March 2020. Building on previous studies of the underlying drivers, we find that large investors' withdrawals did not differentiate across prime institutional MMFs according to these funds' asset liquidity positions. We also find that, faced with large redemptions, the managers of these funds disposed of the less liquid securities in their portfolios, marking a departure from their behaviour in tranquil times. This is likely to have exacerbated market-wide liquidity shortages. After the Federal Reserve's announcement of the Money Market Mutual Fund Liquidity Facility, all funds strengthened their liquidity positions, with those hardest-hit by outflows attempting to catch up with peers.1
JEL classification: G23, G28, E58.
Key takeaways
- In March 2020, prime institutional money market funds serving large investors experienced withdrawals irrespective of the liquidity of underlying assets.
- During the massive withdrawals, fund managers mostly disposed of less liquid assets, which may have exacerbated market-wide liquidity shortages.
- Once policy relief set in, fund managers rebuilt liquidity buffers, with the funds hardest-hit by outflows strengthening their liquidity positions most aggressively.
As the Covid-19 shock gathered momentum in March 2020, large withdrawals beset money market mutual funds (MMFs) investing primarily in high-quality short-term private debt securities (prime MMFs). Since these funds are major global providers of short-term dollar funding to banks and non-financial corporates, their stress had system-wide repercussions (Eren, Schrimpf and Sushko (2020a,b)).
This run on prime MMFs was different from other prominent financial runs in history. The bank runs during the Great Depression and the 2008 run on the very same MMF sector were triggered by concerns about the credit quality of the intermediaries' portfolio of assets. In March 2020, credit quality was not an obvious concern, partly reflecting the strengthened requirements introduced by MMF regulatory reforms in the aftermath of the 2008 crisis.
Previous studies of MMF stress have pointed to concerns over funds' liquidity. Li et al (2020) find that prime institutional funds with relatively weaker liquidity positions suffered more pronounced outflows.2 Cipriani and La Spada (2020) note that the funds' investor base also played a role: while funds' liquidity was relevant for prime institutional funds, it was not for their retail counterparts. One complicating factor in these assessments is that prime institutional and retail funds are subject to different regulatory rules, making it hard to disentangle the effect of the investor base from that of regulation.
To further investigate the role of the investor base, we focus on prime institutional MMFs. Focusing on funds facing identical regulations allows us to study other determinants of redemption patterns. To distinguish investor types, we differentiate between funds with large and small minimum investment sizes, as they tend to cater to large and small institutional investors, respectively. Other studies have shown that these two groups of funds behaved differently during past stress episodes (eg Schmidt et al (2016), Gallagher et al (2020)).
We find that investor size was an important determinant of the pattern of redemptions from prime institutional MMFs in March 2020. Possibly owing to their own cash needs, large investors massively redeemed fund shares, paying little attention to the liquidity of the funds' asset portfolios. By contrast, the liquidity of funds' positions was relevant for small institutional investors. However, to the extent that the characteristics of funds' assets were not the sole driver of redemptions, this was not a classic run.
In the second part of this feature, we shift the focus from the behaviour of investors to that of the fund managers. We find that managers disposed of the less liquid assets in their portfolios. Such sales may have exacerbated market-wide liquidity shortages during the heightened market stress in the first half of March. This stress eased after the Federal Reserve announced its Money Market Mutual Fund Liquidity Facility (MMLF) in mid-March, which stemmed withdrawals. Managers proceeded to rebuild their liquidity buffers, raising them to higher than pre-pandemic levels. Ultimately, funds that had experienced larger withdrawals saw a stronger subsequent build-up of liquidity buffers.
This feature proceeds as follows. In the next section, we present a brief introduction to the MMF sector and survey attendant developments during the March 2020 stress, both at the sector and the fund levels. In the second section, we focus on liquidity positions and investor size as potential drivers of the March stress at US prime institutional MMFs. The third section studies such MMFs' liquidity management before, during and after the stress episode. The last section concludes.
An overview of MMFs in the March market turmoil
Institutional background
MMFs are mutual funds that invest in short-term assets of high credit quality. Their function as intermediaries is to offer a cash management tool to investors, while providing short-term funding to governments, financial institutions and corporates (Aldasoro, Eren and Huang (2021)). As of the end of 2019, the MMF sector had assets under management (AUM) in excess of $7 trillion globally, mainly in the United States (57%) and the euro area (20%) (FSB (2020b)).3
Following the stress suffered by the sector in 2008, authorities introduced sweeping regulatory reforms in the main jurisdictions.
In terms of their set of eligible assets, US MMFs are broadly classified as government, prime and tax-exempt. Government MMFs invest most of their assets in US Treasuries, US agency securities and repurchase agreements collateralised by US Treasuries. Prime MMFs mainly invest in private sector securities such as certificates of deposit and financial or non-financial commercial paper. Tax-exempt funds primarily hold municipal securities.
As regards US prime MMFs – which are the main focus of our analysis below – regulation differentiates between retail and institutional funds. Only individuals (natural persons) can access prime retail MMFs. There are no access restrictions for prime institutional MMFs, but they typically cater to large non-financial investors such as corporate treasuries, or financial institutions such as pension funds. Retail and institutional funds also differ in their share pricing rules. While the former maintain constant net asset values (NAVs), prime institutional MMFs mark their portfolios to market so that they have floating NAVs. All prime funds may impose redemption gates or liquidity fees, ie suspend redemptions or make them costlier, when their weekly liquid assets (WLA) fall below 30% of their total assets.4 These regulatory guidelines are intended to provide fund managers with liquidity management tools to address redemption pressure.5
In Europe, shares in MMFs are almost exclusively held by institutional investors.6 Based on their share pricing rules, European funds are categorised into constant net asset value (CNAV), low volatility net asset value (LVNAV) and variable net asset value (VNAV) MMFs. CNAV funds are similar to US government MMFs in that they hold mostly government securities. But in contrast to US government MMFs and similar to US prime MMFs, European CNAV funds can introduce redemption gates and liquidity fees. While LVNAV and VNAV MMFs are comparable to US prime funds in terms of portfolio composition, only LVNAV funds are subject to MMF regulatory guidelines on gates and fees on investor redemptions.7
Developments in the MMF sector in March 2020
In early March 2020, the initial sanguine reaction of investors to the threat posed by Covid-19 gave way to a frantic "dash-for-cash".8 Prime institutional MMFs saw 20 consecutive days of outflows between 6 and 26 March 2020 (henceforth, the run or stress period). The redemption dynamics in the midst of this acute market turmoil diverged widely across MMF types.
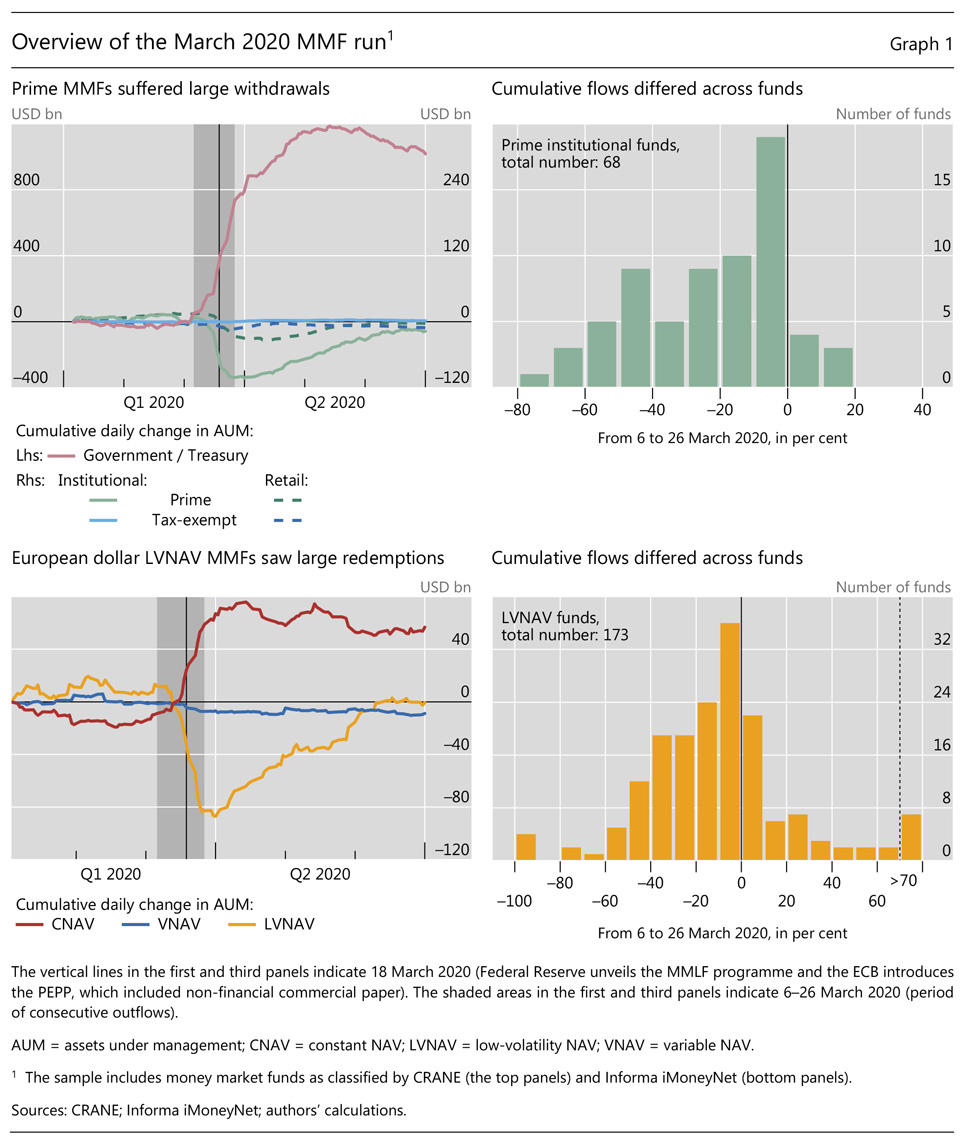
Government MMFs saw massive inflows over the course of March 2020 as investors fled to safety in both the United States and Europe. By the end of the month, US government MMFs had notched up investor inflows of around $800 billion (Graph 1, first panel, red line), increasing their pre-stress AUM by almost a third. Similarly, European dollar-denominated CNAV funds saw almost a 70% increase in their AUM, with inflows around $80 billion (third panel, red line).
At the same time, most other MMF classes experienced outflows. US prime institutional MMFs and European dollar-denominated LVNAV funds underwent a run-type event, with withdrawals reaching roughly $100 and $90 billion, respectively (Graph 1, first panel, green solid line, and third panel, yellow line). Daily outflows from US prime institutional MMFs exceeded 2% of the previous-day AUM for eight trading days in a row, an extraordinary event from a historical perspective. European dollar-denominated LVNAV funds had a similar experience.9
Further reading
Within the prime institutional MMF universe, the experience of individual funds was highly uneven. During the run, cumulative redemptions ranged from 5 to 40% of pre-run AUM for half of the funds, with a quarter of the funds faring much worse (Graph 1, second panel).10 By contrast, some funds recorded gains of up to 20% of pre-run AUM. In Europe, one half of the fund-level redemptions were within a comparable range of 0–30% of pre-run AUM (fourth panel).
In response to the market strains, a number of programmes were rolled out to provide liquidity support. In the United States, the Federal Reserve established the Money Market Mutual Fund Liquidity Facility (MMLF) on 18 March.11 This programme allowed banks to borrow from the Federal Reserve by pledging a wide range of assets purchased from prime and tax-exempt MMFs. Eligible assets included the most distressed ones, such as commercial paper and certificates of deposit. The loans to the participating banks were given on a non-recourse basis (ie banks did not bear credit risk) and were exempt from regulatory capital requirements.12 The facility eased the stress by making banks willing buyers of illiquid assets, thus providing liquidity to MMFs to meet redemptions. In so doing, it reduced investors' pre-emptive withdrawals.
Likewise, the ECB announced on 12 March a new instalment of long-term refinancing operations that provided immediate liquidity to the European financial system. The ECB's US dollar operations, anchored to the swap lines with the Federal Reserve announced on 15 March, provided dollar liquidity support. Moreover, on 18 March the ECB's Governing Council included non-financial commercial paper in its Pandemic Emergency Purchase Programme. As in the United States, these measures contributed to easing the stress of European funds.
Liquidity and investor size as drivers of the run
What characteristics of US prime institutional MMFs influenced the run in March?
Previous literature has identified the liquidity of funds' portfolio as an important driver of redemptions. As a fund's WLA decline towards the regulatory threshold that triggers gates and fees, investors' incentives to redeem their shares pre-emptively increase. This is because gates and fees make redemptions impossible or costlier, which reduces the value of the investments.
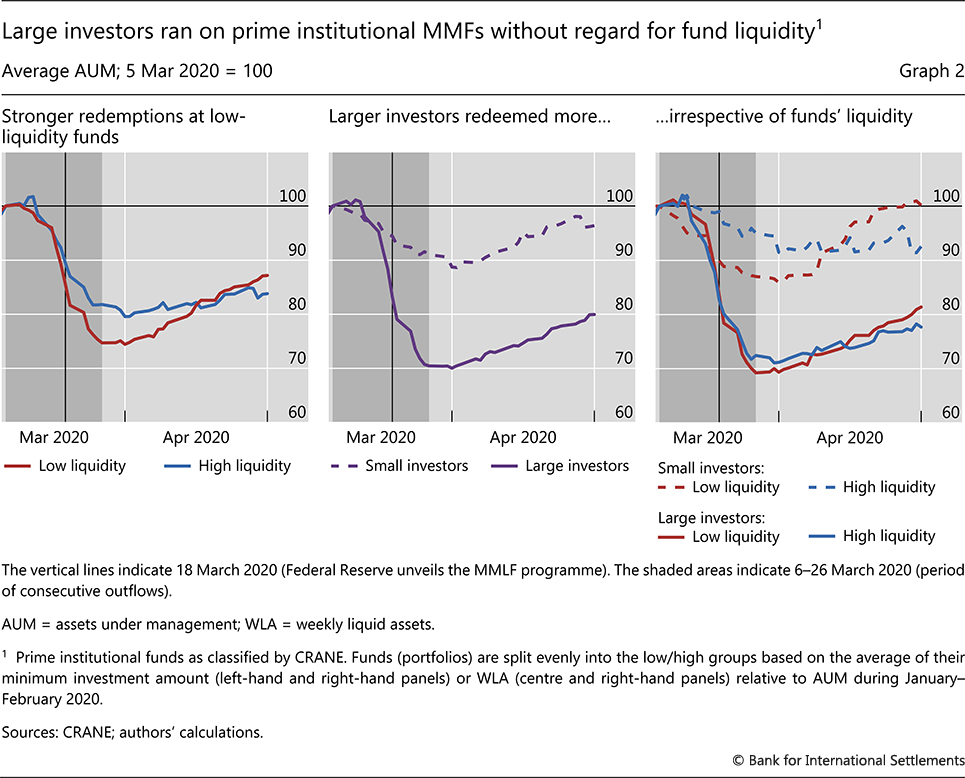
Consistent with previous evidence, we observe that aggregate outflows during the stress episode in March were higher – even if only slightly – for prime institutional MMFs with weaker liquidity positions. We sort funds on the basis of their average WLA ratios in January and February 2020 and split them evenly into low- and high-liquidity categories. The cumulative outflow from low-liquidity funds was on average 7% larger than that from high-liquidity funds (Graph 2, left-hand panel).
Previous literature has also found that investor features closely associated with size played an important role in driving previous MMF stress. In principle, large investors are likely to be more responsive to early signs of stress. As they have access to more sizeable resources for data gathering, market intelligence and analysis than smaller investors, they can identify and respond to risks more quickly.13
In addition, large investors may be subject to constraints that make them particularly averse to potential capital losses. For instance, corporate treasurers, who temporarily park excess liquidity earmarked for payrolls in prime funds, may be sensitive to potential capital losses and are likely to promptly redeem when signs of stress at these funds first appear. Also, large investors may take leveraged risky positions. When such positions turn sour, these investors are likely to redeem in response to margin calls, or in anticipation of them. In other words, they would react to sources of liquidity stress that are unrelated to the features of the MMFs in which they invest.
We find that outflows of larger investors from prime institutional MMFs were more severe during the March episode. Since we do not have direct information on investors' size, we use the proxy of the size of the funds' minimum investments.14 Funds with a minimum investment above the median (henceforth, funds with large investors) experienced on average higher redemptions (Graph 2, centre panel). In fact, cumulative outflows during the run differed by almost 20% between large- and small-investor funds.
More importantly, we find that large and small investors differed starkly in their response to funds' liquidity positions. To support this conclusion, we combine the two previous classifications and form four groups of funds. Up to end-March, outflows from funds, for both high- and low-liquidity segments, with large investors were much more intense than those from funds with smaller investors (Graph 2, solid lines vs dashed lines). Moreover, among the funds with large investors, withdrawals were roughly of the same intensity regardless of the funds' underlying liquidity (Graph 2, red vs blue solid lines). By contrast, among funds with smaller investors, those with low liquidity saw larger withdrawals (red vs blue dashed lines). Overall, these results are consistent with large investors redeeming because of their own liquidity needs, while smaller investors appeared more concerned with the liquidity of the funds' assets.
A panel regression analysis quantifies more formally the above results (Box A). Funds with larger investors experienced 1.7% higher daily outflows – that is, 26% higher cumulative run outflows over the stress period. Further, large investors' daily outflows did not differ materially (0.3%) between high- and low-liquidity funds, either in terms of economic or statistical significance. Finally, small investors did withdraw more forcefully from low-liquidity funds, to the tune of 0.8% higher daily outflows (or more than 10% higher cumulative run outflows).
Funds' liquidity management over the episode
MMF managers could respond to the large redemptions in two alternative ways. They could sell off their most liquid assets, in an attempt to minimise transaction costs, particularly under conditions of acute market illiquidity. But by so doing, they would weaken their liquidity positions, bringing them closer to the regulatory thresholds and potentially triggering further withdrawals. Alternatively, they could choose to also reduce their less liquid security holdings, in order to preserve the fund's liquidity position. This, however, could lead to larger price discounts and thus higher capital losses.15
Box A
Quantifying the role of liquidity and investor size in MMF run risk
We employ panel regression to formally study the role of liquidity and investor size in runs on US prime institutional funds. We first examine the effects of each factor separately and then turn to joint effects.
We start by estimating the following equation over the run period 6–26 March 2020:

where outflowi,t is the daily outflow from fund i at time t calculated as the daily percentage change of AUM; and 1low WLA,i and 1high MI,i are dummy binary variables, the first one taking value 1 if the fund i's average WLA during January–February 2020 was less than the cross-sectional median, and 0 otherwise, and the second taking the value 1 if the minimum investment for fund i was higher than the cross-sectional median, and 0 otherwise. Xi,t-1 are control variables that include lagged AUM (in logarithms) and the gross 30-day yield of each fund, and at is a time fixed effect. In this context,
  and
and  measure how the intensity of the run varied on average with the pre-stress fund characteristics.
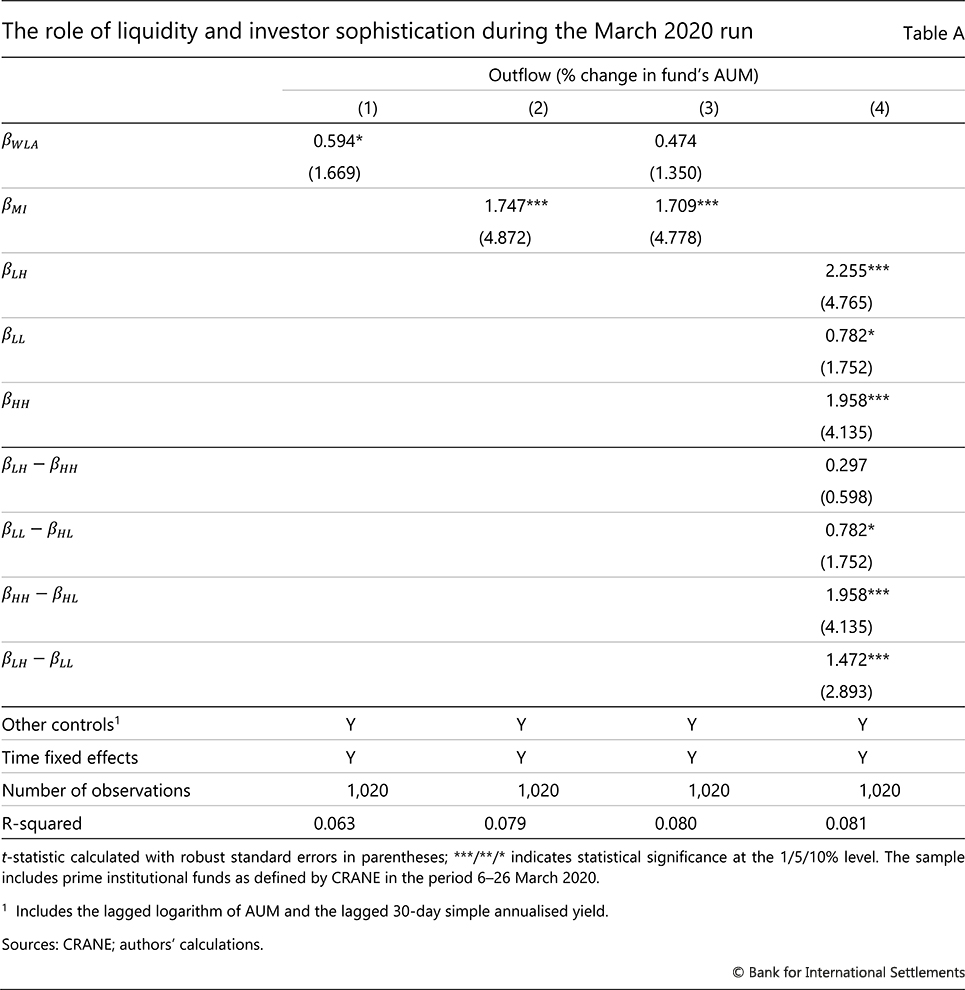
The results are as follows. When estimated separately, and are both positive and statistically significant, confirming that funds with weaker liquidity conditions and larger investors would face larger withdraws all else equal (Table A, columns (1) and (2)). On average, weaker-liquidity-condition funds face 0.6% higher daily outflows, which translates into close to 10% higher cumulative run flow. The corresponding difference between funds with larger and smaller investors is 1.7% for daily outflow and more than 20% for cumulative run outflow. Joint estimates of and are of similar magnitudes (column (3)), suggesting that the two factors complement each other in affecting run intensity. That said, the WLA dummy becomes not significant in the presence of the minimum investment dummy.
To examine how liquidity and investor size interact with each other in affecting run vulnerabilities, we employ a modified version of the above regression. To that end, we first partition funds into groups similar to those shown in the right-hand panel of Graph 2: low WLA and low minimum investment (LL), low WLA and high minimum investment (LH), high WLA and low minimum investment (HL), and high WLA and high minimum investment (HH). Then, we assign a binary dummy variable to each group. Finally, we replace 1low WLA,i and 1high MI,i with this new set of dummies.
The results reveal that the liquidity position of the fund is irrelevant for the redemption decision of large investors (Table A, column (4)). The difference between  and
and  is small in magnitude (0.3%) and not statistically significant.
 The liquidity condition of the fund, however, does matter for small investors, with low liquidity funds experiencing 0.8% higher outflows all else equal
  . Comparing larger with smaller investors, the former always withdrew more aggressively, by 2%
  and 1.5%
  in terms of daily outflows for high- and low-liquid funds, respectively.
The median for the minimum investment is calculated across funds. The median for the average WLA is calculated across portfolios. This is because sometimes several funds (akin to share classes) invest in a single portfolio. As a result, liquidity measures are identical for all funds that share the same portfolio. We also rerun the analysis using continuous measures of liquidity and investor sophistication. The message is robust to this modification.
How did managers actually respond? At the beginning of the run episode, managers of funds suffering larger withdrawals prioritised preserving their WLA. In fact, such funds tended to increase their WLA ratios (Graph 3, left-hand panel, red line across the grey area). Funds suffering lower outflows also increased their WLA, but to a lesser extent (blue line).
Weighted average maturity (WAM),16 another measure of portfolio liquidity, followed the opposite path at the beginning of this episode. Initially, this measure increased significantly – pointing to reduced liquidity – for high-outflow funds (Graph 3, right-hand panel, red line), in contrast with the upswing in WLA. The pattern was similar for low-outflow funds, even though the magnitudes were smaller (blue line).
Thus, the asset managers of prime institutional MMFs may have added to the liquidity stress in financial markets prior to the MMLF announcement. Considered together, the WLA and WAM paths suggest that these managers substituted short-term private debt securities for longer-tenor US Treasuries and other government obligations. In this way, they could preserve WLA while at the same time enhancing yield. These trades were procyclical, as they took place when private debt was already under selling pressure and cash-like government instruments were in high demand.
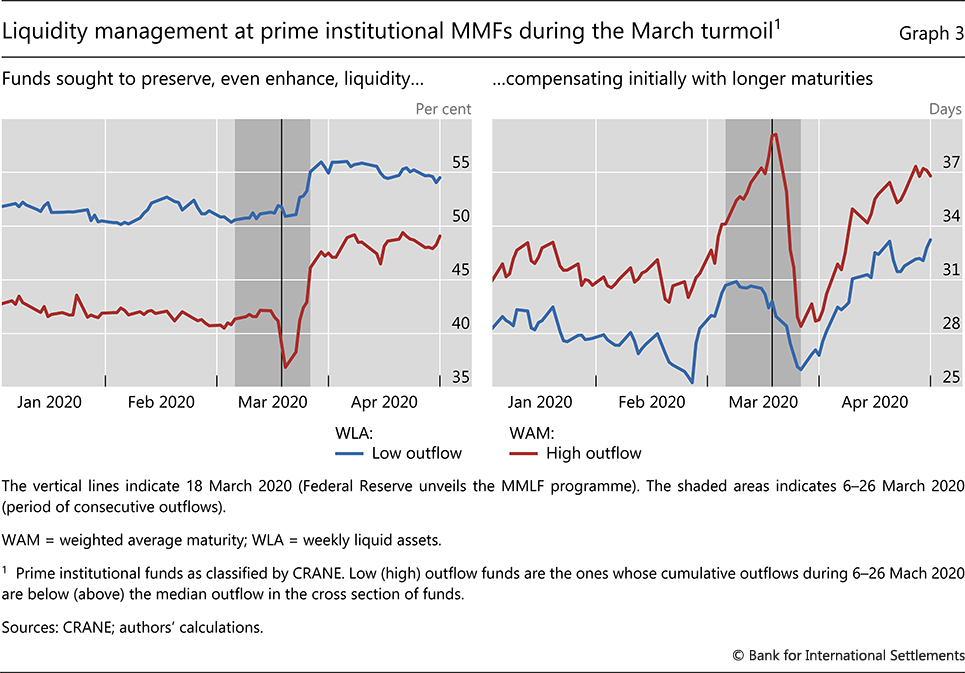
After the Federal Reserve unveiled the MMLF on 18 March 2020, market conditions started to normalise and all funds began to replenish their liquidity buffers. Managers aggressively disposed of less liquid assets, such as commercial paper and certificates of deposit, at now lower liquidation costs and rotated their holdings towards more liquid ones. Concretely, funds tended to both increase their WLA and reduce their WAM. Funds that had experienced stronger redemptions and were thus left with weaker liquidity positions quickly caught up with their peers, cutting the gap in WLA ratios from about 14 percentage points initially to about 7 percentage points by end-March (Graph 3, left-hand panel). The concurrent drop in the WAM gap was equally sizeable, from about 10 days to less than two days (right-hand panel).
Formal econometric analysis confirms the picture painted by the graphs, providing some additional quantitative insights (Box B). In particular, managers of funds that had seen larger outflows prior to the announcement of the MMLF increased WLA at a faster pace on average. Specifically, a fund experiencing 22% (or one standard deviation) larger outflows tended to raise its WLA by 0.8% more in a day, or by 8% more over the rest of March.
Conclusions
The inability of prime institutional MMFs to provide liquidity on demand in March 2020 called for central bank intervention (FSB (2020a)). Unlike banks, which proved to be useful elastic nodes during the pandemic-induced turmoil (Shin (2020)), the funds' dash for liquidity added to the stress across financial markets. Thus, the provision of central bank liquidity was pivotal in restoring calm (CGFS (2011)).
The events of March 2020 have left an indelible mark. They echoed those during the Great Financial Crisis in September 2008, when the MMF sector suffered a comparable massive seizure and also required central bank assistance. Our findings are offered as a contribution to the ongoing debate about the policy measures that could enhance the resilience of MMFs.
Box B
Assessing the response of liquidity measures to redemptions
In this box, we conduct panel regressions to assess MMFs' liquidity management in response to the run, differentiating pre-stress behaviour from behaviour during the initial stress phase, before the MMLF and post-MMLF.
Specifically, for each of the three periods, we assess the impact of outflows on various liquidity gauges:

where  denotes the daily change in a liquidity measure (WLA or WAM) for portfolio j at time t; Outflowj,t represents daily outflows from portfolio j at time t; and RunOutflowj reports the cumulative outflow experienced by fund j during the run period and before the announcement of the MMLF. The latter variable is only included in the post-MMLF period to capture the effect of portfolio-level run stress on liquidity management. Finally, we include the same set of control variables Xj,x-1 as in the previous section but recalculated at the portfolio level.
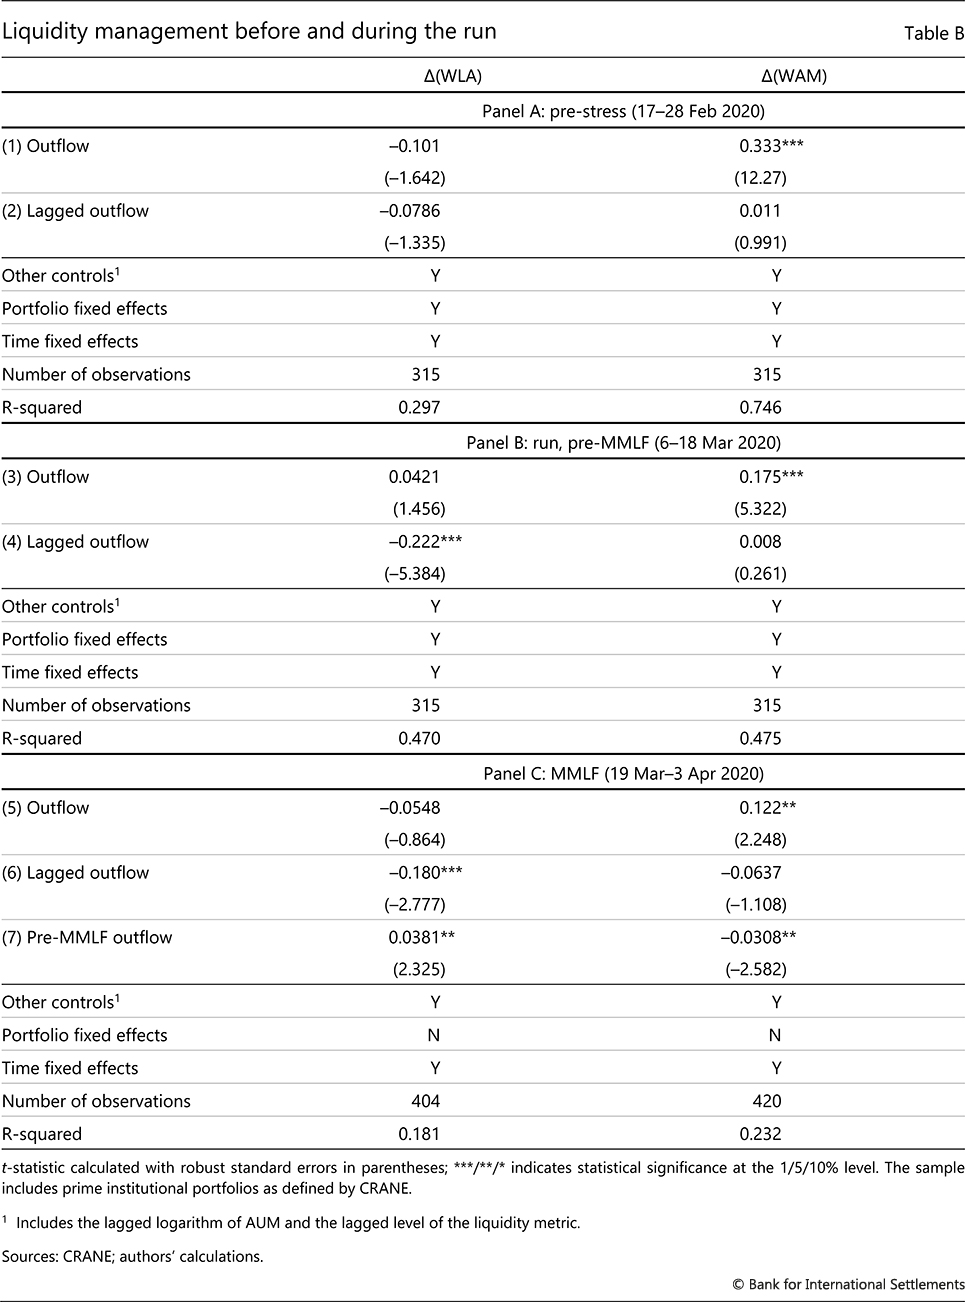
Panel A of Table B presents the results for the pre-run period (17–28 February). On normal days, investors' outflows are met with liquid asset sales, which typically cause a drop in liquidity as measured by both WLA and WAM. This is revealed by a positive and statistically significant coefficient of outflows for WAM and a negative, albeit nonsignificant coefficient for WLA (line (1)). The impact of outflows is transient, as previous outflows have no bearing on current liquidity measures (line 2)).
Panel B of Table B characterises managers' decisions during the run period, and before the MMLF was announced (6 to 18 March). There are several differences relative to normal times. First, the outflow coefficient for the WLA measure is not statistically different from zero (line (3)). This suggests that, during the run, managers tried to preserve liquid assets in the face of outflows. This "leaning against the outflows" by portfolio managers has limited scope, however: the coefficient of past outflows is negative and significant, suggesting that persistent outflows decrease managers' ability or willingness to preserve WLA (line (4)). By contrast, the contemporaneous coefficient of outflows for WAM is still positive and significant, as in the previous period.
Finally, panel C of Table B presents the results for the first two weeks after the announcement of the MMLF (19 March to 3 April). During this period, managers gained the possibility of introducing large changes in their portfolios at low cost (as the Fed underwrote their assets on a cost basis). In that context, they started accumulating liquid assets and did so at a brisker pace the larger their cumulative outflows during the preceding run (both coefficients on line (7)).
Sometimes several funds (akin to share classes) invest in a single portfolio. As a result, liquidity measures are identical for all funds residing within the same portfolio. All measures exhibit a statistically significant "reversion to the target" as indicated by a large negative coefficient in front of lagged liquidity variables (not reported): deviations of liquidity from the previous day (presumably close to the fund manager's target for the vehicle) are met with a compensating move the following day. The announcement of the MMLF was made late in the evening on 18 March. Therefore, we include 18 March in the pre-MMLF period.
References
Aldasoro, I, C Cabanilla, P Disyatat, T Ehlers, P McGuire and G von Peter (2020): "Central bank swap lines and cross-border bank flows", BIS Bulletin, no 34, December.
Aldasoro, I, E Eren, and W Huang (2021): "Dollar funding of non-US Banks through Covid-19", BIS Quarterly Review, March, pp 33-42.
Baba, N, R McCauley and S Ramaswamy (2009): "US dollar money market funds and non-US banks", BIS Quarterly Review, March, pp 65–81.
Bouveret, A and D Lorenzo (2020): "Vulnerabilities in money market funds", European Securities and Markets Authority, ESMA Report on Trends, Risks and Vulnerabilities, no 2, September.
Cipriani, M and G La Spada (2020): "Sophisticated and unsophisticated runs", Federal Reserve Bank of New York, Staff Report s, no 956, December.
Committee on the Global Financial System (CGFS) (2011): "Global liquidity – concept, measurement and policy implications", CGFS Papers, no 45, November.
Eren, E, A Schrimpf and V Sushko (2020a): "US dollar funding markets during the Covid-19 crisis – the money market fund turmoil", BIS Bulletin, no 14, May.
Eren, E, A Schrimpf and V Sushko (2020b): "US dollar funding markets during the Covid-19 crisis – the international dimension", BIS Bulletin, no 15, May.
Financial Stability Board (FSB) (2020a): Holistic review of the March market turmoil, November.
----- (2020b): Global Monitoring Report on Non-Bank Financial Intermediation 2020, December.
Gallagher, E, L Schmidt, A Timmermann and R Wermers (2020): "Investor information acquisition and money market fund risk rebalancing during the 2011–12 eurozone crisis", The Review of Financial Studies, vol 33, no 4, pp 1445–83.
International Organization of Securities Commissions (IOSCO) (2020): Money market funds during the March-April episode – thematic note, November.
Li, L, Y Li, M Macchiavelli and X Zhou (2020): "Runs and interventions in the time of Covid19: evidence from money funds", Federal Reserve Board, manuscript.
Ma, Y, K Xiao and Y Zeng (2020): "Mutual fund liquidity transformation and reverse flight to liquidity", unpublished manuscript.
Schmidt, L, A Timmermann and R Wermers (2016): "Runs on money market mutual funds", American Economic Review, vol 106, no 9, pp 2625–57.
Shin, H S (2020): "Central bank balance sheet and financial stability", speech at the ECB Forum on Central Banking, Sintra, November.
Strahan, P and B Tanyeri (2015): "Once burned, twice shy: money market fund responses to a systemic liquidity shock", Journal of Financial and Quantitative Analysis, vol 50, issue 1-2, April, pp 119–44.
1 We thank Stefan Avdjiev, Claudio Borio, Stijn Claessens, Ingo Fender, Ulf Lewrick, Benoît Mojon, Andreas Schrimpf, Hyun Song Shin and Nikola Tarashev for helpful comments and suggestions. We are also grateful to Giulio Cornelli and Albert Pierres Tejada for excellent research assistance. The views expressed are ours and do not necessarily reflect those of the Bank for International Settlements.
2 This stood in contrast to studies of a similar event in 2008: Strahan and Tanyeri (2015) and Schmidt et al (2016) did not find significant connection between the severity of the 2008 MMF run and fund-level liquidity conditions.
3 The size of the MMF sector has stagnated in the United States and the euro area since the Great Financial Crisis of 2007–09, as their AUM were almost the same at end-2019 as at end-2008 (Baba et al (2009)). In contrast, AUM have grown from almost nil to about $1.8 trillion in the rest of the world, spearheaded by local currency-denominated funds.
4 On any given reporting day, WLA generally include cash, US Treasury securities, other government securities with remaining maturities of 60 days or less and securities that mature within one week.
5 Tax-exempt MMFs broadly follow the same regulatory provisions as prime MMFs. Government MMFs, on the other hand, offer constant NAVs, are not required to separate retail and institutional investors, and do not impose gates or fees.
6 See Bouveret and Lorenzo (2020).
7 LVNAV funds are expected to preserve a constant NAV. If the marked-to-market value of their portfolio falls below a regulatory threshold, LVNAV funds are obliged to turn into VNAV funds.
8 See FSB (2020a) for a detailed review of market developments during the 2020 March market turmoil. See Aldasoro. Cabanilla, Disyatat, Ehlers, McGuire and von Peter (2020) regarding dollar liquidity demand ("dash-for-dollar") during the episode.
9 Euro-denominated VNAVs also suffered outsize withdrawals during this period (IOSCO (2020)).
10 These bounds correspond to the interquartile range of cumulative fund-level outflows between 6 and 26 March 2020.
11 The Federal Reserve also established two other programmes to ease short-term funding market strains, the Commercial Paper Funding Facility and the Primary Dealer Credit Facility, both on 17 March 2020.
12 The US Treasury provided credit protection to the Federal Reserve.
13 To the extent that large investors concentrate in specific funds, each one knows that other similarly informed investors stand ready to redeem strategically. In the presence of a first-mover advantage, this increases the incentive to withdraw swiftly at the sign of trouble (Schmidt et al (2016)).
14 In our sample, minimum investment sizes range from a single US dollar to $5 billion, with a median of $1 million and an interquartile range between $77,500 and $10 million.
15 Under conditions of market stress, disposing of illiquid assets turns particularly expensive, as bid-ask spreads usually turn much wider (see eg Ma et al (2020)). See Bouveret and Lorenzo (2020) and Ma et al (2020) for discussions on similar trade-offs facing European MMFs and other mutual funds.
16 WAM – which is not a regulatory ratio – is based on the number of days to maturity or to coupon resetting (whichever is lower) for the various securities in the portfolio. Assets with higher holdings in the portfolio are weighted proportionately more.