Unpacking international banks' deposit funding

This feature examines international banks' deposit funding – traditional deposits, repos and interbank lending1. We lay out a framework to interpret the observed evolution in the level and composition of this funding. Netting out interbank lending and abstracting from the effect of central bank quantitative tightening, we find that during the banking turmoil in the first quarter of 2023 the source of banks' deposit funding rotated from the non-financial sector to non-bank financial institutions. This rotation was material in a handful of jurisdictions. In particular, residents of Switzerland moved deposits from international banks located there to domestically oriented banks. Dollar funding of banks in the United States shifted to money market funds, which then increased their (repo) dollar funding of non-US banks.
JEL classification: E44, E51, E58.
The banking turmoil in March 2023 brought renewed attention to bank deposits. A quickening of deposit outflows at several banks – in part due to rising interest rates – prompted financial stability concerns. Rate hikes have also created incentives for depositors to shift away from banks in search of higher returns (Afonso et al (2023)).
This special feature presents a framework for interpreting the evolution of the size and composition of banks' deposits. Key drivers of this evolution are central bank asset purchase/sale programmes, which can affect the size of banks' balance sheets, and the interbank market, which can swell the funding volume for given lending to non-banks. Further, a funding withdrawal can resurface on bank balance sheets as funding from another sector or as a different funding instrument.
Using this framework, we rely heavily on the BIS locational banking statistics (LBS) to study international banks' "deposit funding" – here defined very broadly to include traditional customer deposits, repurchase agreements (repos) and interbank lending. We consider the evolution of this funding since 2018, with a special focus on the first quarter of 2023. In a sample of 27 countries (excluding the United States),2 the aggregate growth of international banks' deposit funding was effectively nil in Q1 2023. We obtain this result after netting out interbank lending and abstracting from the effect of quantitative tightening.
Key takeaways
- Non-bank financial institutions substituted for the non-financial sector as providers of deposit funding to internationally active banks in Q1 2023. This rotation was globally modest but concentrated in a few jurisdictions.
- International banks in Switzerland saw an aggregate decline in deposit funding in Q1 2023, with resident funding providers shifting largely to local banks with a domestic focus.
- Dollar deposits in the United States shifted to money market funds in the first half of 2023, which in turn increased dollar lending to banks headquartered outside the United States.
Digging deeper, we find evidence of a rotation of funding sources across banks in the LBS. In Q1 2023, deposit funding from non-bank financial institutions (NBFIs) substituted for that from the non-financial sector (NFS) – households, corporates and governments. The underlying magnitudes were relatively small, as the rotation involved about 0.5% of the outstanding funding from non-banks. In parallel, the internationally active banks in Switzerland saw a 12% drop in funding from both NBFIs and the NFS. Most of this decline from resident non-banks appeared to be reallocated within the country to domestic banks not captured in BIS statistics.
The United States was at the centre of the banking turmoil and is key to dollar funding in the broader banking system. We complement BIS data with other sources to document a similar rotation in dollar funding (see box). Depositors in the United States shifted their dollar deposits to money market funds, which in turn increased their dollar funding to banks headquartered outside the United States.
This feature proceeds in three steps. First, it presents a framework for tracing deposit funding changes through the balance sheets of different sectors in the economy. Second, it describes the definitions and coverage in the LBS and discusses how deposit funding changes in the economy are recorded or missed in the data. Third, it uses the framework to discuss the recent evolution of international banks' deposit funding.
A framework for interpreting changes in aggregate bank funding
This section presents a framework which considers a global economy containing four sectors: a banking sector, an NFS, an NBFI sector and a central bank. The banking sector consists of all banks – both internationally active and purely domestic. The non-financial sector consists of households, non-financial corporations and governments. The NBFI sector includes entities such as money market funds, hedge funds, central counterparties and insurance companies. Banks are distinct from NBFIs because they can create means of payment – transaction deposits – rather than having to borrow them to finance asset growth. We provide stylised examples to trace deposit funding changes through the balance sheets of these sectors. Among these examples, we show how quantitative tightening and interbank lending can obscure other deposit funding changes, and how deposit withdrawals affect (or not) the aggregate balance sheet of the banking sector.
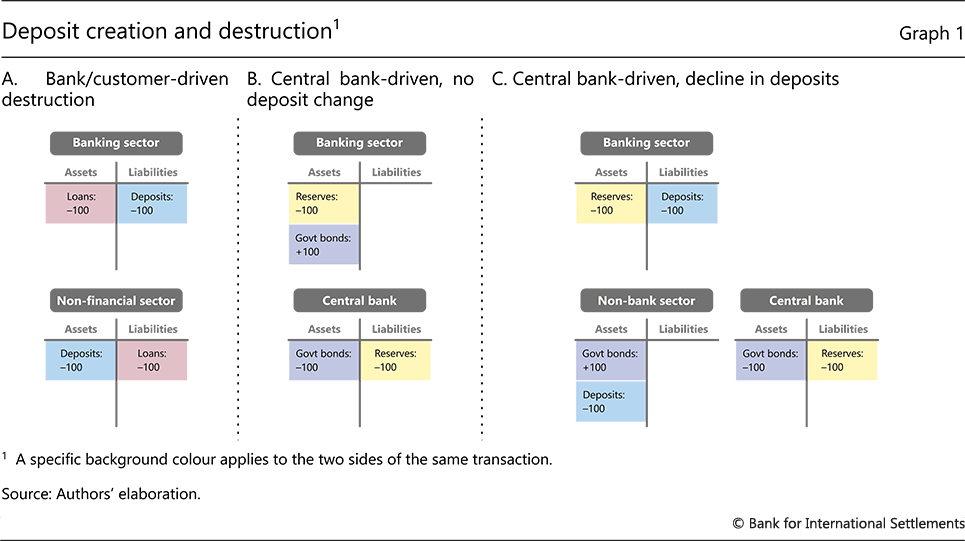
In a closed system, the expansion or contraction of banks' claims is a key driver of the level of deposit funding. Banks generate transaction deposits by extending a loan or acquiring some other asset (eg a bond), and destroy them when the loan/debt is repaid (Graph 1.A).3 The banking sector's balance sheet thus expands when loans are granted faster than they are repaid and shrinks in the opposite case. Banks can also expand their balance sheet by issuing non-deposit liabilities, but these cannot be used as a means of payment.
Quantitative easing or tightening by the central bank can also affect the level of deposit funding in the banking system by influencing reserves that banks hold (liabilities of the central bank). Take a quantitative tightening episode. If the central bank sells government bonds directly to the banking sector, there is a change in the composition of the sector's asset portfolio (reserves are swapped for bonds) but the level of bank deposits remains unchanged (Graph 1.B). By contrast, if the central bank sells the bonds to non-banks, the latter would use transaction deposits to make the payment, resulting in a decline in the banking sector's balance sheet and, in particular, deposit funding (Graph 1.C).
Withdrawn transaction deposits that are not repaying bank lending or driven by central bank asset sales are bound to circle back to the banking system (with some exceptions).4 The immediate proceeds of a deposit withdrawal are a means of payment, which the depositor transfers but does not destroy. Even so, the composition of bank funding may change. For instance, if the NFS withdraws deposits and shifts the funds to an NBFI, the NBFI could directly deposit those funds again or provide repo funding to banks (Graph 2.A). In this case, deposits from the NFS fall, but funding from NBFIs rises by an equivalent amount. Alternatively, the NBFI could invest in banks' debt securities (eg a money market fund buying bank commercial paper). In this case, the level of deposits in the banking sector falls, but debt security funding increases by an equivalent amount (Graph 2.B). Even though the chain of events may be longer, the robust takeaway is that a deposit withdrawal from a bank is not equivalent to a deposit funding decline in the banking system.
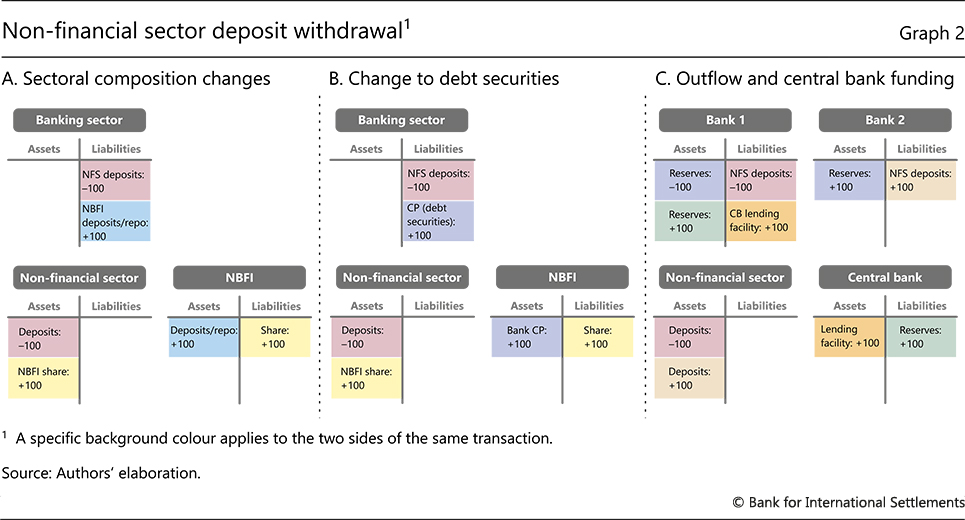
The central bank can backstop the evaporation of funding at specific banks – eg in deposit runs – by providing lending facilities. For instance, if the NFS switches its deposits from one bank to another, a central bank lending facility would eliminate the need for the former bank to reduce its balance sheet (Graph 2.C). Rather, that bank would experience a change in its funding composition.
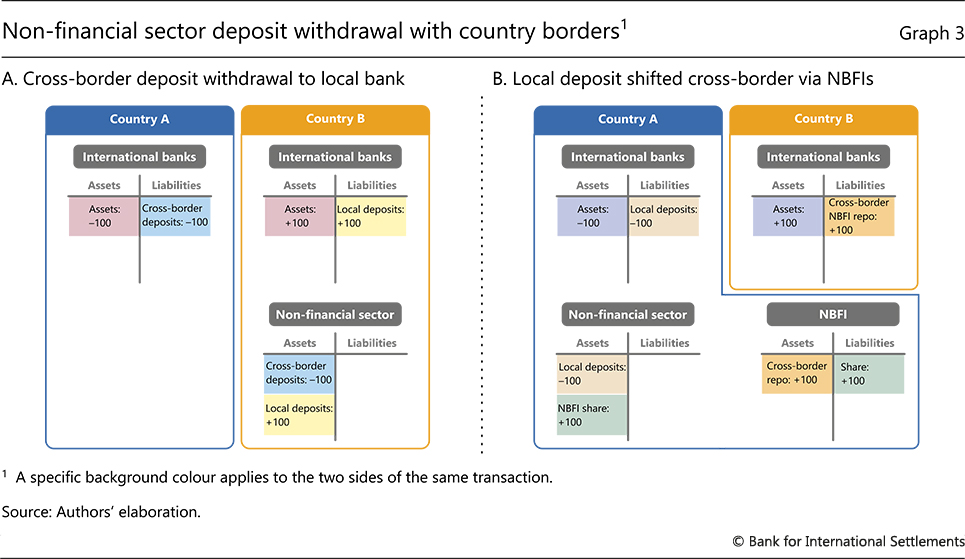
These simple examples illustrate how the level and composition of bank funding (notably deposits) can change in a global system but abstract from deposit funding reallocation across country boundaries. Keeping global deposits fixed, deposits in one jurisdiction might decline if a cross-border depositor shifts those funds back home (Graph 3.A). Similarly, deposits can fall when resident depositors shift funds to a bank located abroad. This geographic reallocation could involve an initial shift of deposits to NBFIs which then invest in banks abroad (Graph 3.B). In this case, the source of deposit funding in the global banking system would change both sector and country.
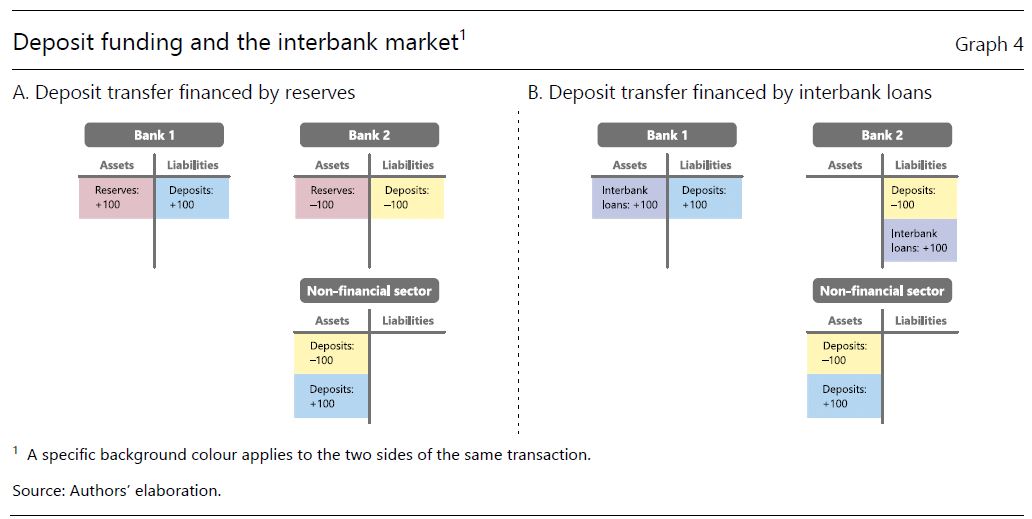
The balance sheet of the banking system swells or contracts as banks borrow from and lend to each other, without changing their aggregate exposure to non-banks. For example, when an NFS depositor moves its funds from one bank to another, the involved banks can finance the transfer by reallocating reserves (Graph 4.A) or by creating an interbank loan (Graph 4.B). In the latter case, examining only bank liabilities will indicate that deposit funding increased, even though the links between the non-bank and bank sectors have not changed. Focusing on non-bank deposit funding while also accounting for the reallocation of deposit funding between banks thus calls for subtracting changes in interbank claims from the corresponding changes in interbank liabilities at the country level.
Bank funding in the BIS locational banking statistics
To trace the evolution of bank deposit funding, one would ideally have complete coverage of all banks. In addition, one would need consistent information on different funding instruments and different types of funding providers, across banks in all countries.
The BIS locational banking statistics (LBS) come closest to such a data set. They contain aggregate balance sheet information for internationally active banks worldwide, organised by bank location. They split bank liabilities by instrument: deposit funding (referred to as "loans and deposits" in the data), debt securities and other.5 Deposit funding – comprising traditional customer deposits, repos and interbank lending – is the largest category, accounting for over 80% of bank liabilities in the LBS, and the focus of the analysis below. In turn, debt securities comprise bonds as well as commercial paper and negotiable certificates of deposit.6 The LBS also offer information on the sector of the bank's lender: bank (split into central banks and commercial banks), non-bank financial and non-financial sectors. Collected on a consistent basis across most major banking jurisdictions, these data form the basis for our analysis.
However, the LBS coverage is incomplete and can thus indicate spurious deposit funding changes. First, it excludes the activity of purely domestic banks. As a result, when depositors transfer money from international banks (in the BIS banking statistics) to purely domestic banks (not in the BIS statistics),7 the level of deposit funding in a country's banking sector is unchanged but will be recorded as a decline (Graph 5.A). The opposite of this case occurred in the United States during Q1 2023, as deposits were moved from regional banks to large international banks (Luck et al(2023)). Still, international banks are typically large and so their positions tend to capture significant domestic banking activity (Avdjiev et al (2015)).8
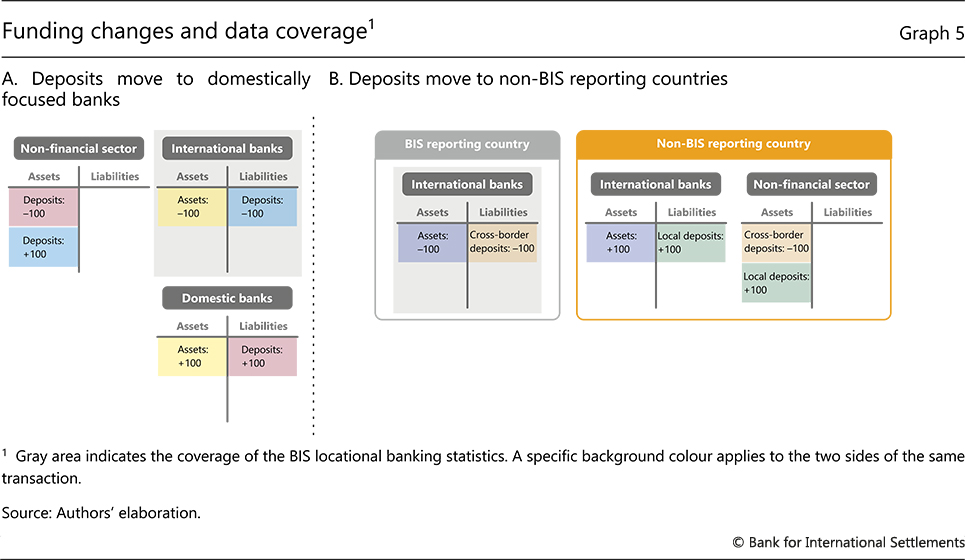
Second, though the LBS already have wide country-level coverage of the major banking jurisdictions, not all countries report to the BIS. A cross-border reallocation of deposits therefore can appear spuriously as a decline in deposits at the global level. This would be the case if a deposit is transferred from a BIS reporting country to a non-BIS reporting country (Graph 5.B).9
Third, some countries report only limited instrument or counterparty sector breakdowns, or only cross-border positions. We focus our analysis on deposit funding in jurisdictions that include local positions with sectoral breakdowns in the LBS. This includes Switzerland, the United Kingdom and 25 other economies, but notably excludes Japan, China and the United States. To establish the broad pattern of deposit funding growth worldwide, we consider the growth rate of deposit funding in our main sample alongside that of total deposits from national data (for the United States and China) and total liabilities in the LBS (for Japan). We also examine the cross-border deposit funding flows for the US, Japan and China.
We analyse deposit funding flowsbetween banks and non-banks. We thus subtract changes in interbank claims from those of interbank liabilities at the country level.10 This reduces the size of deposit funding flows in our sample by about 55% over the past five years. The flows we work with are adjusted for valuation effects from exchange rate movements as well as for breaks in series.
Recent developments in deposit funding
With our framework in hand, we examine the recent developments in international banks' deposit funding, as captured by the LBS. We first present aggregate developments for our core sample. We then zoom in on the quarter of the banking turmoil (Q1 2023) and examine deposit reallocation across and within countries. The analysis then turns to the case of Switzerland.
Aggregate changes in deposit funding
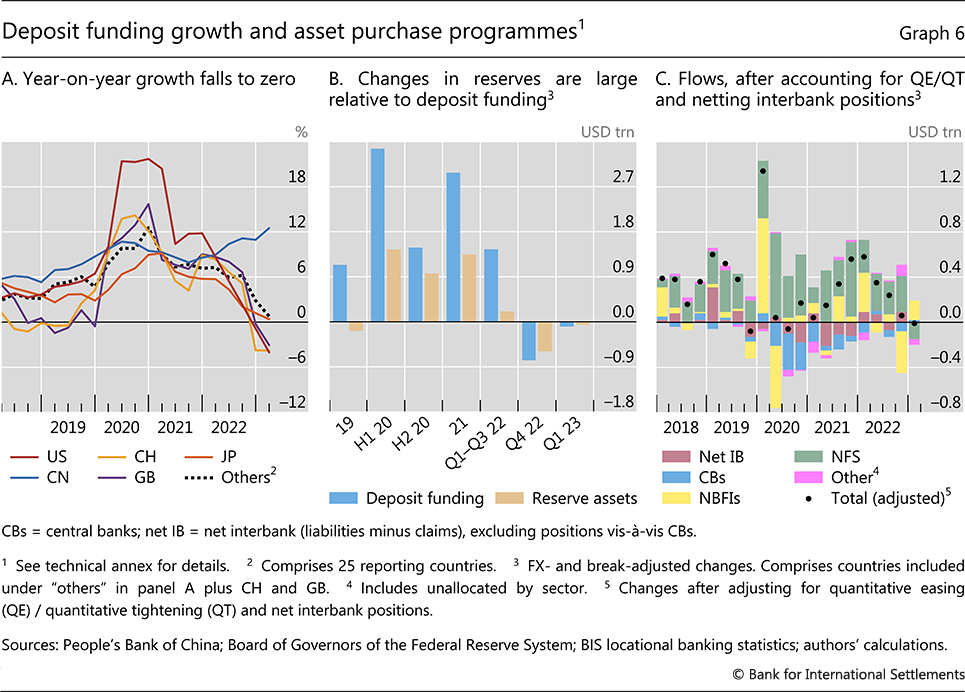
The growth in deposit funding in major jurisdictions slowed from its 2020 peaks to near zero by Q1 2023. Banks located in the United States, the United Kingdom and Switzerland saw negative year-on-year growth in Q4 2022 and Q1 2023 (Graph 6.A). This slowdown over the last four to five quarters of the data coincides with a period of tightening monetary policy that reduced reserves in the banking system and disincentivised banks to lend.
Central bank asset purchases and sales were a key driver of banks' balance sheet size over the past four years and so can obscure other concurrent drivers of deposit funding. As an initial unwinding of quantitative easing got under way in the second half of 2022, many countries11 saw a decrease in banks' reserve assets (Graph 6.B). As illustrated by our framework (Graph 1.C), this mechanically leads to a drop in deposits when non-banks purchase government bonds from the central bank. To gauge this effect, we compare changes in reserves – except those offset by banks purchasing or selling government bonds (Graph 1.B) – and changes in deposits.12 We find that the size of reserve changes was about 30% of the change in deposits over the past five years, and three quarters of the declines in Q4 2022 and Q1 2023.
Further reading:
We further allocate the aggregate reserve-driven decline in deposit funding by the sector of the funding counterparty. We do so by examining how changes in reserves correlate with changes in sector-level deposits from Q1 2018 to Q1 2023 (see technical annex). For every $1 increase/decrease in reserves, this analysis attributes $0.40 to central bank funding, $0.26 to cross-border net interbank funding, $0.19 to domestic NFS deposit funding and $0.11 to NBFI deposit funding.13
After filtering out the mechanical impact of reserves, we look under the hood of aggregate changes in deposit funding during the banking turmoil. We find that these changes are consistent with a reallocation of the source of funding: from the NFS to NBFIs (as in Graph 2.A). The change in Q1 2023 is effectively nil (Graph 6.C, black dots). Zooming in on NFS deposit funding, we see that it decreased, even if by a relatively small aggregate amount: $0.14 trillion, or 0.5% of the $25 trillion in amounts outstanding. Notably, this is the only decline in NFS deposit funding over the past 21 quarters in the data for our sample of countries. It was mirrored by a $0.17 trillion increase in deposit funding from NBFIs.
Deposit funding reallocation within and across countries
Digging deeper into the Q1 2023 evolution of deposit funding reveals that it involved domestic rotations of sources within a handful of jurisdictions.14 Banks in the United Kingdom in particular saw the largest increase in local funding from NBFIs – $50 billion – alongside a $43 billion decline in NFS deposits (Graph 7.A). The picture was similar in Canada and Italy.
In another likely example of funding circling back to banks, NBFIs also provided cross-border deposit funding in Q1 2023. In a wider sample of countries that report cross-border positions in the LBS, the United States was the largest source country for cross-border NBFI funding (Graph 7.B). Consistent with this, in Q1 2023 entities in the United States shifted their (largely US dollar) bank deposits into money market funds (MMFs), most likely in search of higher returns as interest rates on deposits lagged policy rates (Box A).15 Those MMFs, in turn, increased their dollar lending to banks headquartered outside the United States (as in Graph 3.B). NBFIs in financial centres, such as Luxembourg, Ireland and the Cayman Islands, also increased their funding to banks located abroad (Graph 7.B). The bulk of this was also in dollars.
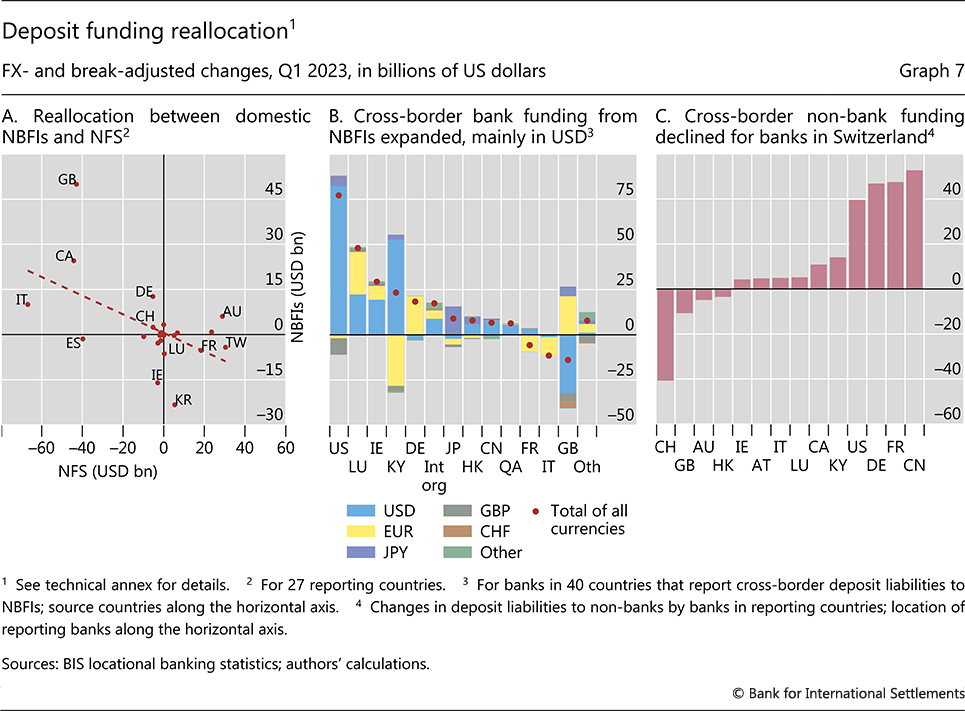
Cross-border deposit funding evolved noticeably for a few key jurisdictions in Q1 2023. Such funding declined the most for banks located in Switzerland, by $41 billion (Graph 7.C). It also decreased for banks in the United Kingdom, by $10 billion. In contrast, banks in the United States, Germany, France and China saw cross-border non-bank deposit funding increase by more than $40 billion each.
The case of Switzerland
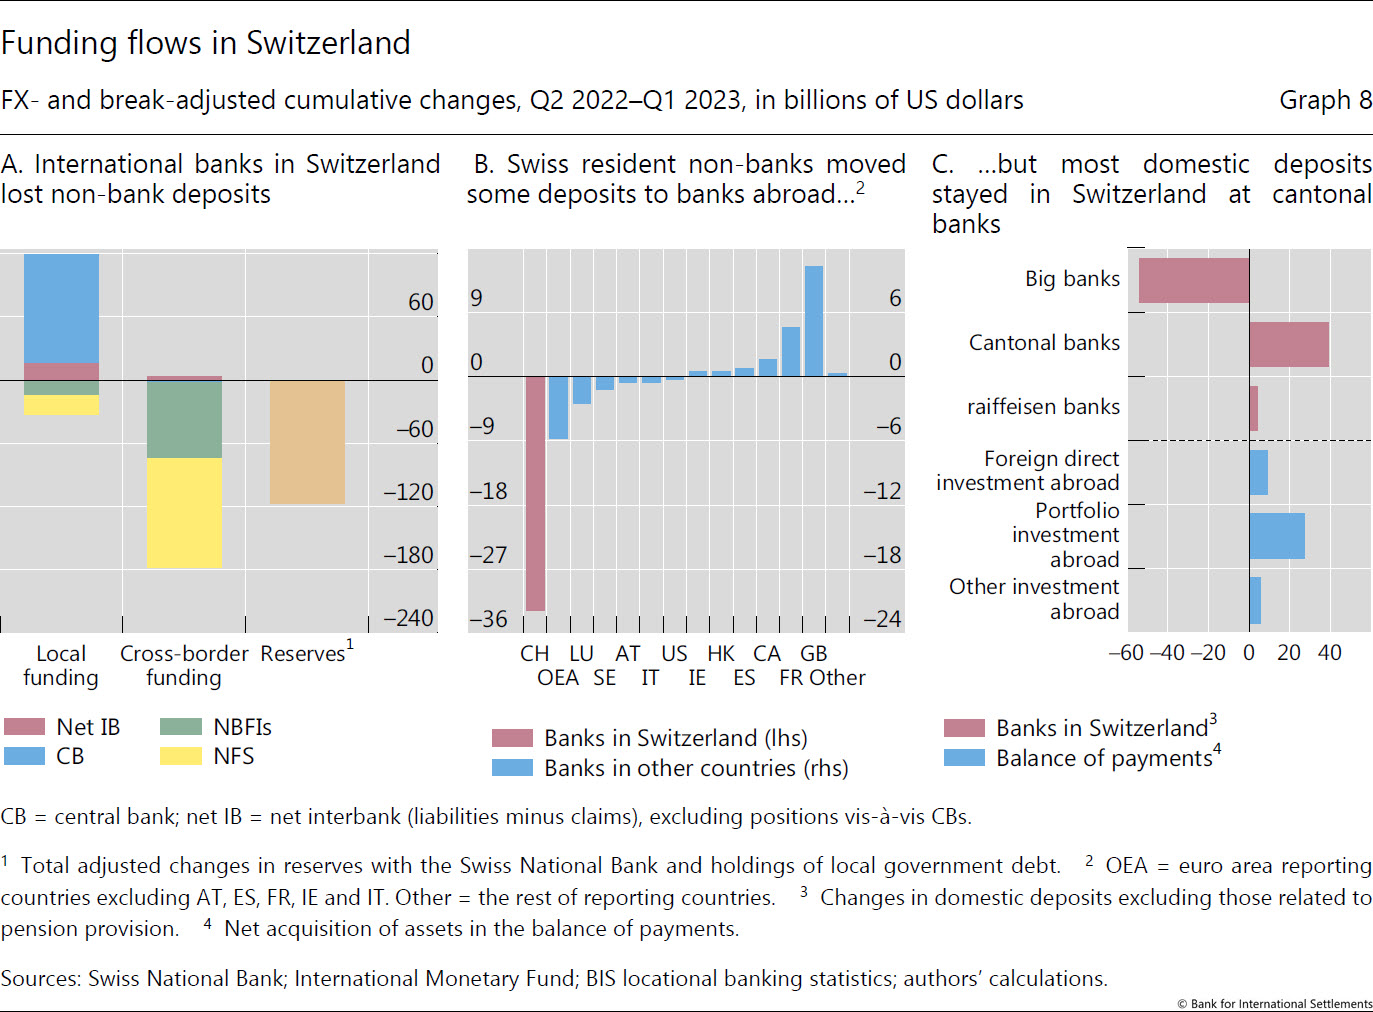
While Switzerland was a key jurisdiction during the Q1 2023 banking turmoil, the deposit decline for internationally active banks there had started earlier. From Q2 2022 to Q1 2023, both resident and non-resident non-banks (NFS and NBFI) reduced their funding of international banks in Switzerland – by about $30 billion and $180 billion, respectively (Graph 8.A). This amounted to a 12% year-on-year fall in bank deposit funding, the largest since the Great Financial Crisis. Part of the decline corresponds to a decrease in reserves, which fell by about $120 billion.16 Adding net funding from the banking sector, there was a decline of $71 billion in deposit funding for international banks in Switzerland not connected to the decrease in reserves. This loss of deposit funding was compensated by the $102 billion of funding provided by the central bank (see Graph 2.C).
Zooming in on Swiss residents, they appeared to reallocate their deposit funding from international banks in three different ways. First, they increased their cross-border deposit funding, notably at banks in the United Kingdom (Graph 8.B). Second, data from the Swiss National Bank reveal that they increased their deposits at domestically oriented banks in Switzerland (Graph 8.C, red bars). Indeed, cantonal (regional) and raiffeisen (cooperative) banks in the country saw a rise in deposits equal to roughly 80% of the decline at big banks. The LBS miss this reallocation, as most of these domestically focused banks are not in the reporting population (as illustrated in Graph 4.A).17 Third, some deposits were probably reallocated to NBFIs which lent abroad in the form of securities (as in Graph 4.B). In line with this, the balance of payments data show that residents of Switzerland increased their holdings of debt and equity securities (ie portfolio investment) abroad (Graph 8.C, blue bars).18 The overall drop in domestic Swiss deposits from Q2 2022 to Q1 2023 was nevertheless small (a 1% change), as most of the deposit funding decline from international banks ended up at other banks in Switzerland.
Conclusion
Focusing on the evolution of international banks' deposit funding from the non-bank sector, we find that the banking turmoil in Q1 2023 did not spark a widespread contraction. A few jurisdictions did see a retreat of deposit funding from the NFS. But the broader picture revealed that NBFIs were probably on the receiving end and replaced the NFS as providers of bank funding. This rotation could have reflected concerns about the health of some banks or a search for higher returns.
The shift to NBFIs as funding providers is a trend that has been under way in the banking sector over the past decade (Aldasoro et al (2020)). Importantly, deposit funding from NBFIs can be particularly sensitive to changes in market conditions (Franceschi et al (2023)). Thus, while the feared funding shortages did not generally materialise, the continued changes to the composition of bank funding can have implications for financial stability.
References
Acharya, V, R Chauhan, R Rajan and S Steffen (2023): "Liquidity dependence and the waxing and waning of central bank balance sheets", NBER Working Paper, no 31050.
Afonso, G, C Huang, M Cipriani, H Abduelwahab and G La Spada (2023): "Monetary policy transmission and the size of the money market fund industry: an update", Liberty Street Economics, Federal Reserve Bank of New York, 3 April.
Aldasoro, I, W Huang and E Kemp (2020): "Cross-border links between banks and non-bank financial institutions", BIS Quarterly Review, September, pp 61–74.
Aquilina, M, A Schrimpf and K Todorov (2023): "CP and CDs markets: a primer", BIS Quarterly Review, September, pp 63–76.
Avdjiev, S, P McGuire and P Wooldridge (2015): "Enhanced data to analyse international banking", BIS Quarterly Review, September, pp 53–68.
Avdjiev, S, M Everett and H S Shin (2019): "Following the imprint of the ECB's asset purchase programme on global bond and deposit flows", BIS Quarterly Review, March, pp 69–81.
Bank for International Settlements (2015): "Introduction to BIS statistics", BIS Quarterly Review, September, pp 35–51.
Borio, C, B Hofmann and E Zakrajšek (2023): "Does money growth help explain the recent inflation surge?", BIS Bulletin, no 67.
Borio, C, R McCauley and P McGuire (2022): "Dollar debt in FX swaps and forwards: huge, missing and growing", BIS Quarterly Review, December, pp 67–73.
Garcia, L, U Lewrick and T Secnik (2021): "Is window dressing by banks systemically important?", BIS Working Papers, no 960.
Franceschi, E, M Grodzicki, B Kagerer, C Kaufmann, F Lenoci, L Mingarelli, C Pancaro and R Senner (2023): "Key linkages between banks and the non-bank financial sector", ECB Financial Stability Review, May.
Luck, S, M Plosser and J Younger (2023): "Bank funding during the current monetary policy tightening cycle", Liberty Street Economics, Federal Reserve Bank of New York, 11 May.
Technical annex
The sample of 27 reporting countries comprises AT, AU, BE, BM, BS, CA, CH, CY, DE, ES, FR, GB, GG, GR, ID, IE, IM, IT, KR, LU, MY, NO, PT, SA, SE, TW and ZA. These countries report instrument and detailed sector breakdown of local and cross-border deposit liabilities of banks in their jurisdictions.
Graph 6.A: For US, total deposit liabilities of all commercial banks (Federal Reserve H8 release). For CN, total deposit liabilities of "other depository corporations". For CH and GB, data as reported in the LBS. For JP, total liabilities (including trustee liabilities) of banks, reported in LBS. "Other" comprises 25 out of the sample of 27 reporting countries and excludes CH and GB, which are shown individually.
Graph 6.B: Relates to total of local and cross-border deposit liabilities to all sectors including central banks and unallocated by sector, after netting of interbank deposits and interbank loans (excluding central banks), for the sample of 27 reporting countries.
Graph 6.C: We compare changes in reserves with changes in different segments of deposits across our sample of countries to get an average response of deposits to changes in reserves. This is implemented via the regression  where c indexes the bank's country, i indexes the counterparty sector of banks' liabilities and tindexes the quarter of the observation. Reservesc,t is banks' claim on the central bank of country c in quarter t less any offsetting flows of local claims on local currency government debt (capped at a maximum offset of the size of the reserve change).
Graph 7.A: Relates to the sample of 27 reporting countries.
Graph 7.B: Countries listed on the x-axis are those with absolute amounts of $5 billion or more. International organisations include regional development banks.
Graph 7.C: Reporting jurisdictions, excluding DK and NL, with an absolute change of $3.5 billion or more are shown on the x-axis. Japan also recorded a large increase but is excluded for confidentiality reasons.
1 We thank Iñaki Aldasoro, Douglas Araujo, Stefan Avdjiev, Claudio Borio, Stijn Claessens, Patrick McGuire, Benoît Mojon, Andreas Schrimpf, Hyun Song Shin, Jhuvesh Sobrun, Nikola Tarashev and Philip Wooldridge for helpful comments. Swapan-Kumar Pradhan provided excellent research assistance. All errors are our own. The views expressed are those of the authors and do not necessarily represent those of the Bank for International Settlements.
2 This sample is selected based on countries that report local and cross-border positions, with breakdowns by instrument and sector.
3 See the annex of Borio et al (2023) for further discussion. Note that banks' capital adequacy, regulation and supervision will impose limits on the degree of their expansion.
4 The level of transaction deposits could also be affected by non-banks withdrawing deposits and holding them as physical cash, or by NBFIs placing withdrawn funds at the central bank (eg, in the United States, via the Federal Reserve's Overnight Reverse Repo Facility (ON RRP)). That said, holding large amounts of physical cash is less common in the modern financial system, given restrictions on physical cash payments. In addition, while funds placed in the ON RRP increased over 2021, the facility's size remained rather constant from Q3 2022 to Q1 2023, including during the March 2023 banking turmoil.
5 Recent data include cross-border derivatives. The reporting of this category is incomplete, and so is not considered in the analysis. See Borio et al (2022) for further discussion of banks' off-balance sheet funding via derivatives.
6 Aquilina et al (2023, in this issue) provide a primer on the market for commercial paper and negotiable certificates of deposit, which also features non-banks as issuers and banks as investors.
7 A few reporting countries include domestic-only banks in their reporting population.
8 For most countries, more than 80% of domestic non-bank lending is covered. This share is lower in some jurisdictions with large domestically focused banks (eg Brazil, Korea).
9 The two scenarios in Graph 5 are indistinguishable on the basis of the BIS LBS alone.
10 The incomplete data coverage in the LBS implies that interbank positions would not net out to zero (either domestically or cross-border). However, in practice, the LBS capture most domestic banking activity in many jurisdictions (Avdjiev et al (2015)) and around 95% of all cross-border interbank activity (BIS (2015)), so aggregate interbank liabilities and claims typically match closely. Netting interbank positions also allows us to abstract from seasonal patterns in aggregate cross-border interbank positions, driven in part by large banks' window dressing at year-ends for regulatory purposes (Garcia et al (2021)).
11 Most central banks in our sample operate a floor system for reserves and shrank their balance sheets in the second half of 2022. A few emerging market economy central banks – operating corridor systems – kept their balance sheet unchanged.
12 While the mechanical impact of reserves on deposits is symmetric for both quantitative easing and tightening, the monetary and financial stability implications need not be (Acharya et al (2023)).
13 The remaining sectors did not have a statistically significant relationship; the unattributed changes in reserves are incorporated into the unallocated sector.
14 The available data do not allow us to filter out the mechanical effect of reserves at the level of both individual jurisdictions and specific sectors. Given the subdued quantitative tightening in Q1 2023, this should not affect our analysis.
15 Over Q1 2023, this amounted to about 2% of outstanding deposits in US domestically chartered banks.
16 Sight deposits of domestic banks placed at the Swiss National Bank – which constitute the bulk of bank reserves in Switzerland – fell by about CHF 180 billion (about USD 200 billion) during this period.
17 The data on system deposits provided by the Swiss National Bank are not collected on the same basis as for the LBS data. Hence, the series cannot be used to exactly decompose the reallocation of Swiss resident deposits in the LBS data.
18 There is no evidence that deposit funding circled back to banks as investment in their debt securities (which declined), as depicted in Graph 2.B.