International banking amidst Covid-19: resilience and drivers
The claims of international banks held up well during the Covid-19 crisis, although economic output fell by even more than during the Great Financial Crisis (GFC). Both cross-border and local claims were resilient, in advanced and emerging market economies alike. Looking at lending to the real economy, we examine how borrower and lender characteristics relate to the growth of claims on the private non-financial sector during the pandemic. We find that countries with stronger economic activity and smaller financial vulnerabilities borrowed more. Likewise, better capitalised banking systems lent more. The economic stress also led advanced economy borrowers to draw on pre-existing credit lines from foreign banks.1
JEL classification: F34, G01, G21.
A decade after the Great Financial Crisis (GFC) a new, very different kind of crisis has hit us. The Covid-19 shock originated outside the financial sector. As it forced major economies into lockdown, economic activity contracted abruptly in the second quarter of 2020, undercutting output even more sharply than during the GFC. A strong policy response sought to contain the economic fallout. In line with these objectives, international banks' claims2 have held up well, as reflected in the BIS international banking statistics (IBS).
This resilience was broad-based through the first months of the Covid-19 outbreak. It featured in both the cross-border and local claims of international banks. It also characterised their claims on both advanced and emerging market economies (EMEs). And it was seen in year-on-year growth rates, which address seasonality issues while taking into account all available data that reflect the pandemic.
Concretely, aggregate cross-border bank claims, on financial and non-financial borrowers combined, grew by 4.8% through mid-2020. This contrasts with a 5.2% decline in the year to end-2008, amidst the GFC. The most recent year-on-year growth was due mainly to a $2.7 trillion increase in Q1 2020, which prevailed over a $1.2 trillion decline in Q2 2020, both driven primarily by claims on advanced economy (AE) financial sector borrowers. Likewise, foreign banks' local claims in local currency grew by 8.6% year on year through mid-2020, driven largely by Q1 claims on AE central banks.
Key takeaways
- Banks' cross-border claims held up during the pandemic's first wave, growing by almost 5% year on year through mid-2020.
- Year on year, countries with stronger economies and smaller financial vulnerabilities borrowed more, and better capitalised international banks lent more.
- Funding stress also led borrowers to utilise pre-existing credit lines from banks, driving up claims.
Foreign claims on the private non-financial sector - a gauge of direct lending to the "real economy" - also remained robust. Through mid-2020, they fell by 0.5% year on year. This decline pales in comparison with that at the onset of the GFC, when foreign claims on private non-banks fell by 11.8% year on year through end-2008.3 This suggests that, in contrast to the GFC, banks served as a reliable first line of defence. Aided by swift policy action, they helped to mitigate economic stress in the pandemic's early stages (BIS (2020)).
To investigate the drivers of claims on the private non-financial sector, we look at characteristics of the borrower country and the lending banking system. We find that countries with stronger economic activity and smaller financial vulnerabilities borrowed more in the pandemic's opening months. In addition, better capitalised banking systems lent more. Despite the pandemic-related stress, banks accommodated the drawdown of pre-existing credit lines, thus supporting the flow of international credit, especially to non-financial entities in advanced economies.
The rest of this article is organised as follows. The first section documents how international banks' claims evolved, across regions and counterparty sectors. The second decomposes banks' claims on the private non-financial sector into borrower- and lender-related components. The final section concludes.
The resilience of international banks' claims
How did international banks' claims evolve amidst the pandemic? To answer this question, we compare year-on-year claims growth through mid-2020 (including the first full quarter after the initial Covid-19 shock, which is the most recent quarter in the current IBS) with that through end-2008 (that is, through the first full quarter of the GFC after the Lehman shock). We focus on year-on-year claims growth for two main reasons. First, to abstract from seasonality effects that are particularly strong around year-ends, in part due to window-dressing. Second, to capture all pandemic-related responses - such as quantitative easing, central bank swap lines and the drawdown of credit lines - that affected international banking and cut across both the first and second quarters of 2020.
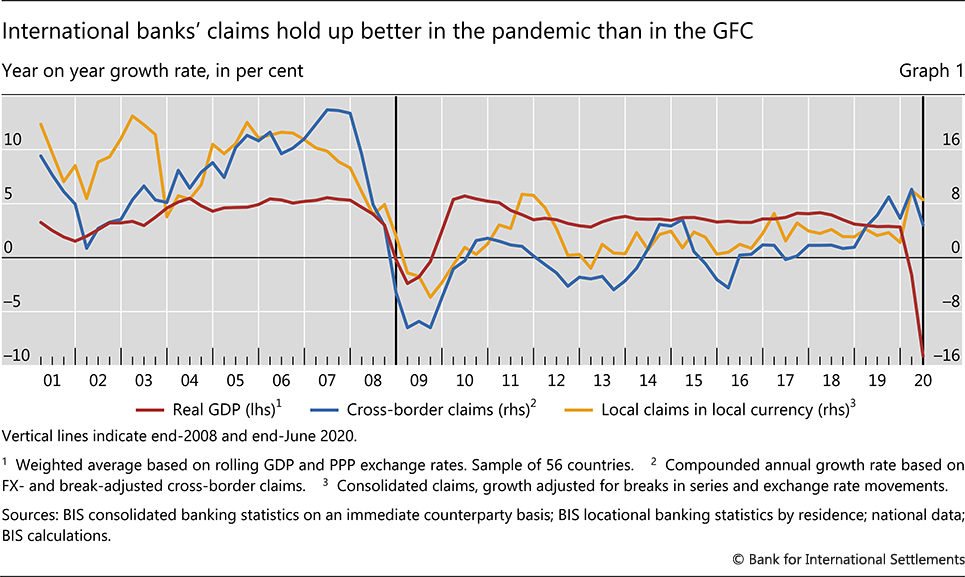
Overall, international banks' claims proved to be strikingly resilient when compared with the GFC (Graph 1). Year on year, the drop in global output was 9.1% through mid-2020, much larger than the 0.2% decline through end-2008 (red line). Yet, global cross-border claims grew by 4.8% through mid-2020 (blue line). Indeed, this marked one of the highest yearly growth rates since the GFC, in sharp contrast with the 5.2% decline through end-2008. Similarly, local claims in local currency also grew year on year at a historically high rate of 8.6% through mid-2020 (yellow line). Again, the contrast is sharp with the GFC: through end-2008, these claims grew by only 3.2%.4 Besides banks' resilience, the recent strong growth also reflects high borrowing needs in the face of lockdowns.5
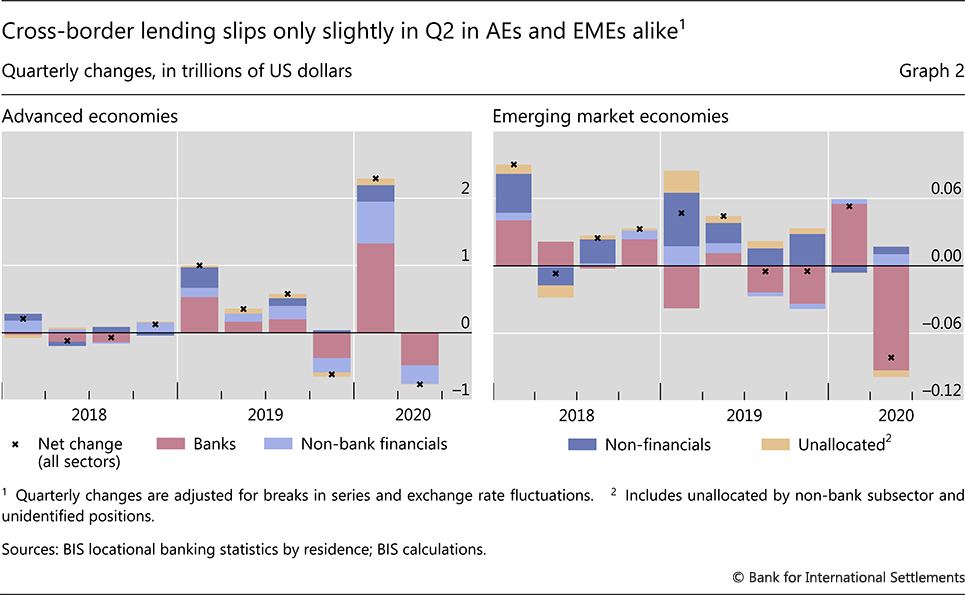
We next zoom in on cross-border bank claims in Q2 2020, which is the first full quarter of the pandemic and is less likely to be subject to seasonality effects than Q1 (Graph 2). Claims on AE borrowers declined by $0.8 trillion in Q2, or by 3.3% of the outstanding amount in Q1 (Graph 2, left-hand panel). This decline was driven entirely by claims on banks (red bars) - split roughly 60-40 between related and unrelated institutions - and, to a lesser extent, on non-bank financial borrowers (light blue bars). The large Q2 decline in inter-office positions vis-à-vis related banks came on the heels of an even bigger increase in Q1. Both moves reflect in part the use of AE central banks' swap lines (Aldasoro et al (2020)).6 More generally, swings in interbank claims are consistent with adjustments for liquidity management purposes, which need not underpin new lending to the real economy.
In EMEs, cross-border bank claims declined by $0.1 trillion in Q2 (or by 2% of the outstanding amount in Q1; Graph 2, right-hand panel). Claims on unrelated banks and central banks explain over two thirds of this decline. Claims on non-bank financial entities actually increased, but given the minor role of these institutions in EMEs, the change did not make a difference overall.
Cross-border claims on the non-financial sector remained largely unchanged for both AE and EME borrowers in Q2 2020 (Graph 2, dark blue bar). The non-financial sector includes a private component - lending to which may support consumption and real investment - and a public component - lending to which may also support real economic activity through fiscal spending or guarantees.
Local claims of foreign banks also held up in Q2 2020 (Graph 3).7 In the case of AE borrowers, these claims declined by $0.1 trillion (or by about 1.6% of the outstanding amount in Q1), following a large Q1 increase (left-hand panel). This increase was due largely to unconventional monetary policy in AEs. Quantitative easing (QE) was financed with additional bank reserves in the financial system, which are included in reporting banks' local claims on the central bank (part of the red bar).8 Turning to our sample of borrower EMEs,9 foreign banks' local claims showed an increase in Q1 ($51 billion) and a decrease in Q2 ($18 billion; right-hand panel). Claims on central banks swung less in these countries, reflecting their more limited use of unconventional measures.
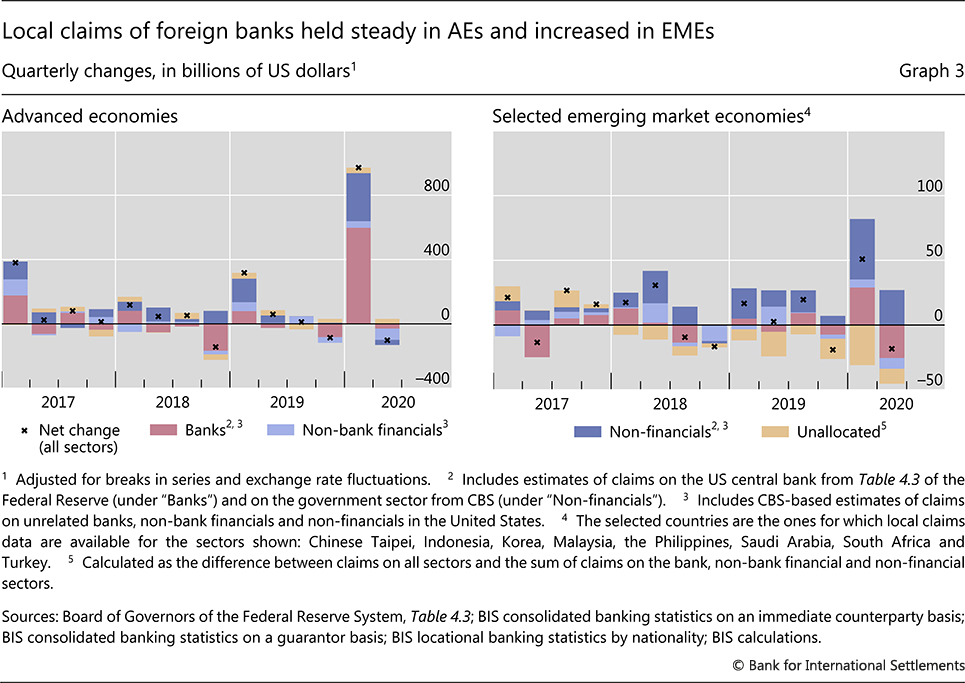
Local claims on the non-financial sector were sustained in the first months of the pandemic (Graph 3, dark blue bar). These claims - funding both private and government activities - fell in AEs (by $33 billion) and expanded in our sample of EMEs (by $27 billion) in Q2 2020. Together with similar findings above on cross-border claims, this suggests that stronger post-GFC balance sheets have allowed banks to mitigate the pandemic shock and shield non-financial borrowers to a significant extent.
Drivers of foreign banks' claims on the private non-financial sector
To investigate borrower- and lender-specific drivers of direct lending to the real economy, we focus on international banks' claims on the private non-financial sector.10 For this, we use the consolidated banking statistics (CBS), which group lender banks according to nationality, thus allowing us to study how features of national banking systems - in addition to borrowing country characteristics - could have influenced foreign credit. As above, we examine year-on-year growth through mid-2020.
The characteristics of borrowers or lenders can help explain a change in claims only to the extent that this change can be attributed to the respective counterparty. We thus rely on a methodology that delivers a specific (purely accounting) attribution, decomposing claim flows into three mutually exclusive parts: a borrower country-specific component (hereafter, "borrower-side"), a lending banking system-specific component ("lender-side"), and a common component (see box).11 In our context, the first two components capture, respectively, the extent to which a country stands out relative to other borrowers and the extent to which a lender stands out relative to other banking systems; the common component is, by construction, uniform across both lenders and borrowers and cannot be attributed.
Further reading
Borrower- and lender-side components are likely to reflect borrowing country and lending banking system characteristics that influence claims growth. However, they need not correspond exactly to demand or supply factors, respectively. For instance, government guarantees in a borrowing country can support credit supply by reducing risks to the lender. Alternatively, any pre-existing credit lines of a banking system may accommodate credit demand in borrowing countries.
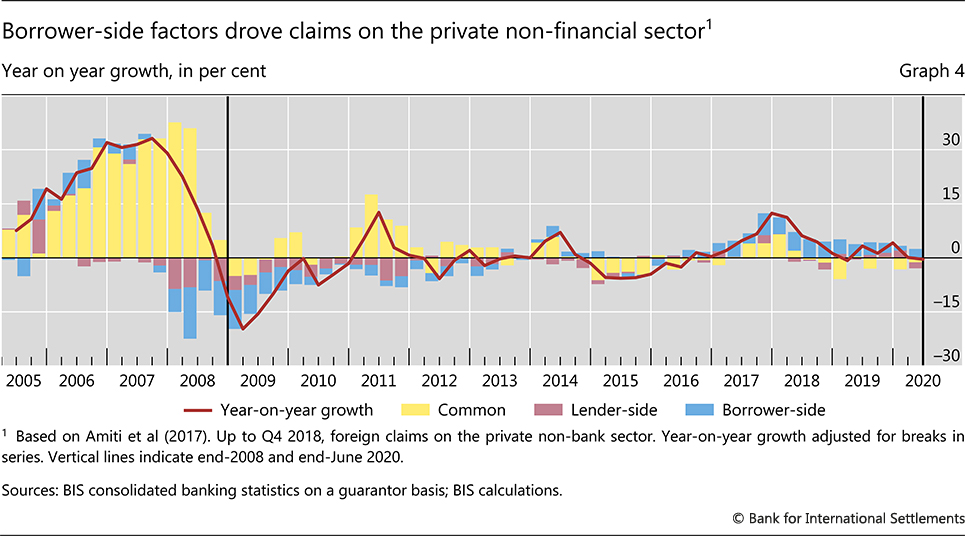
Our decomposition offers a new angle on how claims on the private non-financial sector during the initial phase of the Covid-19 pandemic differed from those in the GFC (Graph 4). The borrower-side component contributed 2.5 percentage points to the overall growth rate through mid-2020 (blue bar). At the same time, the common component (yellow bar) and the lender-side component (red bar) were negative, subtracting 1.2 and 1.6 percentage points, respectively. By contrast, both lender- and borrower-side components were negative at the outset of the GFC, with the borrower-side component contributing 9.5 percentage points to the decline in foreign claims on the private non-bank sector through end-2008 and the lender-side another 6.4 percentage points.12
Decomposing lending growth into common, lender- and borrower-side components
We decompose growth in international banks' claims into three non-overlapping and exhaustive components: a lending banking system-specific (henceforth lender-side) component, a borrower country-specific (henceforth borrower-side) component, and a common component. To this end, we follow the methodology in Amiti and Weinstein (2018) as applied to the BIS international banking statistics (IBS) in Amiti et al (2017).
The methodology attributes claims growth to lenders and borrowers. To fix ideas, consider the year-on-year growth in the claims of lending banking system l on borrowers in country b (Ll,b,t), as shown in the left-hand side of equation (1). For each quarter t, we construct lender-side components specific to each lending banking system ( ) and borrower-side components specific to each borrower country (
 ). This construction is based on regressions with fixed effects for each lender banking system in each quarter and for each borrower country in each quarter. From these, we extract a common component γt, which equals the median of all
  's and
  's in quarter t, and is thus constant in the cross section. We then remove the common component from the computed supply- and demand-side components to obtain
 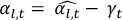 and
and 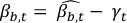 , yielding the decomposition seen on the right-hand side of equation (1):

To aggregate this decomposition at the lender banking system or borrower country level, we weight the bilateral growth observations according to the corresponding stock of claims at the beginning of the quarter. This gives more weight to large observations, which are more important in explaining the overall lending growth for a given lender or borrower. With these weights, the three components sum exactly to the aggregate growth for a given lending banking system or borrower country.
The lender- and borrower-side components differ substantially across countries (Graph A). For instance, the borrower-side components in Q2 2020 range from 12.7 percentage points in the case of the Netherlands to -8.4 percentage points in that of Mexico (right-hand panel).
For a complete discussion of the underlying method, see M Amiti and D Weinstein, "How much do idiosyncratic bank shocks affect investment? Evidence from matched bank-firm loan data", Journal of Political Economy, vol 126, no 2, 2018 and M Amiti, P McGuire and D Weinstein, "Supply- and demand-side components in global banking", BIS Working Papers, no 639, 2017. Also published as "International bank flows and the global financial cycle", IMF Economic Review, vol 67, no 1, March, 2018, pp 61-108.
Before delving into borrower- and lender-side components, we stress that the common component is likely to reflect global factors. A key example of such factors is the large and synchronised strengthening of liquidity and capital positions across most banking systems, due to the post-GFC regulatory reform (Lewrick et al (2020)). This reform has likely contributed to dampening the decline of the common component through the Covid-19 shock.
Borrower-side factors
Since the Covid-19 shock originated outside the financial system, we might expect borrower-side factors to be the main drivers of claims growth. To capture such factors, we examine such characteristics of the borrower countries as their pre-existing financial vulnerabilities and measures of the pandemic's severity, together with their policy responses and pre-existing credit commitments. We then examine whether these characteristics may explain cross-country differences in the borrower-side component in the year-on year growth of foreign claims on the private non-financial sector through mid-2020.13
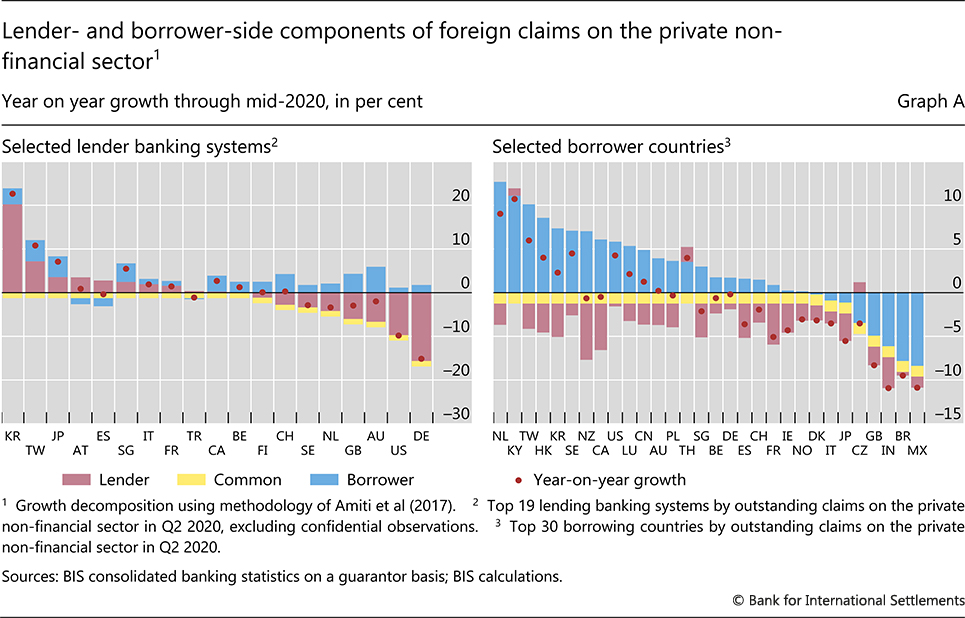
Pre-existing vulnerabilities - in the public or private sectors - seem to have reduced the borrower-side component (Graph 5, left-hand panel). Concretely, high government debt is strongly associated with a decline in this component. One potential reason is that lenders might perceive less indebted countries, and borrowers resident there, as more creditworthy. Likewise, overheating in markets for private sector debt, as proxied by a higher credit-to-GDP gap,14 is associated with a decline in claims growth, although to a lesser extent.
The pandemic's severity and the policy countermeasures relate to the borrower-side component to a varying extent. On the one hand, Covid-19 cases per capita may not accurately capture the state of the economy, as they correlate only weakly with this component.15 Policy responses to the pandemic, on the other hand, show far stronger relationships. Public health measures, such as stricter lockdowns, have a strong negative correlation with the borrower component. In the short run, a stricter lockdown weighed on economic activity (Graph 5, right-hand panel), which in turn lowered claims growth.16 Economic policies, such as fiscal support measures, correlate positively with the borrower-side component, suggesting that they support borrowers' creditworthiness and lift aggregate demand.
Turning to more direct measures of economic growth, we find that they are positively associated with the borrower-side component. This is the case for both measures of realised GDP growth and forecasts of future growth.
In parallel, the growth in claims on AE private non-financial borrowers reflected drawdowns of existing credit lines. While the borrower-side component shows no relationship with pre-existing (ie undrawn) credit commitments in general, this relationship is positive for AE countries. Non-financial borrowers seem to have taken advantage of these facilities to anticipate future needs, boosting claims reflected in the borrower component.17
Lender-side factors
Despite the sharp output decline in Q2 2020 and weaker profits, banks themselves have proved to be stable so far. Still, the lender-side component of foreign claims on the private non-financial sector differs significantly across banking systems (see box). We relate this component to characteristics of the lending banking system at the national level, ie bank capitalisation and credit commitments.
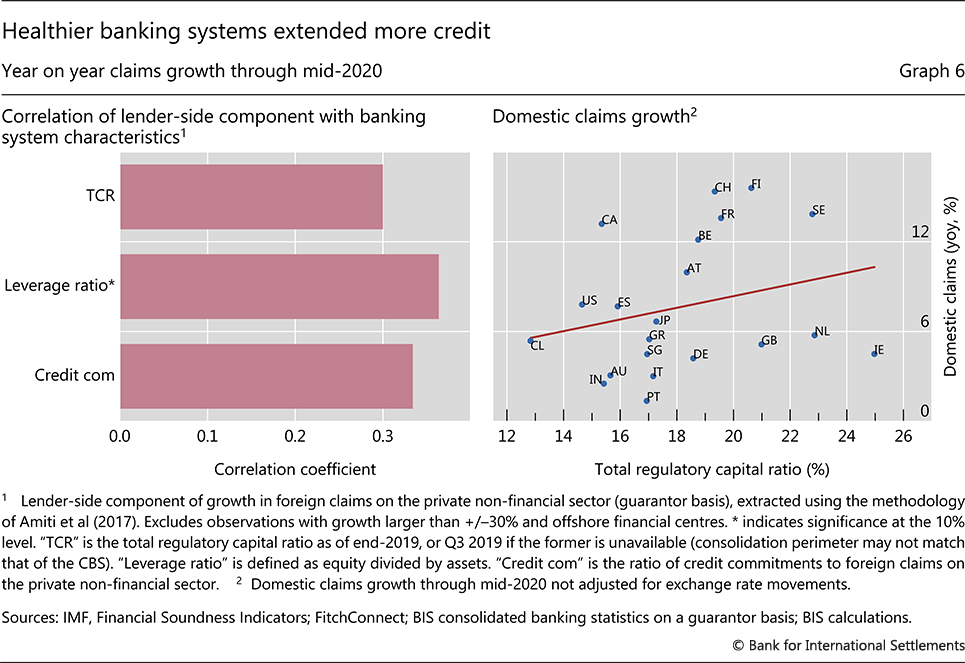
Claims growth exhibits a positive relationship with bank capitalisation and with credit commitments extended prior to the pandemic. Indeed, the lender-side component is higher for banking systems featuring higher risk-based capital ratios or, especially, leverage ratios (Graph 6, left-hand panel). Better capitalised banking systems also tended to increase their domestic claims more (right-hand panel). And similarly to what we saw on the borrower-side, banking systems with greater credit commitments at end-2019 lent more through mid-2020 (left-hand panel).
Conclusion
As the Covid-19 pandemic forced major economies into lockdown, global economic activity dropped suddenly in the second quarter. Yet in contrast to the GFC, international banks' claims held up well. Banks appear to have acted as the first line of defence against the shock by providing credit to stressed borrowers. Cross-border and local claims remained resilient, across both AEs and EMEs. So did claims on the private non-financial sector, closely capturing direct lending to the real economy.
A decomposition of foreign claims on the private non-financial sector allows us to study the underlying borrower- and lender-side drivers. The borrower-side component was positively related to indicators of lower vulnerabilities (such as lower government debt or a lower credit-to-GDP gap) and stronger economic activity in borrower countries (such as higher output growth or weaker lockdowns). The lender-side component was positively related to better capitalisation in lending banking systems (in terms of risk-based capital and leverage ratios). Both the borrower- and lender-side components were positively related to the size of pre-existing credit lines. Banks were thus in a position to accommodate the large drawdown of credit lines, along with the other funding needs of stressed borrowers.
The experience with international bank lending during the first phase of the pandemic is no reason for complacency. A second wave of infection is triggering additional lockdowns and likely output declines. Economic weakness might persist until vaccines are widely available. Continued monitoring, and if necessary, support is critical to maintain lending to the real economy as the Covid-19 crisis unfolds.
References
Aldasoro, I, C Cabanilla, P Disyatat, T Ehlers, P McGuire and G von Peter (2020): "Central bank swap lines and cross-border banking flows", BIS Bulletin, (forthcoming).
Aldasoro, I, C Borio and M Drehmann (2018): "Early warning indicators of banking crises: expanding the family", BIS Quarterly Review, March, pp 29-45.
Amiti, M, P McGuire and D Weinstein (2017): "Supply- and demand-side factors in global banking", BIS Working Papers, no 639. Published as "International bank flows and the global financial cycle", IMF Economic Review, vol 67, no 1, pp 61-108, March, 2018.
Amiti, M and D Weinstein (2018): "How much do idiosyncratic bank shocks affect investment? Evidence from matched bank-firm loan data", Journal of Political Economy, vol 126, no 2.
Avdjiev, S, B Hardy, P McGuire and G von Peter (2020): "Home sweet host: Prudential and monetary spillovers through global banks", BIS Working Papers, no 853. Forthcoming in Review of International Economics.
Bank for International Settlements (2020): Annual Economic Report, Chapter 1, "A global sudden stop".
Drehmann, M, C Borio and K Tsatsaronis (2011): "Anchoring countercyclical capital buffers: the role of credit aggregates", International Journal of Central Banking, vol 7, no 4, pp 189-240. Also published as BIS Working Papers, no 355.
Garcia Luna, P and B Hardy (2019): "Non-bank counterparties in international banking", BIS Quarterly Review, September, pp 15-31.
Lewrick, U, C Schmieder, J Sobrun and E Takáts (2020): "Releasing bank buffers to cushion the crisis - a quantitative assessment", BIS Bulletin, no 11.
McGuire, P and G von Peter (2016): "The resilience of banks' international operations", BIS Quarterly Review, March, pp 65-78.
1 The authors thank Iñaki Aldasoro, Claudio Borio, Stijn Claessens, Patrick McGuire, Swapan-Kumar Pradhan, Hyun Song Shin, Nikola Tarashev, Christian Upper and Goetz von Peter for valuable comments and suggestions, and Jhuvesh Sobrun for excellent research assistance. The views expressed in this article are those of the authors and do not necessarily reflect those of the Bank for International Settlements.
2 Claims include loans and deposits as well as holdings of debt securities and derivatives positions.
3 Since a breakdown of foreign claims on the private non-financial sector is not available for the GFC period, reference to private non-banks provides the closest proxy. Claims on the private non-bank sector, comprising both non-bank financial and non-financial borrowers, grew by 0.4% in Q2 2020.
4 That said, local claims funded by local liabilities tended to be more stable than cross-border claims through the GFC (McGuire and von Peter (2016)).
5 The consolidated banking statistics indicate that these banks' domestic claims (on borrowers in the home country) also increased sizeably in the first half of 2020.
6 Banks in swap line recipient countries obtain currency through a claim on a bank located in the currency-issuing country. This claim is typically a deposit at an affiliated bank, ie an inter-office claim. When the swaps mature, the transaction reverses, resulting in a decline in such inter-office claims.
7 In all currencies, excluding confidential data. Local positions are not fully reported in the LBS by some countries. Notably, we need to estimate positions for the United States using the CBS and Federal Reserve data.
8 Federal Reserve data show that non-US banks' branches and agencies in the United States increased their reserves held at the Federal Reserve by $0.32 trillion during Q1 2020, but reduced them by $0.23 trillion in Q2. Claims on the central bank in other reporting AEs expanded in both Q1 and Q2.
9 Our coverage is limited only to those EMEs that report to the LBS, provide data for local positions and have the needed sector breakdowns. Nevertheless, the overall patterns are confirmed by a similar exercise using CBS - which are not adjusted for exchange rate movements but have a much broader coverage of local claims in local currency for EMEs.
10 While claims on the government can also support real economic activity, the CBS we employ do not allow us to separate them from claims on central banks.
11 Amiti and Weinstein (2018) developed the underlying methodology, and Amiti et al (2017) and Avdjiev et al (2020) have applied it to the BIS international banking statistics.
12 Detailed sectoral breakdowns, distinguishing the private non-financial sector, are only available after 2014, with coverage becoming nearly complete only by 2018. See Garcia Luna and Hardy (2019) for further discussion on the sectoral breakdowns available in the data.
13 The box quantifies these differences.
14 The credit-to-GDP gap compares the actual credit-to-GDP ratio with its long-term trend (Drehmann et al (2011)).
15 Covid-19 deaths per capita show a similar correlation.
16 A priori, the short-term lockdown impact is ambiguous. On the one hand, a stricter lockdown implies weaker economic activity (at least in the short run). On the other hand, it might increase demand for credit to bridge the cash flow shortfall.
17 Credit commitments in the CBS dropped from $4.9 trillion to $4.6 trillion in Q1 2020.