The resilience of banks' international operations
This feature explores the resilience of banks' balance sheets after the 2008-09 financial crisis through the lens of a unique global data set crossing bank nationality and host country. We start by documenting post-crisis changes in the structure of BIS reporting banks' global operations across bank nationalities. We then zero in on the funding mix of banks' foreign affiliates (branches and subsidiaries) on the eve of the crisis, and how it helps explain the subsequent contraction of credit. We find that local claims backed by local funding made balance sheets more resilient, even after accounting for systematic differences between host countries and banking systems. By contrast, affiliates shrank more sharply if they had relied pre-crisis on non-core sources of funding, in the form of interbank, foreign currency and cross-border funding.1
JEL classification: F34, G01, G21.
It is well known that international bank credit contracted sharply in the wake of the financial crisis of 2008-09, and again during the European sovereign crisis of 2010-12, with huge costs in terms of output and employment. What is less well understood is why, in both of these episodes, some banks' balance sheets contracted more sharply than others'. Many interrelated factors have played a role, including banks' business models, their asset quality and funding structures, recessions in countries they operated in, distressed funding and asset markets, and home and host country regulation.
This feature examines the role that banks' structure and funding mix played in the resilience of their balance sheets in the years following the financial crisis. To disentangle the various factors at play, we examine how the major banks' affiliates shed assets across host countries. We combine elements of the BIS international banking statistics to form a novel data set that crosses bank nationality and location to capture the balance sheets of groups of affiliates (eg German banks in the United Kingdom). This disaggregation of banks' consolidated balance sheets by host country matches the set of assets to the liabilities that support them. This reveals bank characteristics that other data sets conceal when they ignore the geography of banks' operations (as with data based on consolidated financial statements), or when they lump together domestic and foreign banks (as with national statistics).2
To explore the factors driving the balance sheet contractions in the wake of the crisis, we decompose their variation across affiliate groups into three sources. We find that they were larger for: (i) banks operating in troubled economies and offshore centres (host country effect); (ii) banks which, at a consolidated level, were more exposed to the financial crisis (nationality effect); and (iii) affiliates with a fragile funding mix. Our findings complement those of Hahm et al (2013), based on national data at the country level. By distinguishing banks in each host country by their nationality, our analysis also relates to Peek and Rosengren (1997), who trace how Japanese banks transmitted financial distress at home to the supply of credit in the United States through their US affiliates. The paper closest to ours is perhaps de Haas and van Lelyveld's (2014) study of multinational banking, using Bankscope data with less information on funding sources than is available in our data set.
A robust finding is that affiliate groups more attached to their host jurisdictions at the onset of the crisis - with local claims funded by local liabilities - experienced smaller balance sheet contractions in its aftermath. The local content in these affiliates' balance sheets, which often represents retail banking activity, provided resilience to their balance sheets when global wholesale funding markets seized up in the crisis. By contrast, affiliates that relied more on non-core liabilities, such as interbank, cross-border and cross-currency funding, experienced larger balance sheet contractions. These findings highlight that the way banks organise their international operations has important consequences for the distribution and resilience of global credit.
Banks' foreign positions during the crisis
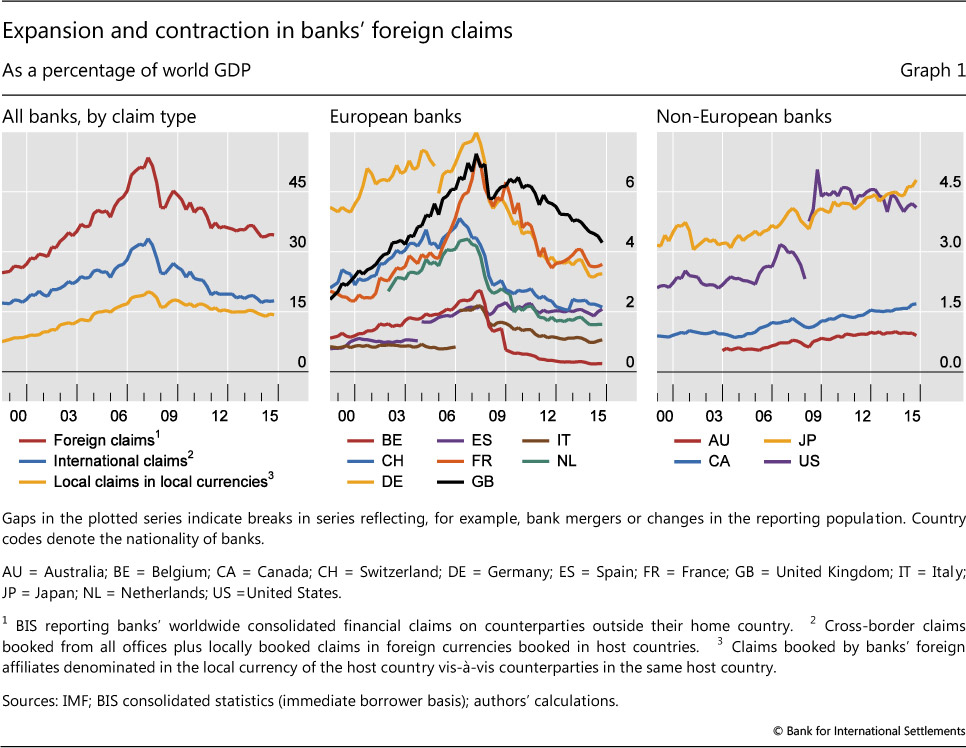
Some banks weathered the 2008-09 financial crisis better than others. Graph 1 plots the stock of BIS reporting banks' foreign claims, ie credit that banks extend to borrowers outside their home country.3 Aggregated across all banks, foreign claims are still on a downward trajectory relative to global economic activity (Graph 1, left-hand panel). The contractions in European banks' balance sheets were amongst the most severe during the crisis, and were compounded by the European sovereign debt crisis starting in 2010 (centre panel).4 By contrast, Canadian, Japanese and Australian banks and several smaller banking systems experienced contractions following the crisis, but registered more robust growth in claims for much of the period thereafter (right-hand panel).
These differences across banking systems in part reflect the fact that the assets that lost value during the crisis were concentrated on European and US banks' balance sheets. But differences in business models also played a part; some banks extended more credit locally, to borrowers in the same host country, and often funded these claims from local sources too (McCauley et al (2012)). The large internationally active Spanish banks are leading examples. In many host locations, this local activity reflects retail banking - eg credit to households and local businesses funded by retail and corporate deposits, mainly denominated in the local currency of the host country.
It is not obvious a priori what a local orientation implies for resilience. Local banking may represent relationships that banks maintain through good and bad times. Local business insulated many affiliates from the turmoil in global wholesale funding markets during the crisis; it may also have limited exposure to structured products, often held as cross-border claims on US borrowers. Depending on the host country, however, local claims may also have exposed affiliates to domestic property busts or to recessionary economies in the European sovereign debt crisis. This suggests that the stability implications of banks' organisational structure depend on the source of shocks and whether these are local or global in nature.
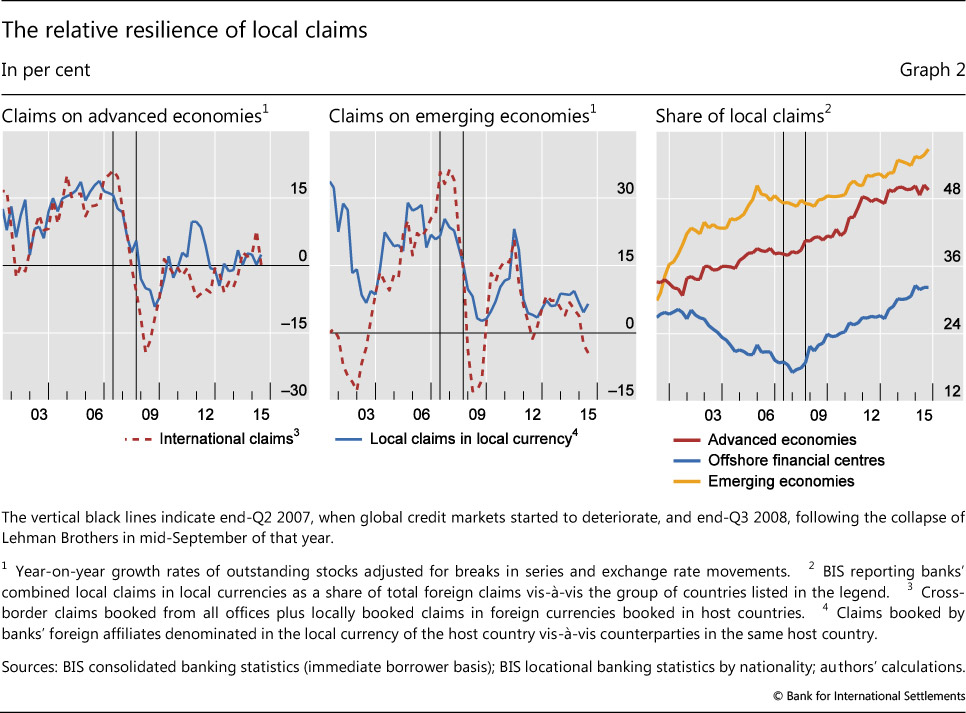
In aggregate, local positions seem to have provided resilience to banks' balance sheets during the financial crisis. Graph 2 compares the growth rates of international claims, which comprise cross-border and foreign currency claims, with those of local claims in local currencies. Both series are adjusted for breaks in series and exchange rate movements.5 Vis-à-vis both advanced economies (Graph 2, left-hand panel) and emerging market economies (EMEs) (centre panel), local claims in local currencies experienced much smaller contractions - and a smaller expansion in the run-up to the crisis - than did international claims. Indeed, vis-à-vis EMEs, the growth in aggregate local claims never turned negative post-crisis. As a result, local claims have been rising as a share of total foreign claims on all regions (right-hand panel).
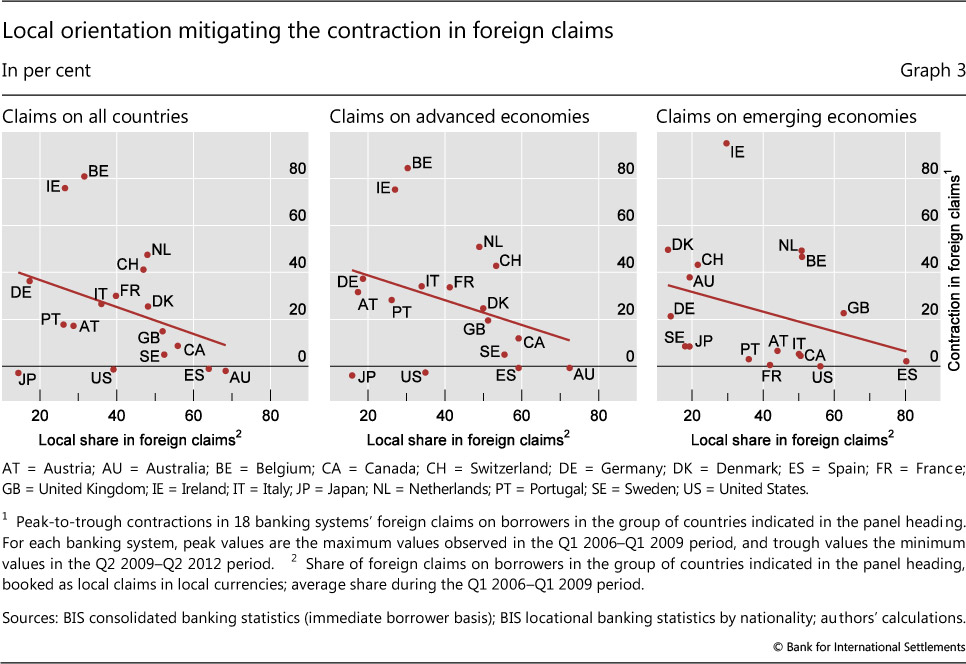
At the level of individual banking systems, those with more of a local orientation on the eve of the crisis seemed to experience smaller balance sheet contractions once the crisis was under way. Graph 3 shows the contraction in 18 banking systems' consolidated foreign claims on counterparties in all countries (Graph 3, left-hand panel), in advanced economies (centre panel) and in EMEs (right-hand panel). These are plotted against the share of those claims that were booked locally in local currencies on the eve of the financial crisis. For each country grouping, there is a weak but discernible downward slope in the regression line. That said, there are some clear outliers. For example, Dutch and Belgian banks experienced some of the largest overall contractions, reflecting the breakup of ABN AMRO and Fortis. By contrast, Japanese banks hardly contracted at all, yet they had the lowest ratio of local claims to foreign claims. Japanese banks were less exposed to toxic assets, and suffered smaller losses during the crisis than did many European banking systems.
Banks have been urged by supervisors, shareholders and counterparties to make their balance sheets more resilient. The experience of the financial crisis shows that wholesale funding, in particular, can become unstable when market sentiment turns, making banks more vulnerable to financial shocks and economic downturns. By contrast, reliance on traditional retail deposit funding has been a stabilising force during periods of stress. Is the focus on funding structures justified? The next section more formally examines the relationship between banks' funding mix on the eve of the crisis and the resilience of their balance sheets in its wake.
Bank nationality, host country and the funding mix
As illustrated in Graph 3, some banking systems fared worse than others in terms of how much their balance sheets contracted in the aftermath of the crisis. In this section, we analyse to what extent this variation relates to banks' funding mix, while separating out factors common to each location (eg recession in the host country), as well as those factors common to banks headquartered in a particular country (eg crisis-related losses for the parent bank). To do so, we rely on a disaggregated data set, one that matches the assets of affiliate groups (branches and subsidiaries) with the liabilities funding them.
We combine data from the BIS international banking statistics (IBS) to provide a granular picture of the full balance sheets of banks' foreign affiliates. The data set aligns the assets booked by banks of a given nationality in a particular host country with the liabilities that fund those assets, at the level of affiliate groups (eg German banks in the United Kingdom).6 This disaggregation allows us to see how banks of a specific nationality shed assets in every host country in which they operate, and observe differences that a consolidated view would conceal. In particular, we can isolate each affiliate group's local positions (assets and liabilities) and examine their contribution to balance sheet resilience. This allows us to test whether bank affiliates with stronger ties to local counterparties were in fact more stable. We also control for other aspects of their funding structure, notably their reliance on "non-core funding", which Hahm et al (2013) define as liabilities other than retail deposits.
For each affiliate group, assets and liabilities are broken down into the components shown in Table 1. Our measures of non-core liabilities make use of the currency of denomination, and the location and sector of the counterparty, ie the borrower. The availability of these dimensions distinguishes the BIS international banking statistics from other banking data sets and the studies using them.7 The counterparty can either be in the same jurisdiction (local) or abroad (cross-border). Furthermore, the counterparty can be a non-bank or a bank, and interbank positions can in turn be intragroup (within the same banking group), vis-à-vis other banks or vis-à-vis official monetary authorities.8 By excluding intragroup funding, our measure of interbank borrowing focuses on funding from unaffiliated banks. Finally, positions are also reported by the currency of denomination, including the main international currencies (US dollar, euro and yen), the local currency of the host country and other foreign currencies. Unfortunately, the IBS do not provide an instrument breakdown (eg deposits versus wholesale debt funding) at the level of bank affiliate groups. It is plausible, however, that the stability of a bank's funding depends as much on the behaviour of its counterparties as on the legal form of their claims, as noted by Hahm et al (2013).
Our analysis concentrates on banks' foreign affiliates. Banks' offices in the home country (eg French banks in France) are excluded, for two reasons. First, including the home offices in the empirical analysis would introduce a large element of domestic banking, whereas the focus of this study is on banks' foreign claims. For most banking systems, the balance sheets of home offices mainly consist of "strictly domestic" positions,9 whereas their foreign affiliates show more variation in their funding models across host countries. Second, the IBS do not contain the full balance sheet of banks' home offices since they miss the "strictly domestic" positions. Thus, even if there were a reason to include the home offices in the sample, few ratios used as explanatory variables can be calculated with precision.

The full data set captures the quarterly positions, from 1999 onward, of the foreign affiliates for 26 bank nationalities operating in 40 host countries.10 From an initial sample of 650 nationality-location pairs, we exclude 34 home offices and filter out observations with data shortcomings to create a sample of 255 affiliate groups spanning 17 parent countries and 38 different host jurisdictions, including major offshore centres.11 The combined peak assets among affiliates in the sample equals $24.4 trillion, or 90% of total assets of all affiliates (but only 53% of the full reporting population including all home offices). Credit to local borrowers accounts for nearly 50% of affiliates' total assets; the remainder consists of cross-border claims. The sample is unbalanced in the sense that not all bank nationalities have operations in all host countries.
We use a peak-to-trough approach to measure the contraction in the balance sheets of banks' foreign affiliates in the wake of the financial crisis. For each group of affiliates, the percentage contraction is calculated by comparing the peak value of total assets between Q1 2006 and Q1 2009 with the minimum asset value from Q2 2009 to Q2 2012. This approach takes into account that banks' assets peaked in different quarters, with most peaks occurring in Q4 2008 or Q1 2009; banks also shed assets at different rates and in different periods, eg due to the uneven effect across bank nationalities of the 2010-12 European sovereign debt crisis. Growth rates are calculated at constant exchange rates. The sample average of peak-to-trough contractions is between 34% and 36%, whether one uses the mean, weighted mean or median.12
Our cross-sectional regression relates the rate of contraction to pre-crisis ratios describing the structure of banks' asset and liabilities. The dependent variable, -∆Ain/Ain, is the percentage contraction of total assets booked by bank affiliates of nationality n in host country i, indexed by in. The minus sign means that positive values are contractions and negative values are expansions. These growth rates are regressed on various balance sheet ratios  specific to each affiliate group prior to the crisis, along with various controls,13

The factors driving credit contractions now fall into three groups. At the level of affiliates, the coefficients βr measure the extent to which a particular funding ratio (r), such as interbank borrowing, accelerated (or mitigated if negative) the shedding of assets by the affiliates of nationality n in host country i. The controls include balance sheet size of the affiliates, measured as the logarithm of total assets (Ain), and the (log of) geographical distance to the affiliates' home country (din). We also add two groups of controls at the country level: σn captures factors common to all banks of a specific nationality n, such as their group-wide business model or home country regulation. Likewise, λi is a set of dummies that absorbs the factors affecting all affiliates operating in host country i, including local demand conditions and sovereign risk. In gauging these common effects, the fixed effects λi and σn are of interest in their own right, but also allow for consistent estimation of the funding ratios.14
The main explanatory variables include various affiliate-specific funding ratios, measured at the peak. Local intermediation (LIM) measures the attachment of bank affiliates to the host country in which they operate. It matches their local lending to their local funding, and expresses the minimum as a share of their balance sheet.15 The measure increases when affiliates both lend locally and fund these positions locally. It is close to zero, however, for affiliates specialised in fund-raising (borrowing funds to send them abroad), or those intermediating capital inflows (borrowing abroad to fund local credit). At 20%, the median of local intermediation is fairly low, since the sample consists of foreign branches and subsidiaries.
We also include measures describing banks' reliance on non-core funding identified in the literature (Hahm et al (2013), Yorulmazer (2014), Bruno and Shin (2015)). Specifically, we construct foreign currency funding, the share of liabilities denominated in foreign currencies; cross-border funding, the share of liabilities raised cross-border; interbank funding, the share of liabilities borrowed from unaffiliated banks; and net intragroup funding, the share of liabilities that are cross-border transfers within a banking group. Each of these funding modes may be less stable than traditional core funding in domestic currency, from local sources and from non-bank counterparties (Hahm et al (2013)). The variable US dollar funding needs gauges the extent to which banks funded US dollar assets in a currency other than the US dollar; it is an indirect estimate of the demand for US dollar funding from the interbank market and through FX swaps.
The first observation, confirming the earlier graphical discussion, is that there are systematic differences across banking systems and across host countries. A regression with no affiliate-specific variables shows that the country-specific controls jointly account for 44% of the variation in balance sheet contractions. The host country effect shows that the average contraction across all affiliates in a given location was larger in troubled economies and some offshore centres serving as conduits. Offices in Ireland, Greece, Luxembourg, the Cayman Islands, the Bahamas, Jersey and Guernsey shed more than 40% of their assets. Similarly, claims booked by offices in the United Kingdom contracted by 36% on average, partly because many banks held structured finance products that lost value in the crisis with their affiliates in London and other financial centres (if not their home offices).
For its part, the nationality effect alone explains 31% of variation in the credit contractions across affiliates. This captures the commonality among affiliates from the same parent country, across all host countries. For example, Fortis and ABN AMRO were broken up during the crisis, and so the aggregate balance sheets of Belgian and Dutch banks' affiliates (as reported to the IBS) contracted in many host locations. The nationality effect implies that Belgian and Dutch banks on average shed, respectively, 15% and 18% more of their assets than banks of other nationalities.16 Similarly, being an affiliate of a German bank added 22 percentage points to the average contraction in any given host country. By contrast, having a Japanese or Australian parent mitigated the predicted contraction by 16 and 21 percentage points, respectively, since the respective banking groups emerged from the crisis largely unscathed.
The strength of these commonalities sets a high hurdle for finding any additional significance in the funding ratios of interest. Against this background, Table 2 builds up our regression in several steps, where each model includes fixed effects and two further controls. In all models, balance sheet size turned out to limit the subsequent contraction, perhaps because larger affiliates had better access to funding markets, and ultimately to the lender of last resort. By contrast, the geographical distance between bank affiliates and their headquarters generally added to the predicted contractions, implying that affiliates active in host countries further from home tended to shed more assets.17 Ideally, we would also control for asset quality as a possible driver of balance sheet contractions, but data limitations at the affiliate level are prohibitive. The fixed effects may capture some patterns in banks' exposure to non-performing assets, to the extent that these were booked in certain countries (eg financial centres) or concentrated in specific banking systems.
A second finding is that the pairing of local assets with local funding apparently provided resilience, as witnessed by the variable LIM in Model I. This happens to be the most robust regressor at the affiliate level, explaining 5% of the variance in balance sheet contractions. The estimated coefficient (-0.4) suggests that banks doing 10% more business locally shrank by 4 percentage points less on average. When LIM is replaced by the share of local claims or the share of local liabilities, these are also significant, both alone and jointly. But it is the combined local focus on both sides of the balance sheet (LIM) that best explains the affiliates' resilience, presumably because it is more indicative of retail business. In analogous regressions (not shown) of the contraction in each affiliate group's local claims only, on the share of local assets backed by local liabilities, the coefficient is also highly significant at -0.6.18
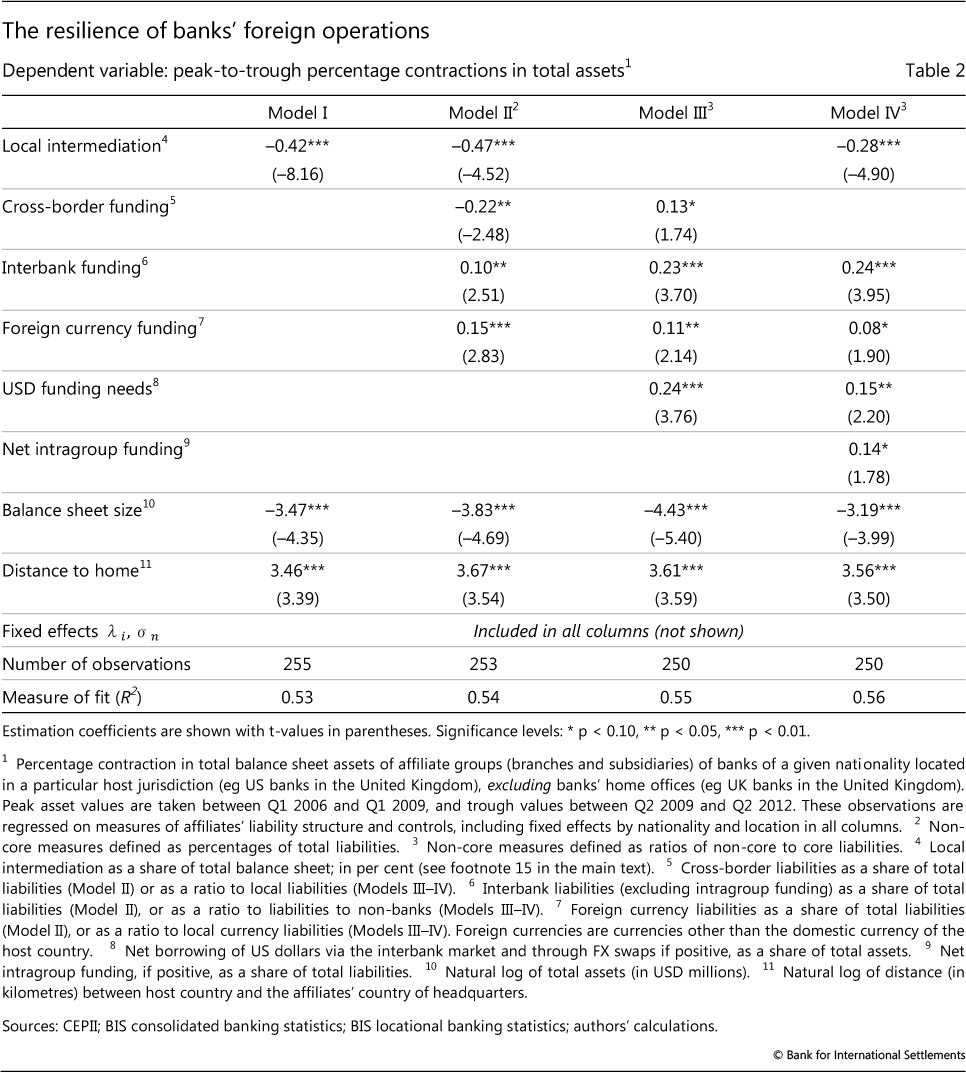
The remaining columns in Table 2 introduce measures of affiliate groups' reliance on non-core funding. LIM continues to enter significantly, with the size of the estimated coefficient falling as more variables are added. Model II lends some support to the conjecture that foreign currency, cross-border and interbank liabilities were more fragile forms of funding. The coefficient on foreign currency funding indicates that for every 10% of foreign currency borrowing in their funding mix, affiliates subsequently shed 1.5% more assets. Interbank funding has a similar effect. Oddly, cross-border funding appears to slow down banks' post-crisis contraction, but this is because LIM already captures the stabilising role of local (as opposed to cross-border) funding.19
It is possible that non-core funding becomes unstable only when excessive reliance is placed upon it. Model III includes the same non-core liabilities, but expressed as ratios to core liabilities (rather than shares of total liabilities).20 The ratio transform magnifies the difference between banks that rely more heavily on non-core funding, notably those beyond 80% - a threshold that may well alarm creditors. Here, all three dimensions of non-core funding have some explanatory power with the expected sign. Interbank funding from unaffiliated banks appears to contribute most strongly to the subsequent contraction in assets, followed by cross-border and foreign-currency borrowing. These results complement Hahm et al (2013), who show that non-core/core ratios help predict credit and currency crises.
Model III also includes one currency-specific variable, US dollar funding needs. This estimate of affiliates' net short-term borrowing in US dollars turns out to be the most significant variable amongst the various currency-related funding ratios. Taken at face value, the coefficient predicts 2.4% more asset shedding for every 10% of an affiliate's balance sheet funded by short-term dollar funding. Dollar funding needs played a central role in the financial crisis: many (notably European) banks faced difficulty in rolling over these funding positions during the crisis (McGuire and von Peter (2012)).
Finally, Model IV includes net intragroup funding (alongside LIM) to examine whether pre-crisis reliance on internal capital markets helped affiliates support their balance sheet. Although this measure is not always significant, the estimate suggests that pre-crisis net recipients, if anything, shrank more during the crisis. This does not imply that intragroup transfers were unhelpful once the crisis broke out; rather, the generalised seizure of global wholesale funding made it difficult for banking groups to maintain active internal markets to fund affiliates across multiple host countries. Indeed, de Haas and van Lelyveld (2014) find that foreign bank subsidiaries reduced credit growth more aggressively than domestic banks in 2008-09 - in contrast to earlier experience where internal markets helped to smooth more localised funding crises.
In sum, several funding variables at the affiliate level help explain why some banks cut credit more than others in the years after 2008. That said, there are systematic patterns in the way banks shed assets that relate to their nationality and location, as identified by the fixed effects. Some host countries were hit harder during the crisis, affecting all offices located there. For its part, the nationality effect is particularly potent in explaining credit contractions, pointing to a strong commonality among banks from the same home country.
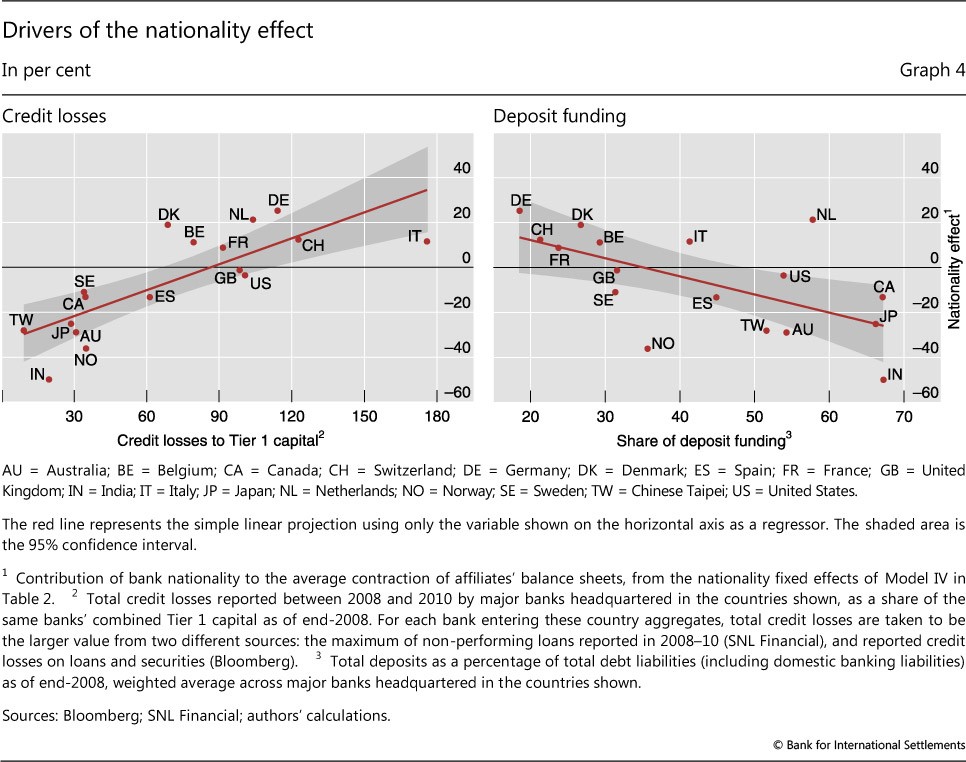
Some banking systems shrank their operations in many locations, possibly due to financial distress at the group level. Credit losses in the financial crisis are known to have decimated the capital base of many internationally active banks. That this in turn led banks to cut credit can be gleaned from Graph 4 (left-hand panel): banking systems recording greater credit losses tended to shrink their balance sheets by more - and do so in many locations. The nationality effect correlates as strongly with banks' reliance on deposit funding (Graph 4, right-hand panel): the more banks relied on deposits in their overall funding structure, the less their affiliates abroad cut credit in the aftermath of the crisis.
We are led to the conclusion that funding structures may be more important than the measures of fit in Table 2 suggest. The two sets of fixed effects absorb all factors common to host countries or to bank nationalities, respectively, and that includes the extent to which funding structures were systematically more fragile among banks of particular nationalities, or among affiliates in certain locations (such as financial centres). The full effect of funding models should therefore add their contribution to the size of the overall contractions embodied in the fixed effects. Other factors, when included, instead may mitigate the measured importance of funding models: we lacked the data to control for affiliates' asset quality, surely another key driver of credit contractions following the financial crisis. Disentangling the complicated interplay between funding models and other drivers at the levels of affiliates, banking groups and host countries certainly warrants further work.
Conclusions
The structure of international banking in the post-crisis period was shaped by forces that surfaced in the financial crisis and its aftermath. Using a novel data set on major banks' foreign affiliates, this feature explores how the credit contractions across host countries and banking systems relate to their pre-crisis funding structures. Our findings suggest that local relationships helped sustain credit after the financial crisis, and that banks shed more assets when their funding mix depended on non-core liabilities, such as cross-border, interbank and foreign currency liabilities. However, the strong commonality across affiliates of the same nationality points to the importance of bank health at the group level. Banks with larger credit losses and non-core funding spread credit contractions across many host countries. This complements other evidence in the literature that global banks can have a stabilising or destabilising effect on the economies they operate in, depending on the nature of the shocks they face.
References
Anderson, J and E van Wincoop (2003): "Gravity with gravitas: a solution to the border puzzle", American Economic Review, vol 93, no 1, pp 170-92.
Avdjiev, S, P McGuire and P Wooldridge (2015): "Enhanced data to analyse international banking", BIS Quarterly Review, September, pp 53-68.
Bruno, V and H S Shin (2015): "Cross-border banking and global liquidity", Review of Economic Studies, vol 82, no 2.
De Haas, R and I van Lelyveld (2014): "Multinational banks and the global financial crisis: weathering the perfect storm?", Journal of Money, Credit and Banking, vol 46, no 1, pp 333-64.
Fender, I and P McGuire (2010): "Bank structure, funding risk and the transmission of shocks across countries: concepts and measurement", BIS Quarterly Review, September, pp 63-79.
Hahm, J-H, H S Shin and K Shin (2013): "Non-core bank liabilities and financial vulnerability", Journal of Money, Credit and Banking, vol 45, issue S1.
McCauley, R, P McGuire and G von Peter (2012): "After the global financial crisis: from international to multinational banking?", Journal of Economics and Business, no 64, pp 7-23.
McGuire, P and G von Peter (2009): "The US dollar shortage in global banking and the international policy response", BIS Working Papers, no 291.
--- (2012): "The dollar shortage in global banking and the international policy response", International Finance, vol 15, no 2, pp 155-78.
Okawa, Y and E van Wincoop (2012): "Gravity in international finance", Journal of International Economics, no 87, pp 205-15.
Peek, J and E Rosengren (1997): "The international transmission of financial shocks: the case of Japan", American Economic Review, vol 87, no 4, pp 485-505.
Yorulmazer, T (2014): "Literature review on the stability of funding models", FRBNY Economic Policy Review, February 2014, pp 3-16.
1 The views expressed in this article are those of the authors and do not necessarily reflect those of the BIS. We are grateful to Natalya Martynova and Iman van Lelyveld for their collaboration at an early stage of this project, and to Jakub Demski for excellent statistical support. We also thank Claudio Borio, Ben Cohen, Dietrich Domanski, Krista Hughes, Robert McCauley, Hyun Shin, Kostas Tsatsaronis and seminar participants at the BIS for helpful comments.
2 Our data set combines BIS locational and consolidated banking statistics for a time period preceding the recent enhancements to the statistics, discussed in Avdjiev et al (2015).
3 Foreign claims are a bank's financial claims on borrowers located outside the bank's home country, where "claims" includes both loans and holdings of financial securities. Foreign claims can be divided into cross-border claims, and local claims if the borrower is in the same country as the bank affiliate booking the claim. The term international claims refers to the sum of cross-border claims and local claims in foreign currencies (excluding local claims denominated in local currency).
4 Contractions in foreign claims can result from bank lending being reduced or written off, or securities being marked to market or sold at prices below book value. Another factor, valuation effects from the depreciation of currencies against the US dollar, is eliminated below.
5 The US dollar appreciated against the euro by 25% in the five months following the collapse of Lehman Brothers in the third quarter of 2008, and by even more against other currencies. Without adjustment, balance sheet positions denominated in currencies other than the US dollar register contractions when expressed in US dollar terms even in the absence of actual changes in the flow of credit.
6 "Bank nationality" is the country of a bank's headquarters, and the host country is the location where their foreign affiliates operate. The data are constructed by splicing together the BIS locational banking statistics by nationality (LBSN), which track the cross-border and local positions in foreign currencies for banks of different nationalities in a particular host (reporting) country; and the BIS consolidated banking statistics (CBS), which contain the local positions (claims and liabilities) in local currencies of these foreign affiliates in each host country (see McGuire and von Peter (2009) and Fender and McGuire (2010) for discussion).
7 Most publicly available data are consolidated worldwide balance sheets. Where data on unconsolidated entities are available, they may not report a comprehensive balance sheet for the location where bank affiliates operate, depending on the treatment of branches. Moreover, such data typically shed no light on the location of counterparties, nor do they identify the counterparty sector or the currency, yet all these aspects are key for the analysis of banks' funding mix. For example, de Haas and van Lelyveld (2014) are limited to studying deposit versus wholesale funding, as currency and counterparty information is unavailable in Bankscope.
8 Note that the counterparty sectoral breakdown is available for all cross-border positions and for local positions in foreign currencies, but not for local positions in local currencies. In constructing the overall interbank borrowing share for each affiliate group, we assume the sector shares for these positions are the same as those for which the breakdown is available.
9 These are positions booked by banks' home offices vis-à-vis their home country residents and denominated in the domestic currency.
10 The data set is internally consistent in the sense that the sum of the balance sheets across all 40 host jurisdictions (including the home country) for any one bank nationality yields an aggregate (net of intragroup positions) value of foreign claims close to the value reported in the BIS consolidated banking statistics.
11 We drop pairs where the matched LBSN and CBS data yield an incoherent picture of the affiliate groups' balance sheets (eg where total assets and total liabilities differ significantly), pairs where the affiliate groups' total assets (at the peak) are less than $1 billion or lack essential breakdowns, and those with large jumps due to mergers and acquisitions.
12 Shortening the trough window produces smaller contractions, but also tilts the results in favour of our hypothesis that local positions provided resilience. Our window includes the European sovereign debt crisis, where local business also declined as countries sank deeper into recession.
13 This equation is estimated with clustered standard errors allowing for correlation within the 17 bank nationalities in the sample.
14 This specification follows best practice in the gravity literature in international trade and finance (eg Anderson and van Wincoop (2003), Okawa and van Wincoop (2012)), where consistent estimates of the coefficients on bilateral variables (eg distance) are obtained by including fixed effects for each origin and destination country. In our context, the "bilateral" variables are the balance sheet ratios.
15 The share of local intermediation equals LIMin =100*min{LCin, LLin}/TBin, where LCin is local claims in all currencies and LLin is local liabilities in all currencies in country i booked by bank affiliates from country n, expressed as a percentage of total balance sheet size TBin. The extent of local intermediation also helps to identify banking groups that run a decentralised, multinational business model (McCauley et al (2012)).
16 The specific numbers for the nationality fixed effects quoted here differ slightly from those of Model IV shown in Table 2. Note that the results in Table 2 are robust to the exclusion of all Dutch and Belgian affiliate groups from the sample. They are also robust to the inclusion of major offices of Austrian and Irish banks.
17 For example, being 10,000 km away from home was associated with 4% more balance sheet contraction than being located 3,700 km from headquarters. This distance effect hints at international banks' post-crisis drive to refocus on their core business closer to home.
18 A similar result is obtained from regressing the contraction in local claims in local currency on the share that is funded by local liabilities in local currency.
19 Dropping LIM from this regression yields a statistically insignificant coefficient on the cross-border share; much of the information in the cross-border share is also contained in the foreign currency share (the correlation between these shares equals 71%).
20 Core liabilities are simply total liabilities minus non-core liabilities as defined above. The typical affiliate group in the sample has non-core funding shares of about 70% of total liabilities, leading to median non-core/core ratios of 2.4 (≈70/30), in the three dimensions.