Green bonds and carbon emissions: exploring the case for a rating system at the firm level
Green bonds are debt instruments whose proceeds finance projects with various environmental benefits - including climate change mitigation. So far, however, green bond projects have not necessarily translated into comparatively low or falling carbon emissions at the firm level. We discuss the potential benefits of a firm-level rating based on carbon intensity (emissions relative to revenue) to complement existing project-based green labels. We argue that such a rating system could provide a useful signal to investors and encourage firms to reduce their carbon footprint.1
JEL classification: Q53, G18, G24.
Interest in green bonds and green finance - commonly defined as the financing of investments that provide environmental benefits (G20 GFSG (2016)) - has been increasing rapidly. Financial instruments that contribute to environmental sustainability have become a priority for many issuers, asset managers and governments alike. In particular, the market for green bonds has been growing fast. Global issuance surpassed $250 billion in 2019 - about 3.5% of total global bond issuance ($7.15 trillion).2
Private institutions have developed green bond certifications and standards that grant issuers a green label if individual projects are deemed sufficiently in line with the Green Bond Principles (GBPs) of the International Capital Market Association (ICMA), and the use of proceeds can be ascertained.
A key issue for both policymakers and investors is whether existing certifications and standards result in the desired environmental impact (The Economist (2020)). While the GBPs define a broader range of environmental benefits, this special feature focuses on one particular aim: low and decreasing carbon emissions.
Key takeaways
- Current labels for green bonds do not necessarily signal that issuers have a lower or decreasing carbon intensity, measured as emissions relative to revenue.
- Rating firms, rather than bonds, on their carbon emissions could provide a useful signal to investors and encourage companies to increase their carbon efficiency.
- Such ratings, which could complement existing labelling systems, can be designed to provide extra incentives for large carbon emitters to help combat climate change.
Statistical data: data behind all graphs
Policymakers in many countries have committed themselves to achieving the Paris climate goals, including one of the three main objectives: "making finance flows consistent with a pathway towards low greenhouse gas emissions and climate-resilient development" (United Nations (2015), article 2.1). On the investors' side, an increasing number of private and public sector entities have explicit mandates for portfolio allocations to support the mitigation of climate change (Bolton et al (2020), Fender et al (2020), FT (2020)).3
The current system of green bond labels does not necessarily guarantee a material reduction in carbon emissions. Indeed, these labels would signal emission reductions only if the relevant projects were to transform the activities of the bond issuer radically enough for its carbon emissions to fall.4 But, as we show in the next section, green bond labels are not associated with falling or even comparatively low carbon emissions at the firm level.5
One approach to making progress in this respect would be to differentiate firms by their carbon emission outcomes. We explore the desirable properties of a highly stylised rating system that could provide investors, regulators and policymakers with firm-level information in a simplified, yet sufficiently granular way. Firm-level ratings of this nature could complement the current project-based green labels and provide a useful signal to investors.
An increased focus on firm-level carbon emissions is in large part enabled by improved data and disclosure, which are now published by a wide range of companies. Looking directly at emissions data provides a simple, transparent and cost-efficient way to verify whether corporates are on track to achieve any stated carbon emission goals. This could complement other efforts to require green bond issuers to publish standardised impact reports, which could include achieved (or expected) carbon reductions. New types of bonds, such as sustainability-linked bonds, climate-aligned or transition bonds, also focus on outcomes - including carbon emission reductions (CBI (2020), ICMA (2020)). But, the markets for such bonds are still in their infancy.
The roadmap to the rest of the feature is as follows. The next section reviews existing green bond standards and presents evidence on the correlation of existing green bond labels with both the level and change in firm-level carbon intensities. Then we explore the desirable properties for a green rating system for firms. The subsequent section provides a stylised example of what a carbon emission-based rating system fulfilling those properties might look like. In the conclusion, we note some unresolved issues and areas for further analysis and consultation.
Green bond issuers and carbon intensities
Current green bond certifications and emerging standards
Most green bond labels adhere to the GBPs. Developed by the private sector, these guidelines identify the key components of green bond issuance as (i) the use of proceeds for environmentally sustainable activities; (ii) a process for determining project eligibility; (iii) management of the proceeds in a transparent fashion that can be tracked and verified; and (iv) annual reporting on the use of proceeds (ICMA (2018)). Subsequent green bond certifications, such as the climate bond standards from the Climate Bonds Initiative (2019), provide more specificity within these components, including which investments qualify (eg renewable energy) or the accounting methodology for proceeds.6
A major development in setting official standards for green bonds is the proposed EU green bond standard (EU TEG (2019a)), based on the EU sustainable finance taxonomy (EU TEG (2019b)). Like the GBPs, the EU standards are based on the use of proceeds for environmentally beneficial projects. But in contrast to those high-level principles, the proposed EU standard entails detailed eligibility criteria for green projects and calls for official authorisation and supervision of third-party reviewers. In this way, they ensure a high level of consistency and credibility, which will likely spur demand from investors for green bonds compliant with the standard. While the EU standards are envisaged to be voluntary once they are adopted, they are likely to become a de facto requirement for issuers in the European market.
The project-based approach that underlies current green certifications as well as the EU standard has several advantages. It enables a wide range of firms to issue green bonds and incentivises them to initiate green projects. It is a forward-looking approach, as projects can cover investments in technologies that promise environmental benefits in the future. The rapid development of the green bond market shows that the project-based approach has met the demand from investors and issuers. Further, it has raised awareness of sustainable growth among all market players, and demonstrated that investor appetite for climate-related financial instruments is growing.
A key question for investors in green bonds and similar instruments is how to verify that the promised environmental benefits are, in fact, delivered (Beschloss and Mashayeki (2019)). Savvy investors can perform due diligence and evaluate the (expected) environmental benefits of the underlying projects. Major investment managers can engage with issuers to provide impact reports - as they increasingly do (Climate Action 100+ (2019)). But not all investors have the capabilities and resources to follow suit.
Further, investors need to clearly understand what a green bond label can and cannot deliver. Investors may mistake green bond issuance as a signal for firms with low or decreasing carbon emissions. Because green labels apply to standalone projects rather than to the firm's overall activities, projects promising carbon-reductions could be offset by carbon increases of the same firm elsewhere.
Data
A recent and significant development is that measures of carbon emissions have become available for most large firms across the world. Companies themselves calculate emissions on the basis of their economic activities and commonly accepted standards (The GHG (2004)) and disclose these data, or external parties provide estimates based on industry-specific models and companies' annual financial and other reports. In some jurisdictions (eg the United Kingdom), disclosure of carbon emissions is mandatory for most larger firms. But even in jurisdictions where disclosure is not mandatory, corporates increasingly publish information on their carbon footprint. Third parties, including academic institutions, NGOs and rating agencies, have developed elaborate models for constructing and verifying firms' carbon emissions.7 In this feature, we use annual data from S&P Trucost, whose assessments are available for listed firms that account for around 99% of global market capitalisation (see Box A for more details).
In our initial analysis, we consider both narrower and broader measures of carbon emissions. Carbon emission reporting currently distinguishes between three scopes. Scope 1 emissions cover emissions from owned or controlled resources of a firm. Scope 2 emissions are indirect emissions from the generation of purchased energy (eg electricity). Scope 3 emissions include all other indirect emissions that occur in a firm's value chain (eg input products, employee travel, distribution etc). The broadest scope of a firm's emissions is then the sum of Scopes 1, 2 and 3, which we denote as Scopes 1-3.8
Our preferred measure of firm "greenness" is carbon intensity, or the ratio of carbon emissions to revenue. Unlike a simple absolute measure of carbon emissions, it measures the firm's carbon efficiency.9 A rating system that ranks firms according to carbon efficiency provides the right incentives for improvement at the firm level - firms that use greener technologies and energy can achieve lower carbon emissions at the same level of economic activity and size. Firms should not be considered greener simply because they produce less. And while revenues can be volatile (say over an economic cycle), as compared with other possible normalising variables such as assets, they do appear to be an excellent proxy for the carbon-producing economic activities of a firm - in particular for the higher emission scopes.10
We identify labelled green bonds as those classified as such by at least one of four main providers of green bond data: Bloomberg, Climate Bonds Initiative; Dealogic; and Environmental Finance Bond Database. This captures the universe of green bonds available to most investors, although it may underrepresent green bonds issued in China.11
Green bond issuance and carbon emissions
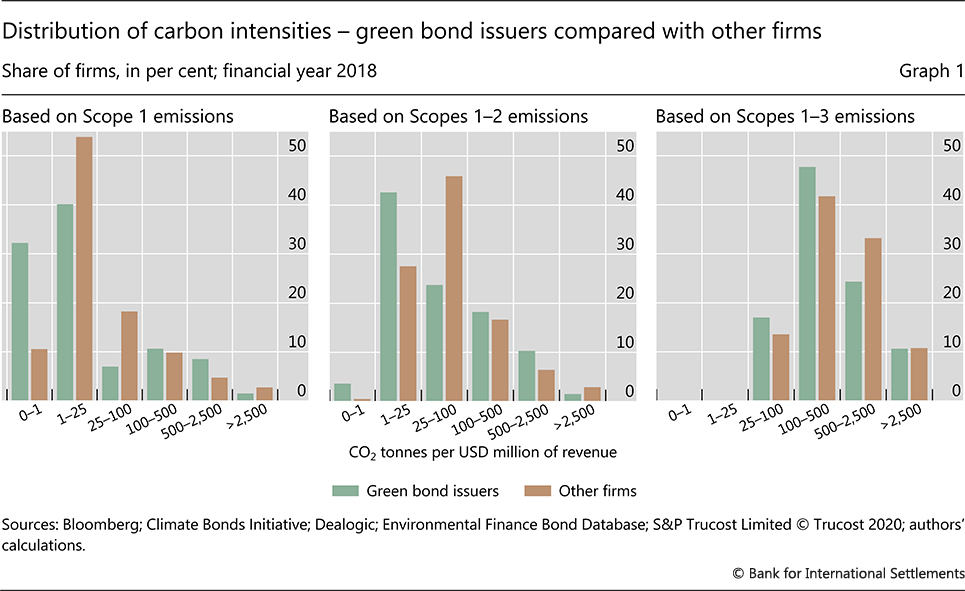
A fact possibly underappreciated by investors is that green bonds do not necessarily emanate from more carbon-efficient firms. Graph 1 depicts the distribution of carbon emission intensities (tonnes of CO2 per million US dollars of revenue) for a sample of around 16,000 listed firms in 2018 (end-financial year). Around 2% of these firms have issued green bonds.12 Higher scopes include a wider range of carbon emissions and hence emission intensities must, by construction, be higher.
Further reading
Naïve investors might expect firms with very high carbon intensities to be disqualified as issuers of green bonds. However, the graph indicates that, for Scope 1 and Scopes 1-2, a greater fraction of green bond issuers have carbon intensity above 100 tonnes of CO2 per million dollars of revenue. While this is not the case for Scopes 1-3 carbon intensities (right-hand panel), firms with the highest carbon intensity comprise virtually equal shares of green bond issuers and others.
The type of firm matters. The majority of firms with very high carbon intensities across all scopes are power producers. By contrast, financial firms, notably banks, have been the most active users of green bonds and populate the group of least carbon-intensive firms.13
Box A
Carbon emissions data and firm disclosure
The Greenhouse Gas Protocol of the World Resource Institute recommends tracking three types of corporate carbon emission: Scope 1, comprising emissions made directly by the firm; Scope 2 emissions, which comprise the emissions of suppliers of energy; and Scope 3 emissions, which include all other emissions made along the value chain (see main article).
Scopes 1 and 2 emissions are easier for the firm to track and disclose. As a result, the data cover more firms but with some limitations. From the perspective of climate change, the carbon-related impact of the firm goes well beyond its direct emissions and energy consumption. Companies influence overall emissions by using carbon-intensive inputs in the production process, or by relying on downstream activities such as carbon-intensive transport and distribution.
For this study, we obtained measures of carbon emissions at the firm level (across 42 countries) from S&P Trucost. The data are constructed from corporate annual reports and other disclosures, although the provider also uses models recommended by the Greenhouse Gas Protocol to fill in some missing data by estimating the emissions impact of disclosed activities and investments. Measurement difficulties, as well as the potentially incomplete or inconsistent reporting of all elements of Scope 3 emissions, have led researchers, asset managers and others to concentrate mostly on Scopes 1 and 2 emissions (Busch et al (2018)). Yet, the verification and estimation models used by our data provider aim to ensure a good level of consistency of Scope 3 emissions across firms (S&P Trucost (2019)). When we use both upstream and downstream Scope 3 emissions data, the time series start in 2017. If the analysis requires a longer time series, we switch to upstream emissions only.
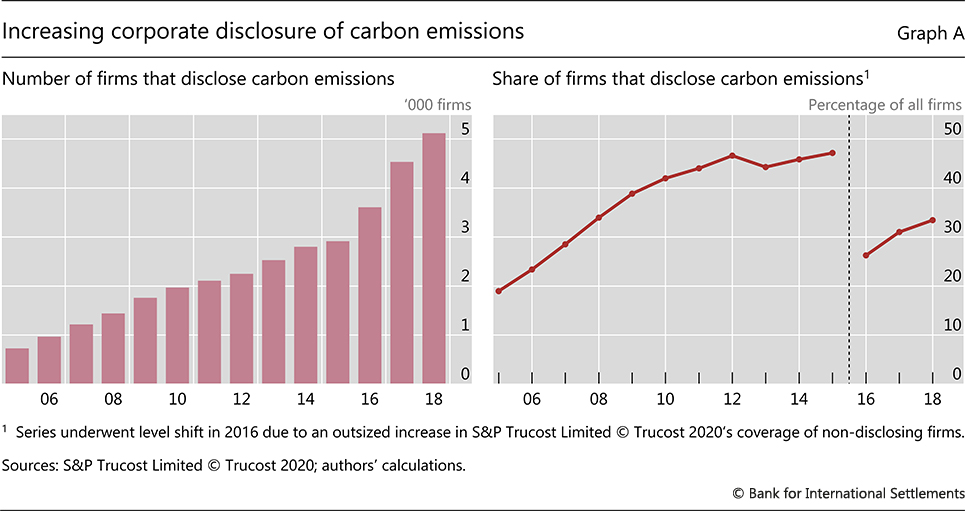
Although Trucost provides carbon emissions measures back as far as 2006, the increasing number of firms they cover over time is testament to the improvement in disclosure over the years. From 730 firms reporting some form of carbon emission in 2006, this number had increased to 1,971 by 2011, 2,916 by 2016, and 5,118 by 2019 (Graph A, left-hand panel). After a one-time downward shift in the series due to a single outsized increase in the overall coverage, the percentage of covered firms has resumed its trend increase (Graph A, right-hand panel).
There are 15 approved categories of Scope 3 activities (Greenhouse Gas Protocol (2020)). Firms often use leeway in what they include in reported Scope 3 emissions. The data used in this feature, however, are constructed to ensure a high degree of consistency across firms. One caveat to the analysis - even when based on the broadest Scope 3 emissions - is that the various carbon emission scopes may not be broad enough to capture the entire environmental benefit (cost), in particular that of a potential reduction (increase) in the carbon footprints of consumers of the firm's products.
Comparing the carbon intensities of green bond issuers with those of other firms buttresses two important points previously made in Ehlers and Packer (2017). First, even if bond proceeds flow into green projects (eg renewable energy), issuers may be (and often are) heavily engaged in carbon-intensive activities elsewhere (eg coal power plants). Second, the wide range of varying green bond standards allows a very broad church of firms to issue green bonds, each deemed to be green for different reasons.
To assess how far green bonds may contribute to the transition to a low-carbon economy, we examine whether a firm reduces its carbon intensity after issuing green bonds.14 To achieve the Paris Climate goals, for instance, would imply a sharp reduction in emissions (IPCC (2018)).
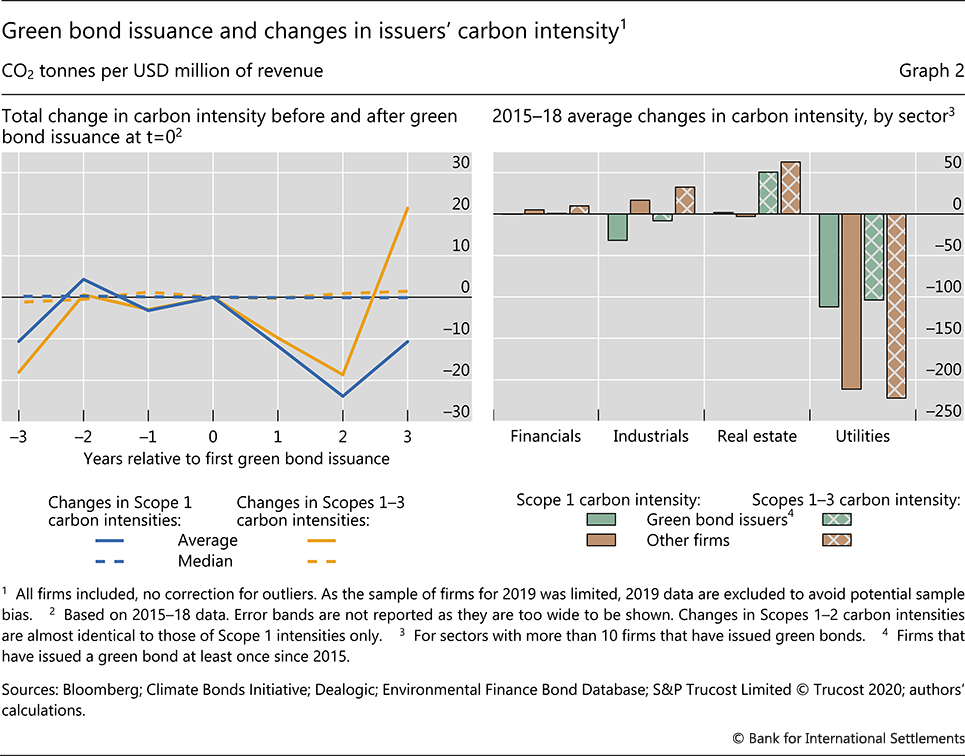
Overall, there is no strong evidence that green bond issuance is associated with any reduction in carbon intensities over time at the firm level. The left-hand panel of Graph 2 shows the evolution of green bond issuers' carbon intensity before and after issuing their first green bond, both for Scope 1 and Scopes 1-3 emissions (changes in Scopes 1-2 emission intensities are almost identical to those for Scope 1). While carbon intensities fell on average in the two years after issuance, carbon intensities rose afterwards. Around 60% of green bond issuers in our sample show a reduction in Scope 1 carbon intensities after three years; and a fall of only about 30% when looking at broader Scopes 1-3 intensities. The median changes in carbon intensity across firms before and after green bond issuance are minimal. Moreover, as these results are not statistically significant, there is no clear pattern as to whether green bond issuance led to increases or decreases in the carbon intensities of their issuers.15
Comparing changes in carbon intensities of green bond issuers and other firms over a fixed period of time and across sectors (in the three years after 2015) points to a similarly mixed picture (Graph 2, right-hand panel). Sectors with very low average emission intensities, such as the financial sector, offer little scope for material carbon emission reduction. Hence, the difference between green bond issuers and other firms in this sector is bound to be minimal. In some sectors with typically higher carbon intensities, such as industrials and real estate, green bond issuers appear to have achieved lower carbon emissions than firms that did not issue green bonds. However, in the important utilities sector - which includes energy production and distribution - green bond issuers have, on average, achieved smaller reductions in carbon intensity.16
The results do not imply that projects financed by green bonds did not deliver their promised environmental benefits. They simply indicate that issuing green bonds has not resulted in a significantly lower level or significantly higher reductions in carbon intensity at the firm level. What might be the desirable properties of a complementary green rating scheme that could provide additional support to the reduction of carbon emissions? We discuss this next.
Desirable properties of a complementary green rating system
A firm-level green rating system should have three high-level objectives. For one, it should provide additional incentives for the rated companies to contribute to the attainment of climate goals such as those of the Paris Accord. Secondly, it should help investors in their decision-making processes - in particular investors without the resources to do their own "green" due diligence. Finally, the system should allow investors and other stakeholders (eg auditors, regulators and policymakers) to check firms' improvements and verify that the desired climate mitigation effects are achieved.
Although there is no guarantee that any single rating system can achieve these high-level goals, we argue that there are a number of desirable properties that such a rating system should possess, at a minimum. We organise their discussion under each of the three objectives listed above. We provide some design suggestions to illustrate how a rating system can contribute to these high-level objectives. Obviously, further analysis and practical experience are necessary to ascertain the ability and feasibility of a rating system to deliver the intended results.
Importantly, the rating system that we explore is distinct both from the traditional ratings of creditworthiness as well as current green bond labels. It specifically aims at the CO2 emission reduction of firms and does not take into account other relevant green objectives such as biodiversity, the mitigation of other greenhouse gases, more efficient water use, or climate adaptation.
The incentives of firms should be aligned with climate goals. We argue that a firm-level rating is better suited to deliver this property than a project-based classification. Indeed, the firm is the decision-making unit when it comes to the carbon footprint of economic activity: that is, the production process, choices of inputs, outputs and means of distribution. Ratings that are directly related to the company's overall emissions should provide incentives for the firm to obtain a better rating by increasing the carbon efficiency of its production. The additional information also allows policymakers and investors to undertake actions affecting the firm that are more directly aligned with high-level climate goals.
Creating the right incentives crucially depends on choosing the right measures for constructing a rating. As discussed in the data section above, carbon intensity is a single measure that allows firms to show they have improved carbon efficiency at a given level of economic output or firm size. Therefore, rewarding a reduction in carbon intensity is an effective way to reduce firm-level carbon emissions, without incentivising firms to reduce economic activity or split up operations.
Rating buckets (eg similar to credit ratings) make firms easier to compare, and can motivate them to outperform their competitors. Rating buckets (and the achievement of a certain rating level) based on carbon intensity levels, constitute natural yardsticks for comparing firms' performance in greening their activities (Shleifer (1985)). Assuming a growing preference of investors for "greener" business models, firms that adapt faster will eventually enjoy lower funding costs. Firms in a given sector can aim at improving their rating to show investors, especially the ones whose allocation follows a best-in-class approach, that they are greener than their direct competitors.
Ratings should be on a finer grid for firms with higher carbon intensity. This will provide stronger incentives for the highest emitters to improve. This matters because the distribution of carbon intensity is highly skewed. The firms with the highest carbon intensity are also the highest carbon emitters in absolute terms (Graph 3, right-hand panel). Indeed, the efforts these firms make to reduce their carbon footprint yield the largest social benefits.
A green rating should help investors make their investment decisions. At least three general features of a rating system can assist investors in their decision-making: (i) simplicity; (ii) sufficient granularity; and (iii) ratings stability.
A rating system with a limited number of buckets would be relatively simple to understand, as most investors are used to rating systems of this nature. The buckets also create a coordination device for investors - investor preferences or mandates could be straightforwardly related to rating buckets. Eligible securities could be defined as those with a given rating or better. Investment managers could easily communicate this to their clients.
Simplicity can also stem from the data used. Taking a factual backward-looking measure such as a firm's carbon intensity does not require forward-looking forecasts or potentially more complicated scoring methods.
A certain level of granularity helps investors identify firms that best fit into their investment strategy.17 Granularity in these respects is superior to merely identifying firms as either green or non-green.18 Yet, a system that is too granular - for instance reporting just the raw carbon intensity numbers - may be too complex. Ultimately, the most appropriate degree of granularity would require consultations and practical experience to establish, as it would be hard to pin down strictly on the basis of principles alone.
Investors prefer ratings to be stable over the short run as they want to form a view of a firm's likely performance over their investment horizon. While the ultimate aim of our rating system is to incentivise change, an improvement in carbon intensities will usually materialise over a longer time horizon.
Investors and other stakeholders should be able to verify firms' improvements. A green rating can only provide a useful signal for investors and other interested stakeholders if it is reliable. As data on firms' carbon intensity have become widely available for most listed firms, basing a rating directly on this measure ensures that a rating's content can be easily verified. Further, carbon intensity is an outcome-based measure that allows a direct assessment of whether or not firms have actually become more carbon-efficient.
From the perspective of verifying improvements, the rating would ideally be based on the broadest scope of emissions available. While conservative estimates of aggregate emissions across firms would rely on narrower measures to mitigate double-counting among listed firms, a firm-level analysis should capture a firm's entire value chain. This avoids loopholes as firms cannot improve their carbon efficiency simply by outsourcing carbon-intensive activities (Ben-David et al (2018)).
Rating system challenges - data quality and institutional considerations
The usefulness of a rating based on firms' carbon intensity depends on the quality of the available data. There are currently no mandatory audits of carbon emissions data. But a growing number of third parties already verify, disseminate and use such data, which makes for a certain level of consistency (see also Box A). Prominent private sector efforts to improve company disclosures are under way (FSB TCFD (2017), Ceres (2018)). Mandatory reporting based on legal standards and audits could further enhance data quality and consistency. Technological advances in measuring carbon emissions will further increase precision and reduce data collection costs.
Who pays for the green rating and who provides it are also important considerations. In the case of many conventional credit ratings, as well as a number of current green ratings, it is often the firms themselves that bear the costs. But the willingness to pay for such a rating may be limited - especially among carbon-intensive firms, whose coverage would be important to the rating system's effectiveness in helping to achieve higher-level climate goals. Alternative arrangements are feasible. A rating system based directly on the carbon emissions of a firm could be provided by any institution with access to such data on an unsolicited basis. The third parties that construct, collect, and verify carbon emissions data would perhaps be in prime position to supply such a rating at potentially very low cost. Official approval processes for rating providers - similar to the proposed third-party verification of green labels in the European Union - could furnish the ratings with additional credibility.
A stylised example of a carbon intensity-based rating system
There are many ways to construct rating schemes with the desired properties and design features outlined above. We provide one simple example and an enhancement (Box B) to illustrate our suggestions above. The key aspects of our example are open to choice, including the exact rating thresholds, the number and labelling of buckets, and the degree of emphasis on the level of carbon intensity, as compared with changes in carbon intensity.
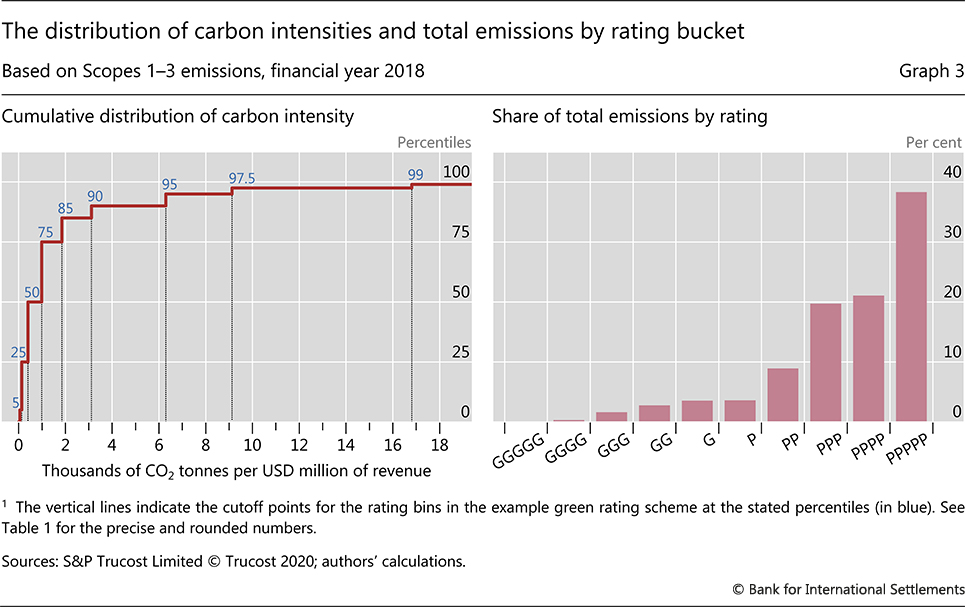
In our example, we define rating thresholds as fixed levels of carbon intensity so that, over time, all firms can improve their rating by reducing their carbon intensity. This introduces a dynamic element into the rating, together with an incentive for firms to cut their carbon intensities. We start with the distribution of firms' carbon intensity at the end of their financial year 2018 (for most firms, the latest observation).
For simplicity, we assume a 10-bucket rating grid including five buckets for the 10% of firms with the highest carbon intensity, ie as many as for the other 90% of the firms. The labels start from GGGGG, which denotes the greenest firms covered in the data, and go down to PPPPP for the ones that pollute most (highest carbon intensity).
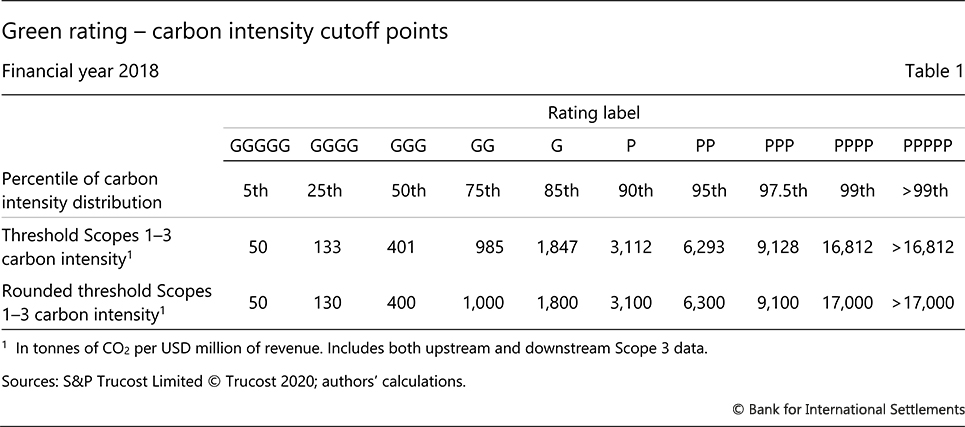
Table 1 provides the relevant cutoff points based on firms' carbon intensity as of 2018 (the latest available data for most firms). As the exact carbon-intensity thresholds are arbitrary, we provide rounded numbers for simplicity (last row). Ten buckets afford sufficient granularity to illustrate the benefits of an asymmetric grid. A proper feasibility study, which would go well beyond the scope of this paper, would identify how fine the grid should optimally be.
The thresholds point to a key issue in designing a rating system based on carbon emission intensities. The distribution of carbon intensities across firms is highly skewed (Graph 3, left-hand panel). Even when allocating half of the rating buckets to the top 10% of emitters, the distance between thresholds for these buckets is still high. The extreme skewness of the distribution reaffirms that it is crucial for any rating system aligned with climate goals to provide strong incentives for high emitters to improve. Even though our PPPPP rating bucket contains only the 1% of firms with the highest carbon intensities, these are responsible for close to 40% of total Scopes 1-3 emissions in 2018 in our sample of 16,000 firms (Graph 3, right-hand panel).
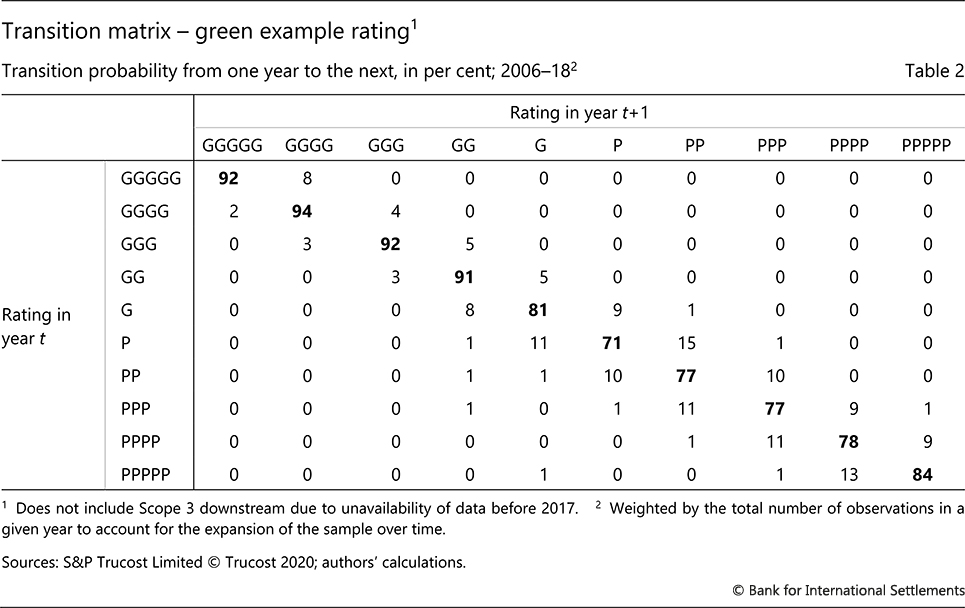
Our assumed grid can be used to test the stability (one-year-ahead) of firm ratings based on historical data (Table 2). The stability appears quite high. As expected, stability is lower for lower ratings - as they contain a smaller number of firms - but only slightly so. This degree of stability is no worse than that of credit ratings (Fitch (2020), Moody's (2020)), which should suffice for most fixed income investors.
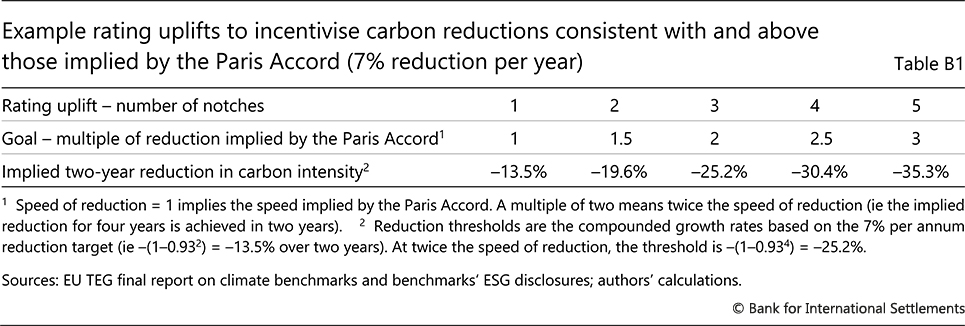
Further incentives for firms to reduce emissions can be introduced by enhancing the rating system. For instance, a 10-year reduction of carbon emissions at 7% per annum (as, for instance, required in the proposed EU climate benchmarks (EU TEG (2019c)) would imply roughly a halving of emission intensities for given revenues. One way of generating additional incentives is to award rating uplifts to firms that fulfil or exceed the reduction target for carbon intensities.19 Box B outlines how such a rating system might work.
Box B
Rating uplifts to provide extra incentives for Paris-aligned emission reductions
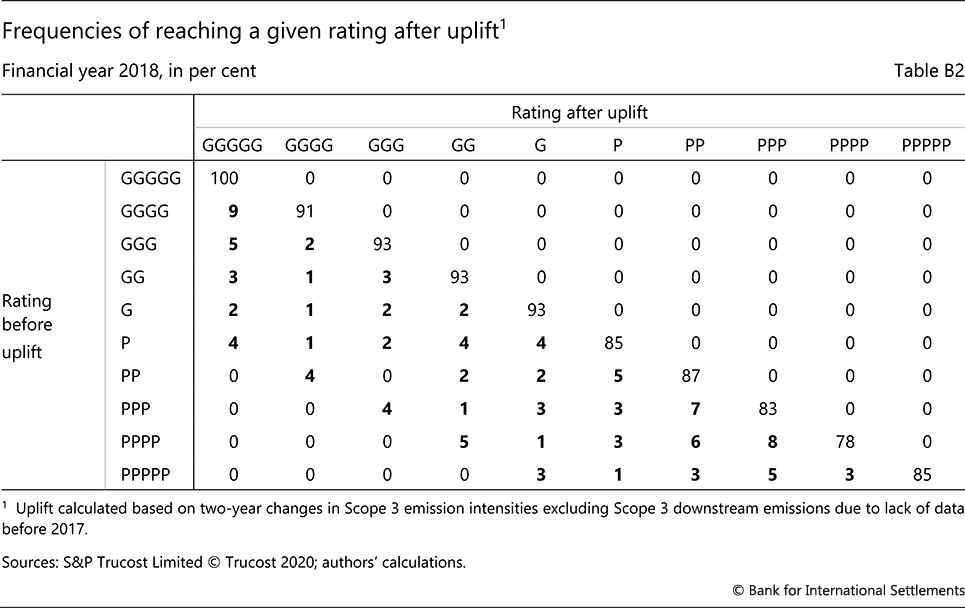
Building on the green ratings system discussed in the main article, the enhancement described here shows how additional incentives for emission reductions might be created, through rating uplifts that occur if firms fulfil reduction targets implied by the Paris Accord. We use a 7% reduction per year as a benchmark - as in the proposed EU climate benchmarks (EU TEG (2019c)). Table B1 provides an example scheme of such uplifts. Using data for end-financial year 2018, the frequency of uplifts (or remaining in the same category) is presented in Table B2, as calculated based on two-year reductions in carbon intensity.
A desirable feature of such a system is that firms with low green ratings can achieve substantial improvements. Uplifts are temporary by construction and are taken away if a firm does not achieve the same reduction in the following two-year period. Even though such a system is less stable by construction than one without uplifts, the degree of stability is not substantially lower. In our example, the probability of achieving the same rating in the next year ranges from 64% to 83% depending on the rating bucket. Stability can be increased, for instance, by lengthening the time horizon over which reductions are measured.
Even stronger incentives could be introduced by enforcing downgrades if reduction targets are not fulfilled or if carbon intensities increase over time.
Conclusions
The evidence that the current system of green bond finance is significantly accelerating the transition to a low-carbon economy is mixed. This feature explores the desirable properties of a complementary rating system that could further encourage firms to improve their carbon efficiency. We argue that such a system should deliver firm-level ratings based on carbon intensities. We illustrate in particular that sufficient granularity is desirable to distinguish among the heaviest carbon emitters for which progress is essential to mitigate climate change.
An additional benefit of firm-level ratings is that investors could also use them to rate any financial instruments issued by a firm, including stocks and not only bonds, which only a limited number of companies issue. The ratings could also be applied to firms' products: consumers might take an interest in such ratings if they prefer to buy from low-carbon firms, or from firms with better ratings than those of their industry peers.
Our analysis is merely laying out important considerations for ratings to foster carbon efficiency in economic activity. More analysis and experience will be needed before a practical green rating system can be implemented, to ensure that it will deliver the appropriate incentives.
While climate change mitigation is a key policy goal, this is not to say other environmental goals such as water security, biodiversity or climate adaptation are less important. We explore a rating system designed to help reduce firms' carbon emissions, but some of the principles - in particular the focus on simple outcome-based measures - may be applicable to other environmental goals as well.
Data on broader emission scopes would further help in assessing a firm's overall carbon footprint, making outcome-oriented standards even more meaningful. The currently broadest Scope 3 emission measures analysed in this feature are designed to take account of emissions along the entire production and distribution processes. To further improve this already broad-based measure, the relative environmental benefits (or costs) of the firm's final products might be included. Efforts are currently under way to include "avoided emissions" (dubbed Scope 4 emissions) to reflect the relative carbon emission impact of the goods a firm produces (Climate Disclosure Standards Board (2020)).
References
ASEAN Capital Markets Forum (2018): ASEAN Green Bond Standards, www.theacmf.org/images/downloads/pdf/AGBS2018.pdf.
Ben-David, I, S Kleimeier and M Viehs (2018): "Exporting pollution: Where do multinational firms emit CO2?", NBER Working Papers, no 25063.
Beschloss, A and M Mashayekhi (2019): "A greener future for finance - green bonds offer lessons for sustainable finance", IMF Finance and Development, vol 56, no 4, December.
Bolton, P, M Despres, L Pereira da Silva, F Samama and R Svartzman (2020): The green swan, Bank for International Settlements and Bank of France.
Busch, T, M Johnson, T Pioch and M Kopp (2018): "Consistency of corporate carbon emission data", University of Hamburg and WWF.
CDP Worldwide and WWF International (2020): "Temperature Rating Methodology - Beta version", July.
Ceres (2018): "Disclose what matters: bridging the gap between investor needs and company disclosures on sustainability", August.
Climate Action 100+ (2019): "2019 Progress Report", October.
Climate Bonds Initiative (2019): "Climate Bonds Standard V3.0", December.
--- (2020): "Climate Bonds Taxonomy", January.
Climate Disclosure Standards Board (2020): "Scope 4: do we need a new category of emissions to better address corporate climate action?", 20 January.
Cui, Y and N Liu (2020): "Interpretation and suggestions on the Green Bond Endorsed Projects Catalog (2020 Edition)", International Institute of Green Finance (in Chinese).
Ehlers, T and F Packer (2017): "Green bond finance and certification", BIS Quarterly Review, September, pp 89-104.
European Investment Bank and Green Finance Committee of China Society for Finance and Banking (2018): "Phase II Report of Joint Research and Action", December.
EU Technical Expert Group on Sustainable Finance (2019a): "Report on EU Green Bond Standard", June.
--- (2019b): "Taxonomy: Final report of the Technical Expert Group on Sustainable Finance", March.
--- (2019c): "Final report on climate benchmarks and benchmarks' ESG disclosures", September.
Fender, I, M McMorrow, V Sahakyan and O Zulaica (2020): "Reserve management and sustainability: the case for green bonds?", BIS Working Papers, no 849, March.
Financial Times (2020): "Climate change: asset managers join forces with the eco-warriors", 8 August.
FitchRatings (2020): "Global Corporate Finance 2019 Transition and Default Study", July.
FSB Task Force on Climate-Related Financial Disclosures (2017): "Final Report - Recommendations of the Task Force on Climate-related Financial Disclosures", June.
G20 Green Finance Study Group (2016): "Green finance synthesis report 2016", September.
Intergovernmental Panel on Climate Change (2018): "Special report - global warming of 1.5°C", October.
International Capital Markets Association (2018): "Green bond principles - voluntary process guidelines for issuing green bonds", June.
--- (2020): "Sustainability-linked bond principles - voluntary process guidelines", June.
Moody's Investor Service (2020): "Investment-grade transition risk quarterly update - 2020Q1", June.
Partnership for Carbon Accounting Financials (PCAF) (2020): "First global standard drives financial institutions to measure and track the climate impact of their lending and investment portfolios", 3 August.
People's Bank of China, National Development and Reform Commission, and the China Securities Regulatory Commission (2020): Green Bond Endorsed Projects Catalogue (Consultation Draft).
S&P Global Trucost ESG Analysis (2019): "Methodology - Trucost Scope 3 Carbon Emissions Data".
Shleifer, A (1985): "A theory of yardstick competition", The RAND Journal of Economics, vol 16, no 3, pp 319-27.
The Economist (2020): "The trouble with green finance", 20 June, pp 10-1.
The Greenhouse Gas Protocol (2004): "A corporate accounting and reporting standard - revised edition".
--- (2020): "Corporate Value Chain (Scope 3) Standard", https://ghgprotocol.org/standards/scope-3-standard.
United Nations (2015): "Paris Agreement", December.
1 The views expressed in this article are those of the authors and not necessarily those of the Bank for International Settlements. We thank Claudio Borio, Pierre Cardon, Stijn Claessens, Ulrike Elsenhuber, Ingo Fender, Jon Frost, Corrinne Ho, Kumar Jegarasasingam, Mike McMorrow, Luiz Pereira, Nikola Tarashev, Evertjan Veenendaal, Philip Wooldridge and Omar Zulaica for helpful comments. We thank Alan Villegas and Yifan Ma for excellent research assistance.
2 Global green bond issuance as per the authors' calculations. Total global bond issuance from Dealogic DCM Research.
3 Another frequently cited question is whether standards and certification are consistent and sufficiently stringent across jurisdictions. The proposed EU green bond standard aims to address this problem (EU TEG (2019a)). Another important example is the mapping of taxonomies for two of the largest jurisdictions applying green finance, the European Union and China (EIB and China GFC (2018)).
4 Green bond labels can reward ways of contributing to sustainable growth other than reducing carbon emissions. Projects that are green without necessarily reducing carbon emissions include those that promote biodiversity or foster processes that reduce consumption of natural resources, for example.
5 In this feature, we focus on the carbon emissions related to activities of the corporate entity where the most disclosure of carbon emissions has occurred. At the level of the sovereign, setting outcome-based standards would require a different approach, which is beyond the scope of this article.
6 China's regulators have drafted for consultation a new green bond catalogue that aims to unify various national green bond and finance standards, further taking into account international standards (People's Bank of China, National Development and Reform Commission, and the China Securities Regulatory Commission (2020)). Certain categories (eg coal mining and oil extraction) have been removed, although some differences remain vis-à-vis the EU sustainable finance classification catalogue (Cui and Liu (2020)). For another example of standards established by a supranational regional body beyond Europe, see ASEAN Capital Markets Forum (2018).
7 Those include CDP, Four Twenty Seven (an affiliate of Moody's), S&P Trucost, The 2° Investing Initiative, Transition Pathway Initiative and many others. In addition, a wide range of ESG data providers also cover carbon emissions data.
8 However, these scopes do not cover possible reductions in consumers' carbon footprints (eg producing products with better energy efficiency). Such potential environmental benefits cannot be captured in our analysis.
9 High-carbon intensity firms produce by far the highest share of total emissions (see Graph 3, right-hand panel). Some very large firms could theoretically combine significant carbon emissions in some aspect of their business with low carbon intensity (and, in such cases, project-based green ratings would provide them with additional incentives to cut emissions). However, such cases are rare.
10 For firms in sectors with naturally less carbon-intensive business models (eg financials), revenue fluctuations do not necessarily translate into direct (Scope 1) emissions. For higher emission scopes, however, there is a very strong relationship between revenues and carbon emissions in our sample for all sectors. The correlation coefficient of year-on-year percentage changes in Scopes 1-2 and Scopes 1-3 emissions with year-on-year percentage changes in revenues are 0.8 and 0.95, respectively, in our sample (0.94 and 0.93 for financials). For higher scopes, changes in revenue hardly vary without causing changes in emissions. In fact, on average, they translate into greater relative changes in emissions: a 1% year-on-year change in revenues translates into a 1.1% change in Scopes 1-3 emissions on average in our sample (t-stat >800).
11 For more details of the construction of comprehensive green bond issuance data and a discussion of the different types of green bond certification, see Ehlers and Packer (2017).
12 For better comparability, we restrict the sample of green bond issuers and other firms to 2015-18, as there was no significant green corporate bond issuance before 2015.
13 Financial firms are a special case, as their business activities produce relatively few carbon emissions. Their investments, however, may be in carbon emission-intensive industries. But this is not reflected in current carbon emission scopes. A number of large banks and investors have begun to develop standards for financial institutions to better track the climate impact of their lending and investment portfolios (PCAF (2020)). Excluding financials as issuers of green bonds would push the carbon intensity distribution of green bond issuers to the right.
14 This is a simple benchmark; more sophisticated methods of assessing the climate-related impact of green bond issuance would require a full multivariate model to precisely lay out the counterfactual, ie the change in carbon emission intensity had a firm not issued green bonds.
15 The error bands are very wide, with a single standard error many times the absolute mean values at every horizon.
16 Several caveats apply. For one, depending on the type of project that green bond proceeds are financing, the environmental benefits may appear only far in the future, beyond the horizon of the current empirical analysis. In addition, other unobserved variables may differ between green and other issuers, confounding the comparison. That said, project-level green bond issuance is not associated with lower firm-level carbon intensity.
17 For instance, investors who diversify their portfolio across sectors, as do asset managers with a market-wide benchmark, could target firms with the lowest carbon intensity within each sector.
18 In particular, a binary system may not provide strong incentives for firms that are the largest emitters of carbon to improve, as it may not be possible to become green enough to cross the threshold. Conversely, if the threshold for a binary green rating were too loose, it would not only lose its signalling value but would provide only a limited incentive for firms to substantially improve.
19 A new "temperature rating" by CDP Worldwide and the WWF (2020) takes a different approach, calculating a temperature score for companies or asset portfolios based on the ambitiousness of companies' emission targets. A temperature score of 1.5°C or less indicates compliance with the Paris goals.