Cross-border commercial real estate investment in Asia-Pacific
Cross-border investment in Asia-Pacific commercial real estate (CRE) has increased since the Great Financial Crisis. Amid low interest rates and ample liquidity, financial investors have sought higher returns from illiquid CRE assets. The search for yield has been particularly evident among investors from outside the Asia-Pacific region, who are almost exclusively portfolio investors and may constitute the marginal investor base. In response to the Covid-19 shock, these investors have withdrawn from certain Asia-Pacific CRE sectors, and some have flocked to regional property markets perceived to be safe. Authorities have introduced various policies to mitigate the effect of the pandemic on CRE markets.1
JEL classification: F21, R33, R38.
Real estate is the world's single largest asset class, accounting for 60% of all global assets on some estimates.2 Real estate is also widely used as collateral for borrowing from financial institutions. In this way, real estate markets can significantly affect the financial system and economy. For example, losses on commercial real estate (CRE) loans hit the banking systems of Australia and Japan in the early 1990s, and those of some Southeast Asian economies during the Asian financial crisis of 1997-98.
As an international asset class, real estate has gained further importance since the Great Financial Crisis (GFC). Commercial property prices have become more synchronised across countries (CGFS (2020)), while cross-border investment in CRE has surged, both in size and as a share of total real estate investment. One driver is low interest rates, which prompt search-for-yield behaviour on the part of the financial investors who account for most cross-border investment.
We track the evolution of cross-border investment in CRE markets in Asia-Pacific, focusing on the financial stability implications. We show that cross-border investment is dominated by vehicles that issue financial claims on CRE to their investors, as opposed to direct investor purchases of the properties themselves. Cross-border investors also generally take a portfolio approach to CRE investment, which can make local CRE markets overly sensitive to cyclical yield differentials and financial conditions outside the host economies. We show that, during the Covid-19 crisis, cross-border financial investors disproportionately reduced their CRE investment in Asia-Pacific, and shifted towards a few markets perceived as safe havens in the region. Hence, while important for international risk-sharing, cross-border financial investment can amplify volatility in CRE markets.3
Key takeaways
- Commercial real estate markets in Asia-Pacific offer attractive opportunities to cross-border investors searching for yield.
- Foreign investment vehicles dominate cross-border investment but their activity is also volatile as they are sensitive to global financial conditions and yield differentials.
- During the Covid-19 crisis, it was global financial investors who most drastically cut their activity in these markets, while some also shifted towards asset classes perceived as safe havens in the region.
Statistical data: data behind all graphs
This article starts by providing definitions and a taxonomy for the analysis of CRE investment, followed by a stocktake of developments in Asia-Pacific CRE markets. It then covers the drivers of cross-border CRE investment. After describing the impact of the Covid-19 pandemic on Asia-Pacific CRE investment, we conclude by discussing policy responses and challenges.
Definition of CRE and classification of investors
Our baseline measure of CRE includes office buildings, retail and industrial spaces and hotels as well as professionally managed residential real estate (RRE) properties, such as condominiums, because the latter are largely acquired for investment purposes.4
The main data source is Real Capital Analytics (RCA), which supplies data on property transactions in primary and secondary markets globally.5 In particular, RCA tracks both purchases and sales conducted by individual investors, making the detailed transaction record available via the RCA investor module. This record allows the quarterly volume of CRE transactions (a flow measure) to be constructed.
The location and type of entities engaged in CRE transactions constitute two key dimensions of analysis. We classify a CRE investor as a cross-border investor if the country location/domicile of the investor and the country location of the property are different, and as a domestic investor if they are the same. We further distinguish between cross-border investment from outside the Asia-Pacific region by global investors and cross-border investment from other jurisdictions inside the region by regional investors. The distinction is motivated by Portes and Rey (2005), who show that distance matters for equity flows, and by previous findings for banking flows (Remolona and Shim (2015)) and bond flows (Ng et al (2019)) to the effect that global investors cut investment in the Asia-Pacific region in times of financial stress but regional ones increased it.
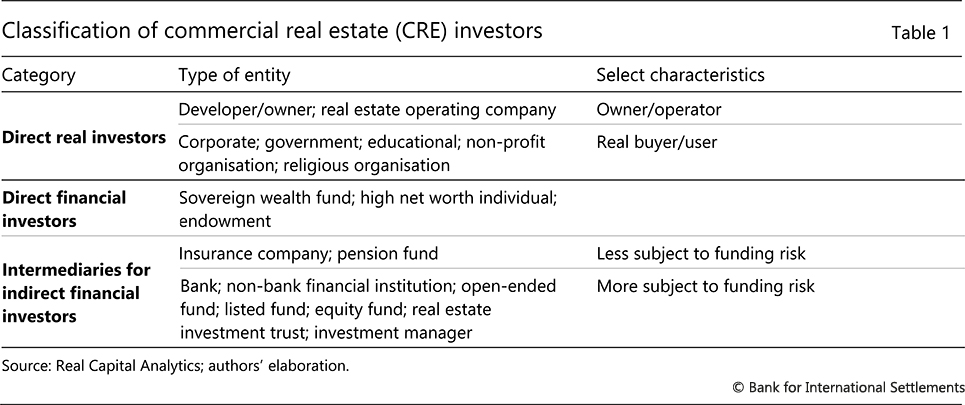
We also categorise CRE investors according to two dimensions of their business model: whether their main objective is business use or financial return; and whether they buy properties directly or invest in financial claims on them. Table 1 shows the three resulting categories: (i) direct real investors (henceforth "real investors"), such as property developers, operators and users, who also tend to have a long-term horizon and local market knowledge; (ii) direct financial investors, such as sovereign wealth funds and high net worth individuals, who buy property for investment purposes (such as rental income), but are direct, long-term owners of the specific property itself; and (iii) financial intermediaries for indirect financial investors, such as property funds and real estate investment trusts (REITs). Intermediaries issue financial claims on CRE which are then held by indirect financial investors. Note that we do not observe the indirect investors who purchase financial claims, but only the transactions by the intermediaries investing on their behalf.
The financing model of intermediaries catering to indirect financial investors gives rise to funding risks, which may be relevant to financial stability. Some intermediaries are less subject to funding risk because they do not engage in liquidity or maturity transformation (eg insurance companies and pension funds) and thus can afford a long-term investment horizon. By contrast, other intermediaries, such as banks, finance companies, investment funds, REITs and investment managers, are more subject to funding risk because they offer redemption terms to investors that are shorter than those of the underlying assets, and hence engage in some form of liquidity or maturity transformation. As a consequence, they could be pressured to sell properties when financial market volatility rises or when investors redeem their stakes in the funds, thereby introducing procyclical behaviour (see eg Shek et al (2015)). For example, open-ended funds that invest in CRE promise daily liquidity while investing in illiquid assets. Concerns about this type of mismatch could trigger redemptions if market sentiment deteriorates.6 This would be compounded if funds are debt-financed and unable to roll over their funding. For example, REITs often use debt to finance their acquisitions subject to leverage limits and also expose investors to equity market risk.7, 8
Asia-Pacific CRE markets and cross-border investment
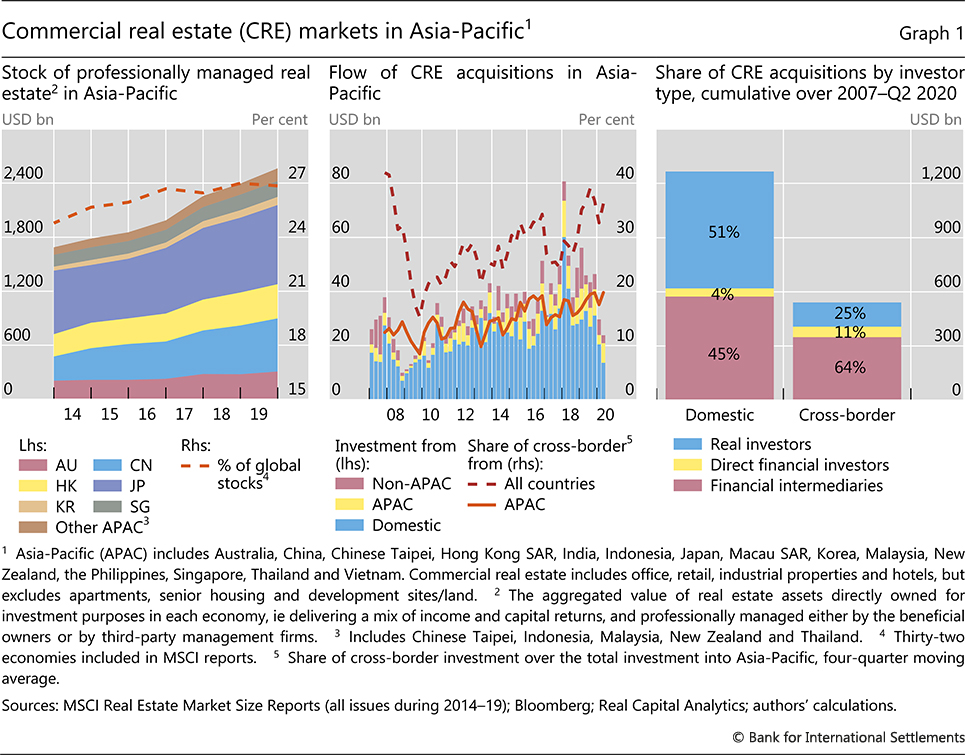
Globally, the value of real estate managed professionally and held for investment purposes, as defined by the MSCI Real Estate Market Size Report, increased by 37% between 2014 and 2019, to $9.6 trillion.9 In the 32 economies with the largest real estate markets, managed real estate assets amount to over 16% of the value of their equity markets. At end-2019, 11 Asia-Pacific economies accounted for $2.6 trillion (or 27%) of the global stock (Graph 1, left-hand panel). Within Asia-Pacific, professionally managed real estate grew relatively rapidly in China and Japan. In some economies, the value of such real estate relative to GDP is large. For example, in 2019, it reached 103.3% in Hong Kong SAR and 47.3% in Singapore.
Cross-border investment is a significant part of the region's total CRE investment. The four-quarter moving average share of cross-border CRE investment was 36% in Q2 2020, when measured by the flow of acquisitions (Graph 1, centre panel). This is considerably higher than the comparable numbers for RRE, which range within single digits in many Asia-Pacific economies.10
Intraregional flows amount to approximately half of cross-border CRE flows in Asia-Pacific. In particular, Chinese investors have predominated among foreign property buyers, although their activity appears to have dropped from its peak in a number of markets. Still, investors located in China and Hong Kong SAR account for about half of all new intraregional cross-border CRE acquisitions, and those from Singapore for most of the rest. This largely reflects the roles of Hong Kong SAR and Singapore as major financial centres. Most cross-border CRE investment flows out of Singapore originate with entities headquartered there. By contrast, China-headquartered entities accounted for over half of cross-border real estate investment flows out of Hong Kong SAR.11
Financial intermediaries for indirect financial investors accounted for the lion's share of cross-border acquisitions in Asia-Pacific, or 74% in the first half of 2019 (Table 2, third column, upper half). The share was much higher than that in domestic acquisitions, 46% (Table 2, first column). Those intermediaries consist mainly of funds, investment managers and REITs, which are more likely to be exposed to funding liquidity or market liquidity shocks (see Box A for REITs in Asia-Pacific).12
Further reading
Importantly, cross-border investment is quite volatile during crises. For example, the share of cross-border investment in regional CRE markets declined from over 40% to less than 20% during the GFC (Graph 1, centre panel). It then gradually recovered, approaching its pre-GFC levels by 2019. Supplementary data also indicate that the share of cross-border CRE acquisitions in total gross capital flows rose from 2.1% in 2009 to 4.2% in 2018. In the Asia-Pacific region, the top six investors in terms of the cumulative investment volume from 2007 to 2020 are either direct financial investors or financial intermediaries.13
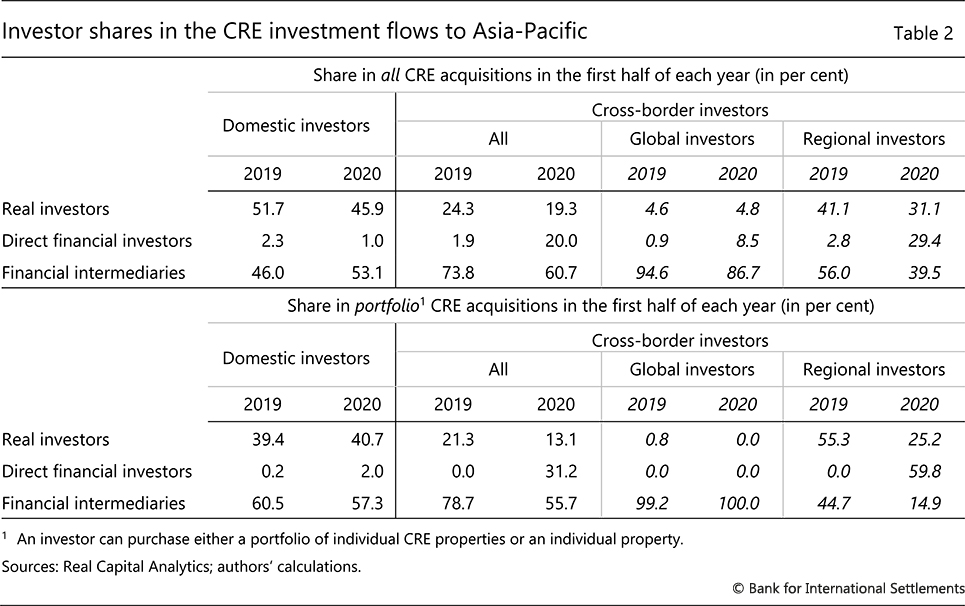
Domestic investors, by contrast, include a much higher share of real investors, a 52% share in 2019, compared with a 24% share for cross-border investors. However, real investors are still subject to fluctuations in international funding market conditions. Both domestic and cross-border real investors in CRE markets have increased their reliance on international loan and bond markets. In particular, according to Chui et al (2018), property developers in several Asia-Pacific economies have been shifting away from domestic bank loans and choosing to issue debt securities, often in foreign currency. The latest data on loan and bond financing indeed show the trend continuing until the onset of the Covid-19 crisis (see Box B).
The differences in investor composition between domestic and cross-border CRE acquisitions are magnified when we focus on portfolio deals only. Portfolio CRE acquisitions accounted for 30% of domestic and 46% of cross-border CRE acquisitions in the first half of 2019, while individual property acquisitions accounted for the rest. Intermediation for indirect financial investors made up 79% of all cross-border portfolio investment (Table 2, third column, lower half). Moreover, this slice of the data makes it clear that the global cross-border investors purchasing Asia-Pacific CRE portfolios are almost exclusively financial intermediaries (fifth column).
Box A
Asia-Pacific regional REIT markets and their role in cross-border investment
Amanda Liu, Ilhyock Shim and Vladyslav Sushko
Investors can access Asia-Pacific property markets by investing in real estate investment trust (REIT) shares listed on major stock exchanges or non-listed REITs. Japan has the largest REIT market by market capitalisation, followed by Australia, Singapore, Hong Kong SAR and Korea (Graph A, first panel). Japan's and Australia's REITs tend to focus almost exclusively on domestic properties. By contrast, REITs listed on exchanges in Hong Kong SAR and Singapore make fairly sizeable allocations to other markets in the Asia-Pacific region. Hence, they play an outsized role in cross-border REIT investment.
Investors from outside Hong Kong SAR constitute the majority of the shareholders in the Hong Kong SAR-listed LINK REIT, the largest in the region (second panel). Asset management firms (such as BlackRock, State Street Global Advisors and Vanguard), custodian banks (such as Bank of New York Mellon) and global institutional investors (including pension and sovereign wealth funds) are the top holders. Moreover, 14% of LINK REIT portfolio holdings are properties outside Hong Kong SAR (third panel). Singapore also features a bourgeoning REIT market (S-REITs) with a considerable allocation to commercial real estate in other jurisdictions in the region - amounting to some 23% of the portfolios (fourth panel).
 This reflects, in part, the preference for Singaporean real estate firms to spin off rental properties into REITs, thus generating capital from REIT offerings that can be redeployed.
Several other jurisdictions are in the process of developing the industry. The Philippines launched a coordinated set of rules on public listing of REITs earlier in 2020, which are also designed, in part, to make REITs more accessible to retail investors. China announced plans in April 2020 to create a public market for REITs, aiming to channel personal savings and private capital into infrastructure projects.
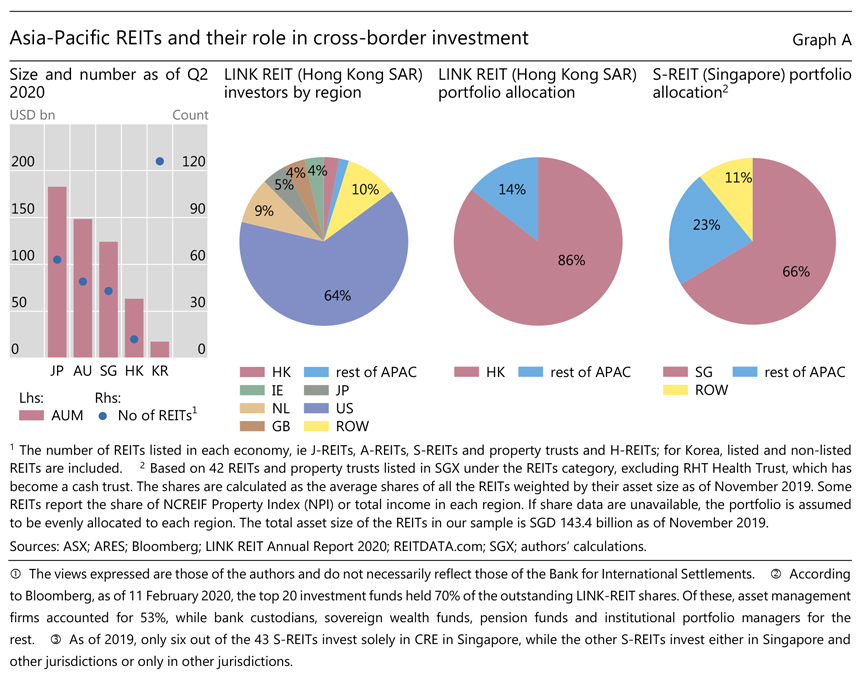
The views expressed are those of the authors and do not necessarily reflect those of the Bank for International Settlements. According to Bloomberg, as of 11 February 2020, the top 20 investment funds held 70% of the outstanding LINK-REIT shares. Of these, asset management firms accounted for 53%, while bank custodians, sovereign wealth funds, pension funds and institutional portfolio managers for the rest. As of 2019, only six out of the 43 S-REITs invest solely in CRE in Singapore, while the other S-REITs invest either in Singapore and other jurisdictions or only in other jurisdictions.
Box B
Foreign currency funding of real investors in Asia-Pacific commercial real estate
Amanda Liu, Ilhyock Shim and Vladyslav Sushko
Financial investors in commercial real estate (CRE) markets play a greater role than suggested by their share in cross-border or domestic deals. This is because even domestic real investors, eg property developers, fund a large share of their transactions in international financial markets. FX bank and bond financing by real CRE investors in Asia-Pacific rose to a third of their total funding in 2019, equivalent to $30 billion per quarter (Graph B, left-hand panel).
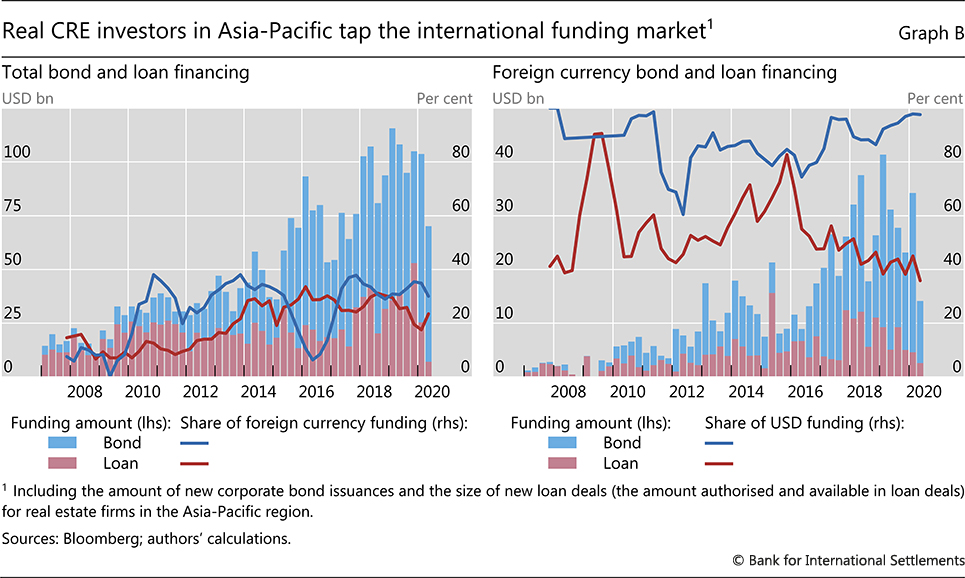
Real CRE investors in the Asia-Pacific region obtain most of their FX funding by issuing US dollar-denominated bonds (Graph B, right-hand panel). In particular, regional property developers have found it cheaper to borrow in US dollars in offshore bond markets. However, foreign currency funding can be fragile, as it is frequently of short duration, Indeed, the total amount of offshore US dollar bond issuances by Chinese property developers fell by 8.2% to $25.8 billion in Q1 2020, as compared with Q1 2019, and further dropped to $5.5 billion in Q2 2020, representing a year-on-year decrease of 74.8%. The number of new bond issuances also fell by 60.7% in Q2 2020 compared with Q2 2019. Finally, in the first half of 2020, Chinese property developers tended to issue offshore bonds with shorter tenors, suggesting that the drop in issuance was at least partly supply-driven due to tighter international funding conditions.
The views expressed are those of the authors and do not necessarily reflect those of the Bank for International Settlements.
Drivers of cross-border investment
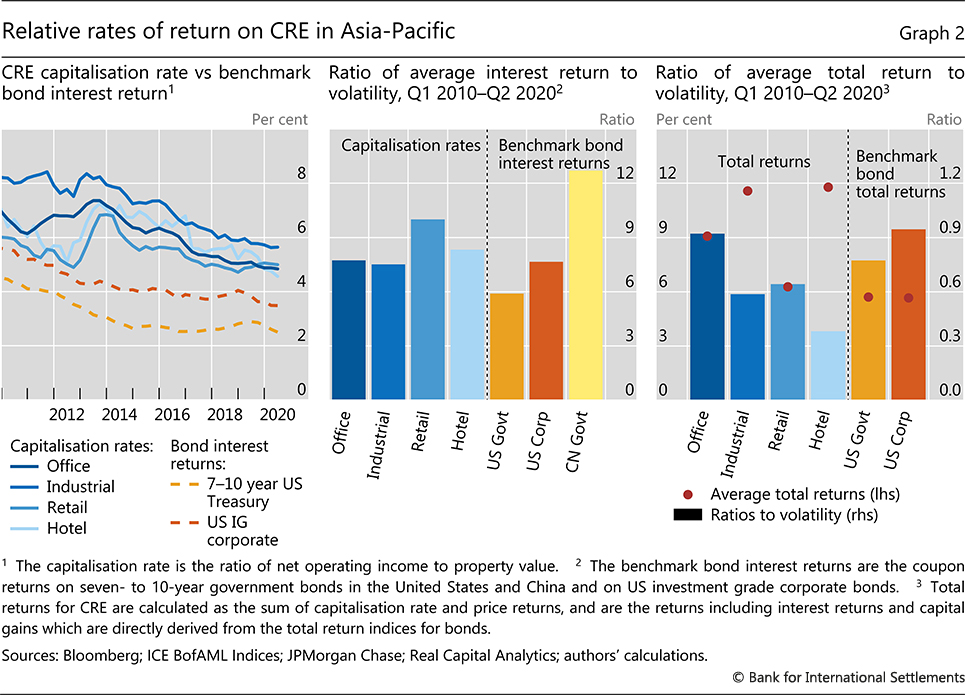
We now turn to a key driver of cross-border investments: the search for yield, ie investors' search for a relatively high and steady income stream, capital gains aside. Indeed, the average capitalisation rates of Asia-Pacific CRE investments (the ratio of net operating income to property value) exceed benchmark bond interest returns (the ratio of the coupon amount to bond value) by a significant margin (Graph 2, left-hand panel). This excess interest return on CRE investments may include any liquidity premium that investors demand for holding illiquid CRE assets.14 In turn, the low liquidity of CRE assets may be reflected in more volatile CRE price movements. When we adjust for historical volatility, however, we find that interest returns on CRE investments are greater than those on US government bonds, similar to those on US investment grade corporate bonds and smaller than those on Chinese government bonds (Graph 2, centre panel).
Investors who hold CRE claims on financial intermediaries, such as REITs or investment funds, may be interested in total returns, comprising both interest returns and capital gains (or price returns). Indeed, total returns on Asia-Pacific CRE have been higher on average than those on benchmark bonds over the past 10 years (Graph 2, right-hand panel, red dots). However, this has not been the case on a risk-adjusted basis (bars in the right-hand panel).
A regression analysis also suggests that search for yield represents an important driver of financial investors' behaviour. We obtain the results by regressing the share of cross-border investment on a set of standard pull and push factors, including the differential between CRE capitalisation rates and 10-year US Treasury interest returns. Each observation is a jurisdiction-quarter pair. We find that a wider differential between the average capitalisation rate of Asia-Pacific CRE and the 10-year US Treasury interest return is associated with a higher share of cross-border investment in the following quarter (Table 3, column (1)). This result is driven by global investors from outside the region, as revealed by columns (2) and (3). The underlying reason is that financial intermediaries predominate in global cross-border CRE deals, focusing almost exclusively on portfolio deals.
The results also point to the financial channel of exchange rates, whereby a general strengthening of the US dollar is associated with a diminished risk capacity on the part of global investors (see eg Bruno and Shin (2015), Avdjiev et al (2019) and Hofmann et al (2020)). Consistent with this channel, the broad dollar index enters with a highly significant negative coefficient, even after the bilateral dollar exchange rate is controlled for. This suggests that cross-border investment in CRE declines because a stronger US dollar reduces the supply of portfolio capital, in addition to any currency rebalancing motive. That the coefficient on the broad US dollar index returns is more negative in column (2) than in column (3) suggests that intraregional flows are affected more by dollar appreciation than global flows. In other words, Asia-Pacific investors seem more sensitive to fluctuations in dollar funding conditions than are US or European investors.15
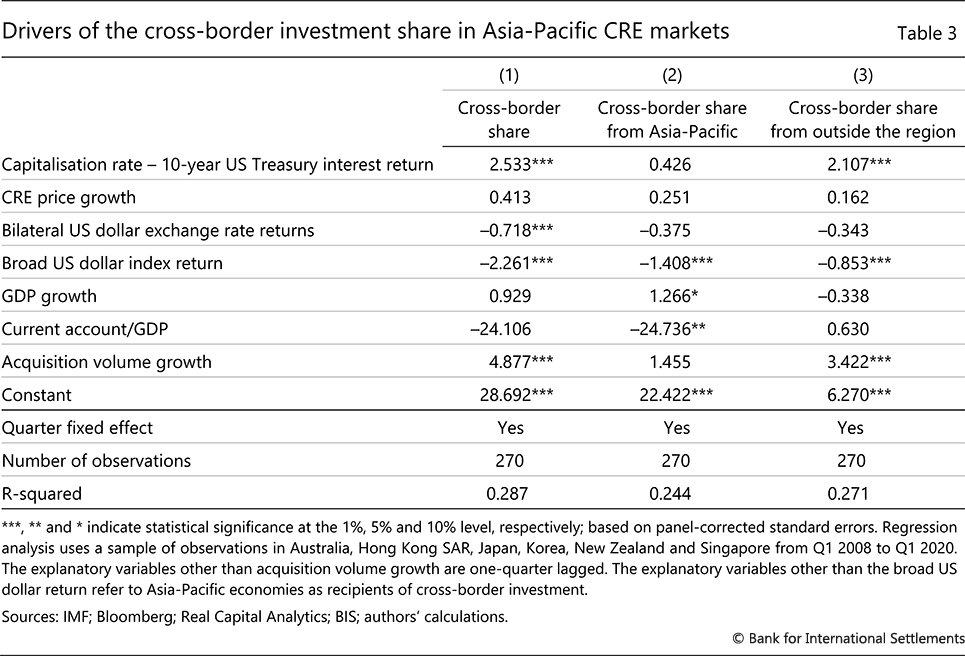
Finally, regression results indicate that foreign investors play a larger role in higher acquisition volumes. This is reflected in the positive coefficient on the total acquisition volume growth (columns (1) and (3)). This result suggests that cross-border investors constitute the marginal investor base in a similar manner to the long-standing results for the role of cross-border banking (Borio et al (2011)).
Developments during Covid-19
The Covid-19 shock exposed many of the CRE sector's vulnerabilities. Its impact on CRE investment has been more immediate than that of previous downturns due to the unprecedented scale of the economic contraction. CRE purchases by financial investors also slowed due to increased uncertainty, as the lack of transactions made it difficult to ascertain true property values. Therefore, financial intermediaries investing cross-border on behalf of indirect financial investors disproportionately reduced their activity in regional CRE markets during the pandemic. This undercut the price of market-traded liquid claims on CRE properties, eg REIT shares, suggesting that investors saw a deterioration in the fundamental value of CRE property (BIS (2020)).
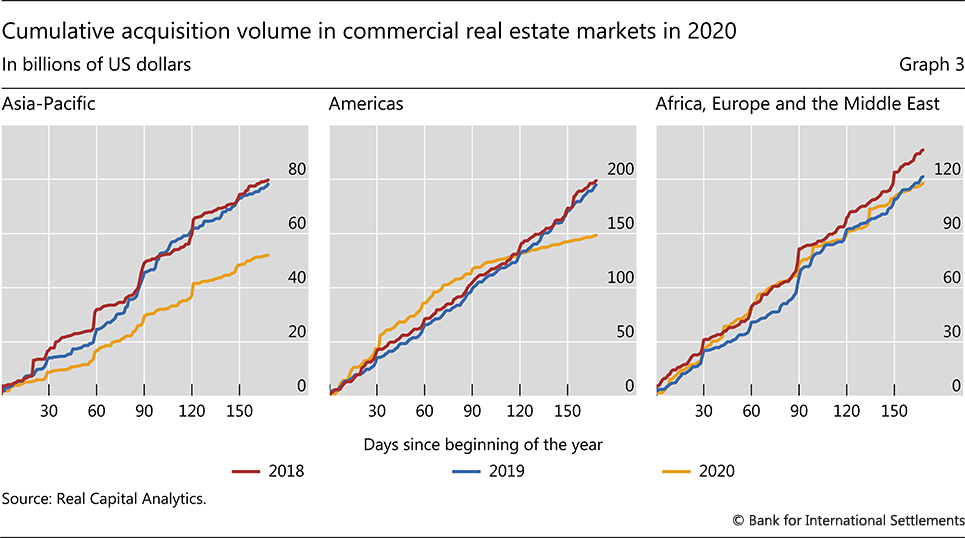
Asia-Pacific was the first region to experience the spread of Covid-19, and therefore felt its economic effects early in the year. The cumulative volume of Asia-Pacific CRE acquisitions over the first 170 days of 2020 was only around 65% of the corresponding volumes in either of the two previous years (Graph 3, left-hand panel). By contrast, the acquisition volume in the Americas was robust well into the first quarter of 2020, but has slowed rapidly thereafter, to reach a level about 25% lower over 170 days into 2020 than a year ago, as the pandemic spread to the continent (centre panel). Acquisition volumes in countries in Africa, Europe and the Middle East have slowed only modestly since March 2020, thanks to some large deals (right-hand panel).
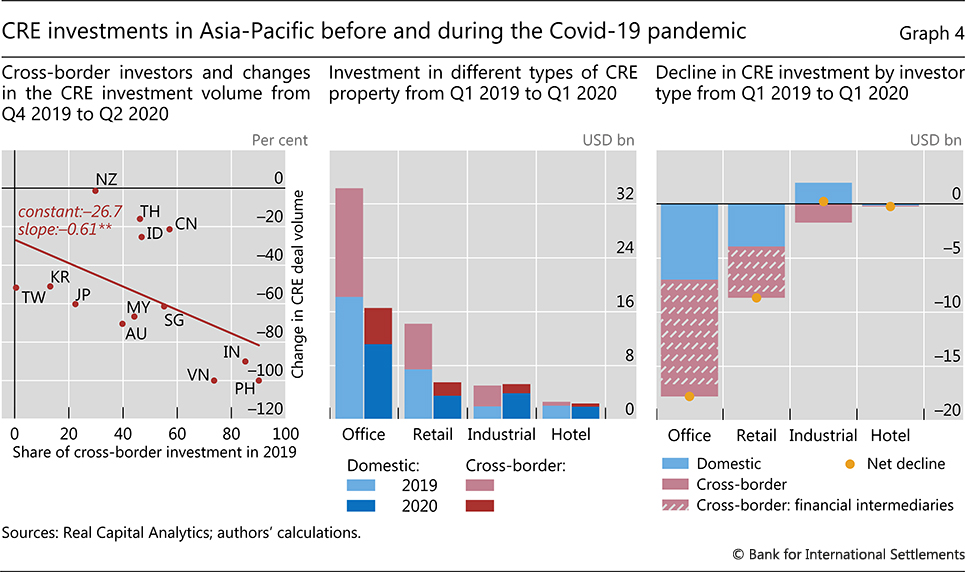
Cross-border investors may be particularly flighty when they face a large global shock, such as the Covid-19 pandemic. It is then that their impact as marginal investors makes itself felt. In fact, the higher the share of cross-border investment at end-2019, the greater the contraction in total CRE acquisition volumes over the first half of 2020 (Graph 4, left-hand panel).
Cross-border financial intermediaries posted the largest decline in activity as the Covid-19 crisis reverberated through the region (Table 2, third and fourth columns, upper half). Their share in overall acquisitions declined from 74% to 61% between the first half of 2019 and the first half of 2020. The corresponding dollar amounts were $29 billion and $18 billion, respectively. By contrast, the share of direct financial investors in cross-border acquisitions increased from 2% to 20%, suggesting that they may be playing a stabilising role during market downturns. In terms of dollar amounts, their acquisitions increased from $0.6 billion in the first half of 2019 to $3 billion in the first half of 2020.
There are also notable differences in the behaviour of global cross-border financial investors, as compared with regional ones. This probably reflects the much larger role of financial intermediaries in the global category, compared with regional investors, who often buy the property directly (Table 2, fifth to eighth columns, upper half). As such, the pullback by global financial intermediaries outpaced the drop in the total volume of Asia-Pacific CRE acquisitions in the first half of 2020 from a year earlier. By contrast, regional investors reduced their investment at a slower pace, even exerting a stabilising influence by increasing their share of CRE portfolio acquisitions.
In terms of property types, office and retail CRE acquisition volumes fell sharply during the pandemic (Graph 4, centre panel). This was driven disproportionately by the pullback of cross-border financial intermediaries that invest in a portfolio of properties on behalf of indirect financial investors (Graph 4, right-hand panel).
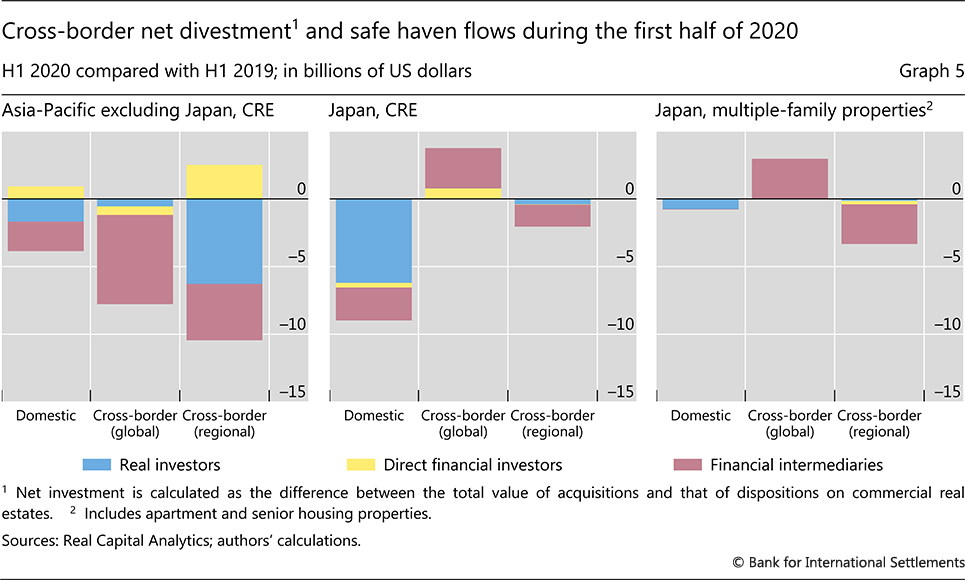
A look at net flows (ie acquisitions minus dispositions) also shows that the search for yield by global financial investors can turn into a run for safety during a crisis. Graph 5 shows the change in net CRE investment by investor type in the first half of 2020 compared with 2019. Intermediaries, particularly for global investors, accounted for most of the decline (Graph 5, left-hand panel). Japan is an exception, as it saw acquisitions by global investors (Graph 5, centre panel), especially from the United States, who had pulled back from the rest of the region. Such a rotation recalls Japan's long-standing role as a safe haven for fixed income investors. In addition, global financial intermediaries increased their net purchases of multi-family dwellings in Japan, which are perceived as safer than CRE (Graph 5, right-hand panel).
Conclusions
This article focuses on vulnerabilities arising from cross-border investment in the Asia-Pacific CRE market. Prudential policy is the ideal tool for addressing such vulnerabilities. In particular, because cross-border CRE investment affects domestic CRE prices, policymakers may need to consider how to dampen the market volatility it generates.16
Some jurisdictions have placed direct limits on cross-border investments. While these restrictions do not necessarily target financial stability, they may still influence it. For example, Australia imposes quantitative and price restrictions on foreign owners, while other jurisdictions such as China and New Zealand impose restrictions on the types of commercial property that foreigners can buy and own (REIBC (2018)).
The CRE industry has also benefited from policy actions after the Covid-19 outbreak. For instance, in April 2020, the Monetary Authority of Singapore (MAS) announced measures to support individuals facing financial difficulties due to the pandemic, including a deferral of repayment for commercial and industrial property loans. MAS subsequently relaxed its rules on REIT dividends and debt-to-property value ratios. China, in turn, implemented a swift infrastructure investment drive in response to the Covid-19 outbreak, which seems to have helped property developers recover over the past few months. In August 2020, the Hong Kong Monetary Authority (HKMA) relaxed commercial property mortgage rules to boost the CRE market. In particular, the HKMA raised the cap on the loan-to-value ratio on mortgages for non-residential properties from 40% to 50% to make it easier for the CRE sector to obtain bank funding.
Despite rapid policy actions in several major jurisdictions, the Asia-Pacific CRE sector continues to face challenges from the pandemic. Over the medium term, if the pandemic lasts longer than expected and governments end their support for renters and landlords before the economy returns to strong growth, banks and other financial institutions may be hit by CRE loan delinquencies and a slowdown in activity. In addition, loans backed by CRE properties, direct land and construction loans and those in commercial mortgage-backed security pools will add to local banks' losses during market stresses.17 This puts a premium on advanced planning for the phasing out of support measures in the CRE sector.
Over the longer term, investors may face further difficulties if the pandemic fundamentally changes the demand for CRE (eg by sapping demand for retail, office and hotel space). In particular, this could put pressure on intermediaries catering to indirect financial investors and cross-border CRE investors who are exposed to additional funding and market liquidity risks.
References
Acharya, V and L Pedersen (2005): "Asset pricing with liquidity risk", Journal of Financial Economics, vol 77, no 2, pp 375-410.
Amihud, Y and H Mendelson (1986): "Liquidity and stock returns", Financial Analysts Journal, vol 42, no 3, pp 43-8.
Avdjiev, S, C Koch, H S Shin and W Du (2019): "The dollar, bank leverage and the deviation from covered interest parity", American Economic Review: Insights, vol 1, no 2, September, pp 193-208.
Bank for International Settlements (2020): Annual Economic Report, "Real estate markets in the wake of the Covid-19 shock", Box I.C, pp 19-20.
Berry, J (2020): "Covid-19 implications for commercial real estate: preparing for the next normal", Deloitte Insights, May.
Borio, C, R McCauley and P McGuire (2011): "Global credit and domestic credit booms", BIS Quarterly Review, September, pp 43-57.
Bruno, V and H S Shin (2015): "Cross-border banking and global liquidity", Review of Economic Studies, vol 82, no 2, pp 535-64.
Chui, M, A Illes and C Upper (2018) "Mortgages, developers and property prices", BIS Quarterly Review, March, pp 97-111.
Committee on the Global Financial System (2020): "Property price dynamics: domestic and international drivers", CGFS Papers, no 64.
Hau, H and H Rey (2006): "Exchange rates, equity prices and capital flows", Review of Financial Studies, vol 19, no 1, pp 273-317.
Hofmann, B, I Shim and H S Shin (2020): "Bond risk premia and the exchange rate", BIS Working Papers, no 775.
--- (2020): "Emerging market economy exchange rates and local currency bond markets amid the Covid-19 pandemic", BIS Bulletin, no 5, April.
International Monetary Fund (2019): Singapore financial sector assessment programme technical note - macroprudential policy.
Monetary Authority of Singapore (2016): "Commercial real estate investment flows in Asia: trends and drivers", Financial Stability Review, November.
Ng, D, I Shim and J Vidal Pastor (2019): "The role of different institutional investors in Asia-Pacific bond markets during the taper tantrum", BIS Papers, no 102, pp 113-42.
Portes, R and H Rey (2005): "The determinants of cross-border equity flows", Journal of International Economics, vol 65, no 2, March, pp 269-96.
Real Estate Institute of British Columbia (2018): "Non-resident ownership of commercial and industrial property: a review of policies from around the world", January.
Remolona, E and I Shim (2015): "The rise of regional banking in Asia and the Pacific", BIS Quarterly Review, September, pp 119-34.
Reserve Bank of Australia (2010); "Commercial property and financial stability − an international perspective", Bulletin, June.
Savills (2016): "World real estate accounts for 60% of all mainstream assets", 3 February, https://en.savills.pl/insight-and-opinion/savills-news/142353-1/world-real-estate-accounts-for-60--of-all-mainstream-assets-title.
Shek, J, I Shim and H S Shin (2015): "Investor redemptions and fund manager sales of emerging market bonds: how are they related?", BIS Working Papers, no 509.
Shim, I (2012): Discussant remarks on Andrew Felton and Joseph B Nichols' paper "Commercial real estate loan performance at failed US banks", BIS Papers, no 64.
1 The views expressed in this article are those of the authors and not necessarily those of the Bank for International Settlements. We thank Claudio Borio, Michael Chui, Stijn Claessens, Benoît Mojon, Andreas Schrimpf, Hyun Song Shin, Nikola Tarashev, Christian Upper and Philip Wooldridge for their helpful comments.
2 Global assets are here defined as including equity, debt securities and gold. Savills (2016) considers as real estate the entire universe of developed property including residential real estate, high-quality or global commercial real estate and agricultural and forestry land in 2015.
3 CRE markets are more volatile than their RRE counterparts, because CRE properties are typically acquired for investment purposes rather than for direct use or operation (CGFS (2020)). Furthermore, long and lumpy construction lags can result in low supply elasticity and large and prolonged mismatches in demand and supply, which could in turn lead to sharp price corrections and depressed markets long after an economic downturn (Monetary Authority of Singapore (2016)). As such, the CRE market typically lags the macroeconomic cycle by several months, according to Berry (2020).
4 To be consistent with existing studies of cross-border CRE investment in the region (eg MAS (2016)), we do not include apartments, senior housing and development sites/land in the measure of CRE because these types of property are typically not acquired for financial investment purposes.
5 The RCA data for Asia and the Pacific capture transactions in all CRE projects and part of RRE projects including multi-family dwellings and condominium projects with a deal size of greater than USD 5 million for Australia, Hong Kong SAR, Japan, Korea and Singapore and those with a deal size of greater than USD 10 million for Indonesia, the Philippines and Thailand.
6 Alternatively, funds can suspend redemptions, thereby locking in investors' money. For example, in 2015, Aviva Investors suspended redemptions from its GBP 159 million Asia-Pacific property fund, which invested mainly in prime CRE properties in Sydney and Tokyo. In 2016, seven major UK property funds were forced to suspend redemptions after experiencing more than GBP 1.5 billion in withdrawals around the time of the Brexit referendum. During the Covid-19 crisis, nine UK property funds and their feeder funds suspended trading within just a two-day period on 17-18 March 2020.
7 If a pension fund invests in REITs, then that part of indirect financial investment into CRE is considered to be more subject to funding risk than if the pension fund had invested in the properties themselves.
8 This is one reason that REITs have back-up credit lines from banks. For example, in response to the Covid-19 pandemic, US REITs drew down $37 billion from their credit facilities in Q1 2020 according to S&P Global Market Intelligence.
9 Professionally managed real estate as defined by MSCI includes CRE and RRE such as condominiums which meet the following criteria: (i) held as investments for the purposes of delivering a mix of income and capital returns; (ii) professionally managed for these purposes, either by the beneficial owners or by third-party management entities; (iii) held by insurance companies, pension funds, sovereign wealth funds, unlisted funds (closed or open-ended), traditional estates and charities, listed funds, and large private landlords whose asset size is greater than $100 million; and (iv) including leased office, retail, industrial, residential and investment property under development/construction.
10 For example, the share of overseas buyers in Hong Kong SAR ranged below 2.5% over the past seven years, and barely exceeded 10% during its peak. Similarly, the share of overseas buyers in Singapore's RRE ranged between 5% and 10% during most of the past decade (see CGFS (2020) for details).
11 The estimates are based on the $350 billion in cross-border real estate investment flows out of Hong Kong SAR by the top 20 largest investors in the five years to end-2019
12 For example, purchases by pension funds and insurance companies accounted for just 6.5% of cross-border CRE investment by indirect financial investors in 2019, while non-bank financial intermediaries engaged in some form of liquidity or maturity transformation accounted for a 90% share.
13 Blackstone (US-headquartered equity fund; $25.6 billion); GIC (Singapore-headquartered sovereign wealth fund, $24.9 billion); Gaw Capital (Hong Kong SAR-headquartered equity fund, $17.9 billion); Morgan Stanley (US-headquartered bank, $17.4 billion); Hulic (Japan-headquartered real estate operating company, $16.7 billion); and Charter Hall REIT (Australia-headquartered public REIT, $16.0 billion).
14 There is a long-standing academic literature on the relationship between return and liquidity in equity markets, most notably on the role of the illiquidity premium and stock returns (see a seminal paper by Amihud and Mendelson (1986)) and on the role of liquidity risk in the optimal portfolio choice for investors (see Acharya and Pedersen (2005)).
15 There is also some evidence (albeit weak) that bilateral exchange rates affect the share of cross-border investors in CRE acquisitions. A negative coefficient on lagged bilateral US dollar exchange rate returns suggests that a local currency appreciation against the US dollar increases the cross-border share of CRE investment. This could be attributed to portfolio rebalancing effects that aim to keep constant portfolio shares in currencies. Portfolio rebalancing by unhedged global equity portfolio investors can also explain the negative relationship between equity market excess returns in local currency and FX returns (Hau and Rey (2006)).
16 The financial stability monitoring of CRE markets is complicated by the fact that there are no officially sanctioned, internationally comparable property price statistics for CRE, as there are for RRE. As a result, central banks typically rely on data from private providers.
17 CRE loans have historically posed a greater risk to bank balance sheets than have housing loans (RBA (2010)). Not only are CRE loans concentrated in riskier business activities, such as construction and development, but they also feature a high correlation between the property value as collateral and the rental income flows supporting loan repayments (Shim (2012)). A related aspect is the extent to which foreign investors rely on leverage from local sources. For example, local banks are allowed to lend to overseas buyers in Australia, Hong Kong SAR and Singapore.