Mortgages, developers and property prices
This special feature studies the risks posed by the rapid rise in property developer debt in several Asian economies in recent years. Gradually, the firms involved are shifting away from traditional bank loans and choosing to issue debt securities, often in foreign currency. So far indebtedness has tended to be low for most firms, but weak profitability and declining interest coverage ratios give cause for concern. The firms are thus vulnerable to shocks, such as increases in interest rates, falling property prices or local currency depreciations. Even if outright defaults can be avoided, the weakening fundamentals of the sector could spill over to other parts of the economy through lower house prices.1
JEL classification: E40, F20, F30, F34, F41, F65, L85.
On 5 February 1997, Somprasong Land, a Thai property developer, failed to meet a scheduled interest payment. Many consider this the first event of the Asian financial crisis, which would shake one emerging economy after another over the following two years (IMF (1998)). As in many advanced and emerging market economy crises before and since, excessive leverage linked to property markets was a key source of weakness that would end up imposing significant costs on the financial system, the real economy and the population at large.
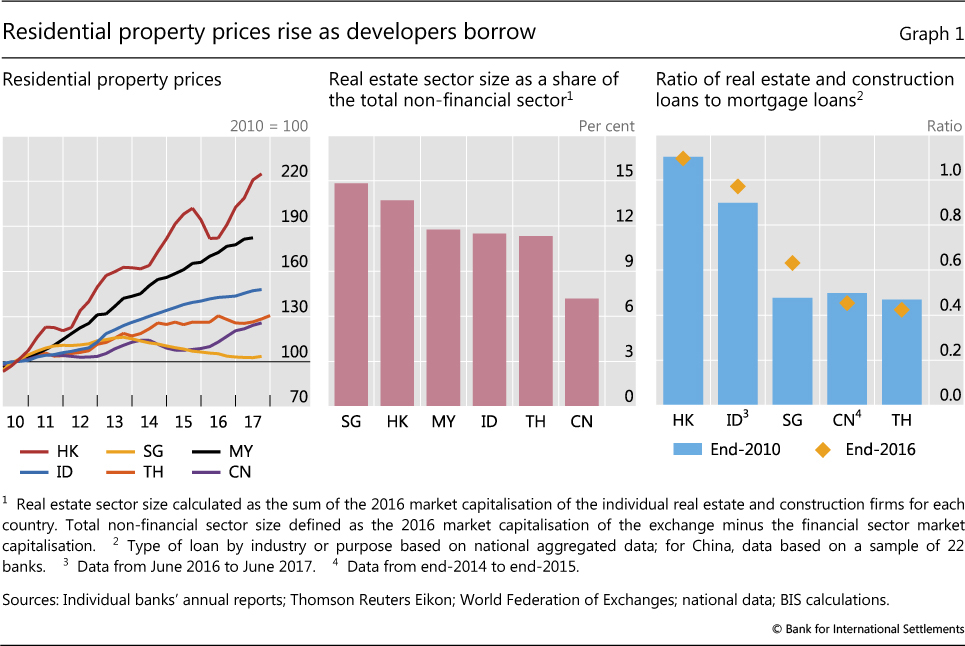
Twenty years on, much has changed in emerging Asia. Policy frameworks have been revised in light of the crisis, exchange rates are (more) flexible and foreign exchange reserves ample. Financial regulation has been strengthened. Yet in recent years, despite a tightening of macroprudential measures and a slowdown in credit growth, property prices have continued to go up in several jurisdictions (Graph 1, left-hand panel).
In some economies, rapid property price growth has coincided with a pickup in property developers' borrowing through loans and securities. As in the mid-1990s, a sizeable part of this debt is in foreign currencies. However, while most of the foreign currency debt was in the form of bank loans in the earlier episode, international bond issuance, especially by subsidiaries domiciled in a different economy from the one where the firm is headquartered, has dominated in recent years. In both episodes, a large part of the debt has been either unhedged or only partly hedged against exchange rate movements.
Despite its importance during the Asian crisis, the Great Financial Crisis (GFC) of 2007-09 and the subsequent European debt crisis, developer debt is often neglected in the analysis of financial stability risks.2 This limited attention is surprising, for two reasons.
First, developer debt is large. Even though real estate firms account for no more than 15% of the total market capitalisation of non-financial companies in most Asian economies (Graph 1, centre panel), their borrowing from banks is significant. For example, in Hong Kong SAR and Indonesia, loans to property developers and construction companies are as large as the aggregate mortgage debt of households (Graph 1, right-hand panel). In the past, high and rising developer debt has often signalled an unsustainable property boom and sometimes been accompanied by a bout of banking stress. For instance, in Spain developer debt rose sixfold between 2000 and the beginning of the GFC in 2007, peaking at 43% of GDP in early 2009. By contrast, mortgage lending to Spanish households rose by "only" 250% over the same period, peaking at approximately 62% of GDP (Bank of Spain (2017)). Meanwhile in Ireland, developer lending exceeded mortgages (Whelan (2014)).
Second, default rates are very sensitive to house price developments, potentially amplifying procyclicality in the financial system.3 Credit-fuelled increases in property prices drive up the value of developers' inventories and provide room for even more debt.4 But when property prices drop, developers have to revalue their assets. This drives up leverage, which not only limits their ability to take on new loans for new investments, but could also lead to a violation of debt covenants, allowing lenders to call the debt. Such forced deleveraging could oblige developers to sell off assets and result in a downward spiral of deleveraging and falling asset prices (Bernanke et al (1999)) - just when reduced credit quality and forced deleveraging are likely to be plaguing other parts of the system. In the case of Spain, almost 40% of all loans to the construction and real estate sectors became non-performing during the GFC, compared with approximately 6% of mortgages (IMF (2017)). At the height of the crisis, 700,000 to 1.1 million finished properties remained unsold (Maza and Peñalosa (2010)), which put significant pressure on property prices and housing-related employment.
In this special feature, we analyse the debt issued by Asian property developers in more detail. We find that large developers have increased their leverage over the past few years, with bond issuance being the main driver of rising debt. New borrowing in the form of medium- or long-term bonds should reduce rollover risk, but if a large proportion is denominated in foreign currencies, then issuers could be facing increased risk of currency mismatches, unless the proceeds are used to acquire corresponding foreign currency assets or the debts are adequately hedged financially. In addition, the profitability of developers has declined in recent years, with some firms reporting returns on assets that are either outright negative or fall short of their debt costs. Worsening credit quality may also make it harder to roll over the debt.
In the next section, we present data on the debt of property developers in six Asian economies. We then focus in on two factors that could result in both financial stability and macroeconomic risks: the borrowers' leverage and profitability, and currency mismatches.
Developer debt in Asia
Since comprehensive data on property developer debt in Asia are not easily available, we base our analysis of developer debt on a sample constructed from firm-level information that combines information from Capital IQ and Thomson Reuters Eikon (see Appendix). We define property developers as listed firms belonging to the real estate or construction and engineering sectors. We aggregate the firm-level data to analyse the sector-wide balance sheets in China, Hong Kong, Indonesia, Malaysia, Singapore and Thailand from 2006 to 2016. We also compile detailed debt issuance data to examine the risk of currency mismatch. To focus on the ultimate country risk, regardless of where that debt is being issued, we consolidate as far as possible and classify companies by the country in which the parent is incorporated. This means, for example, that a company listed in Hong Kong but headquartered in China is counted as a Chinese company. Although our sample may not cover all developers in each economy, it includes the top players and should give a good overview of the sector.
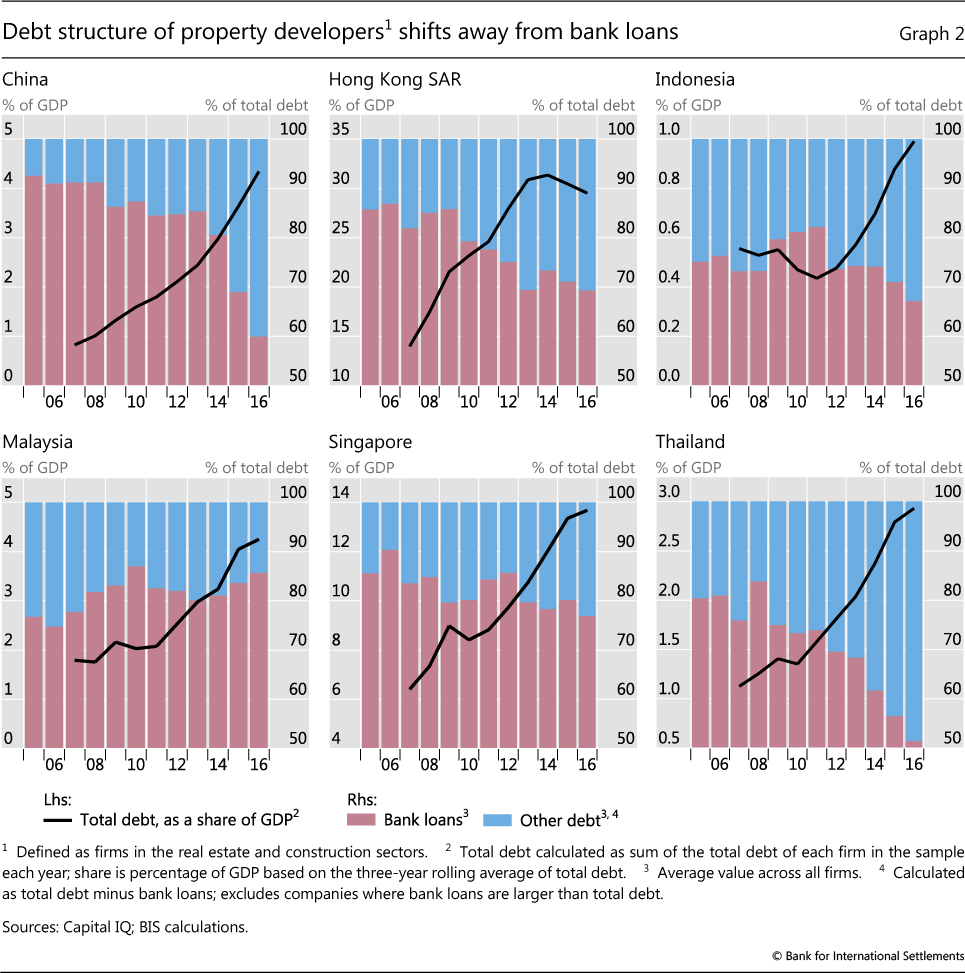
Debt of the property developers in our sample has increased significantly since the late 2000s (Graph 2). In all six economies, developer debt has grown strongly over the past decade. Only in Hong Kong, where developer debt peaked as a share of GDP in 2014, did this growth slow in the last few years.
The weight of the large developers in the economy where they are incorporated varies greatly across jurisdictions. In our data, the ratio of their debt to GDP ranges from 1% in Indonesia to around 30% in Hong Kong. But since our data set is limited, the true figure for all developers is likely to be much higher. For example, national data indicate that in Hong Kong bank lending to the developer sector reached approximately 50% of GDP at end-2016, about twice the bank debt of the firms in our sample. In Singapore, bank debt of resident property firms is 29% of GDP, compared with just under 15% in our sample; in Indonesia, 2.7% versus 1.0%; and in Thailand, 5.6% versus 3%. In Malaysia, lending to construction firms (real estate activities are bundled together with lending to households) stood at 3.8% at end-2016, about the same as our figures.
The share of debt from sources other than banks5 (blue bars in Graph 2), which includes bonds, increased considerably in recent years in China, Hong Kong and Thailand. In China and Hong Kong, the other debt category continued to grow rapidly well after bank lending had slowed. Both economies introduced a series of macroprudential measures to slow bank lending to real estate activities but were much less effective in curtailing bond market borrowing (HKMA (2017)).
Risks and vulnerabilities
Bond finance by property developers generates less rollover risk than bank loans because of the bonds' longer maturity. However, declining profitability (in some cases masked by rising leverage) and currency mismatches could make developers fragile. And even if the immediate financial stability risks are manageable, problems in this sector could lead to lower house prices, forcing developers to lay off staff and curtail investment. This could have a sizeable impact on economic activity. For example, investment in residential properties in the United States peaked at 6.6% of GDP in 2005, only to fall to just 2.5% in 2010.
Profitability and leverage
The financial health of property developers varies greatly across jurisdictions as well as across firms within a jurisdiction. That said, a few developments stand out.
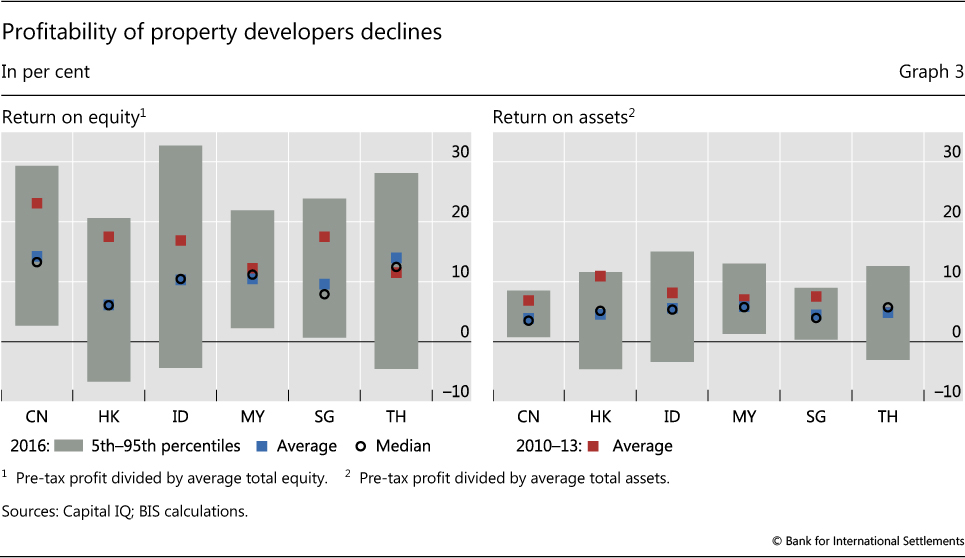
First, property developers in all economies except Thailand have become less profitable in recent years. In 2016, returns on the equity of the median firm ranged from just over 6% in Hong Kong to almost 15% in China (Graph 3, left-hand panel). And the median returns were more than 5 percentage points lower than the averages between 2010 and 2013 in most economies except Malaysia and Thailand, which were broadly unchanged.
Second, returns on assets of the median firms also fell in all six economies except Thailand. In 2016, the median developers earned 4-6% on their assets. With corporate bond yields fluctuating around 4% in recent years, it seems that the median firms are just about to earning their cost of debt.
Yet these averages hide substantial variation across firms. In particular, there is a large "tail" of firms that do not make any profits at all. In Hong Kong and Indonesia, around 10% of firms reported negative returns on assets in 2016. And in Thailand, this share was 15%.
Third, in most economies the increase in property developers' lending coincided with an increase in their leverage. Debt-to-assets ratios of the median firm increased between 2010 and 2016 in all economies except Hong Kong (Table 1). That said, debt ratios are still relatively low. Debt accounts for less than one third of the total assets of the median developer in all the economies studied except China, Singapore and Thailand, where the ratios are just below 40%. The relatively low leverage helps explain why developers have so far not had major difficulties in servicing their debt, despite low asset returns. Interest coverage ratios - defined as earnings before interest, taxes, depreciation and amortisation (EBITDA) divided by interest expense - have been gradually decreasing in all economies except Hong Kong and Malaysia, but tended to remain well above critical levels in 2016.
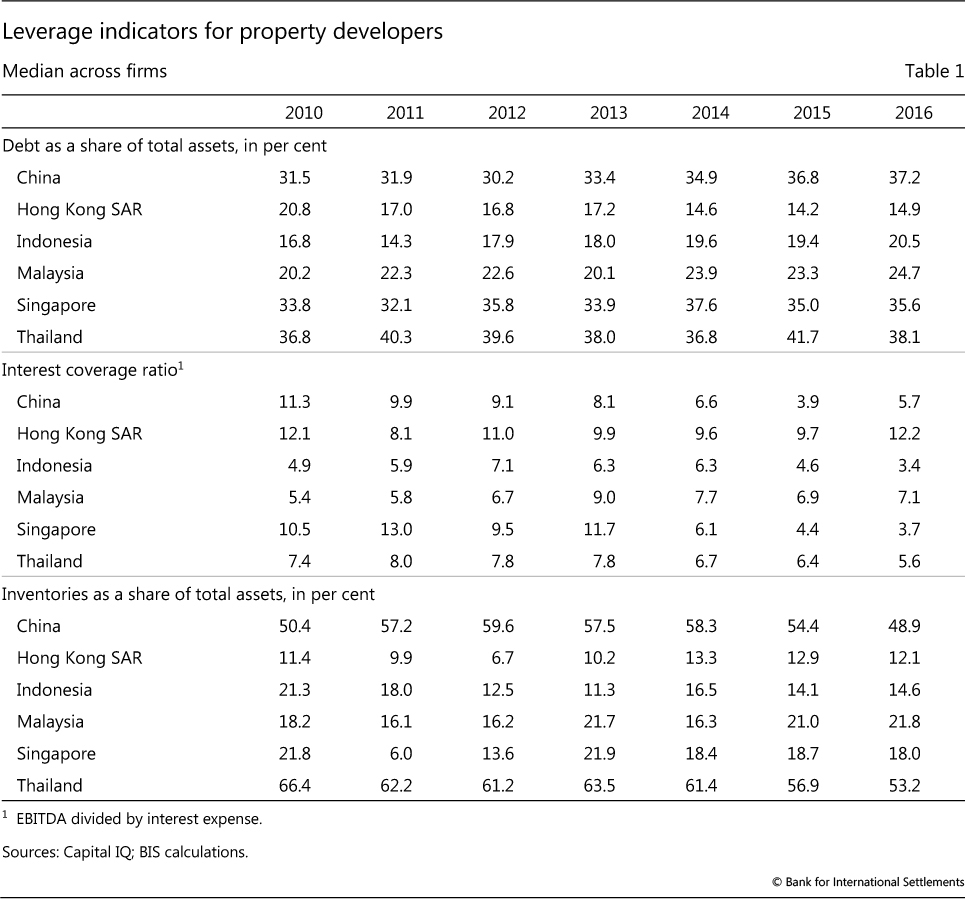
Low leverage and still comfortable interest coverage ratios could be taken as an indication that developers have significant buffers with which to withstand adverse shocks without having to default. But past episodes have shown that developers' financial health tends to be very sensitive to property prices, interest rates and, possibly, exchange rates. This effect can be quite immediate, as a drop in prices may force developers to revalue their inventories of unsold housing. Such inventories are quite large in the case of Chinese and Thai firms, with a median inventory of around 50% of assets at the end of 2016 (Table 1). Second, higher interest rates could result in higher debt service costs, especially for firms with variable rate or short-maturity debt. Hofmann and Peersman (2017) find that an increase in policy rates would have a significant and lasting effect on the effective lending rate, which in turn would increase the debt service ratio for the private non-financial sector. Finally, both the leverage and debt service costs of firms with currency mismatches are very sensitive to the exchange rate. Since property prices, interest rates and exchange rate movements are closely interlinked, all three effects could occur simultaneously, resulting in a severe deterioration in the financial health of developers.
Currency mismatches
In some countries, low profitability is accompanied by substantial currency mismatches. These arise if debt is denominated in foreign currency and used to finance local currency assets, unless the resulting mismatches are hedged with foreign currency assets or derivatives. Large currency mismatches in balance sheets can increase the effect on economic activity of exchange rate fluctuations through the risk-taking channel (Hofmann et al (2017)).
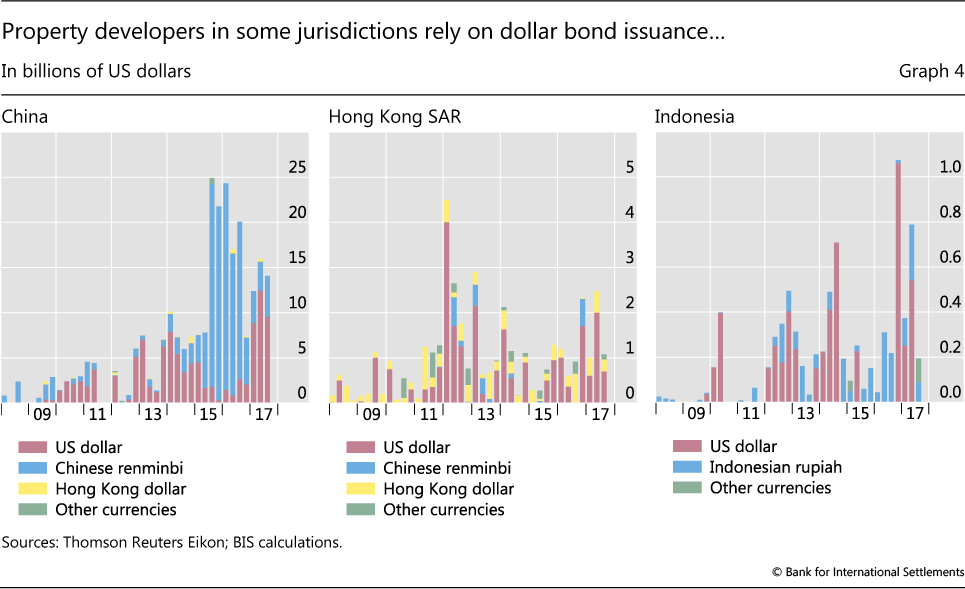
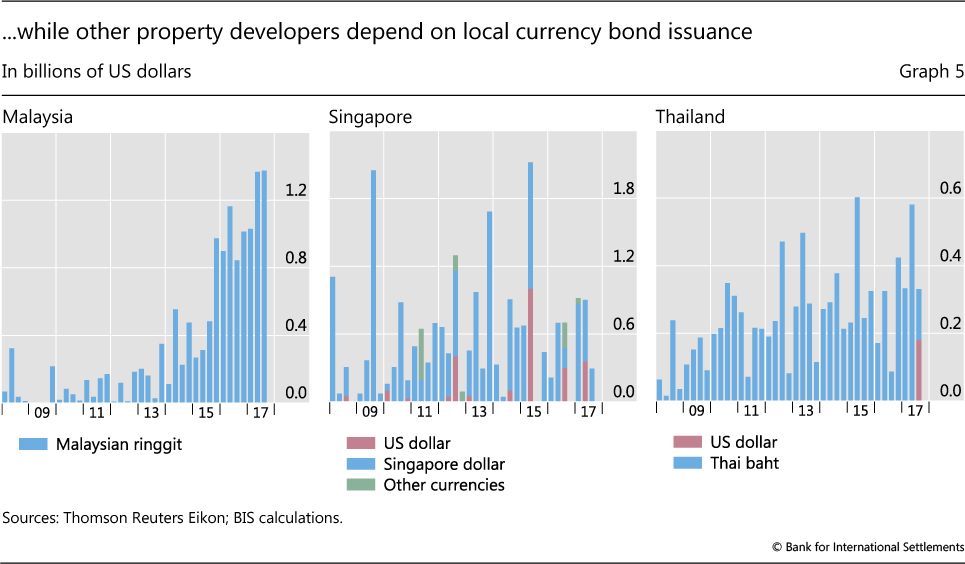
Dollar-denominated developer debt appears to be rising overall, although the trend varies across countries. While in Malaysia, Singapore and Thailand companies have mostly issued bonds in domestic currencies, those in China, Hong Kong and Indonesia have issued considerable amounts of US dollar-denominated bonds (Graphs 4 and 5). Foreign currency bond issuance often takes place in waves, with phases of positive market sentiment alternating with periods when investors are not so receptive. This is especially important for emerging market economies, which are subject to episodes such as the May-June 2013 "taper tantrum", when sentiment deteriorates rapidly, exchange rate volatility rises and market access falls. In addition, banks may have other debt, not least bank loans, denominated in foreign currency.
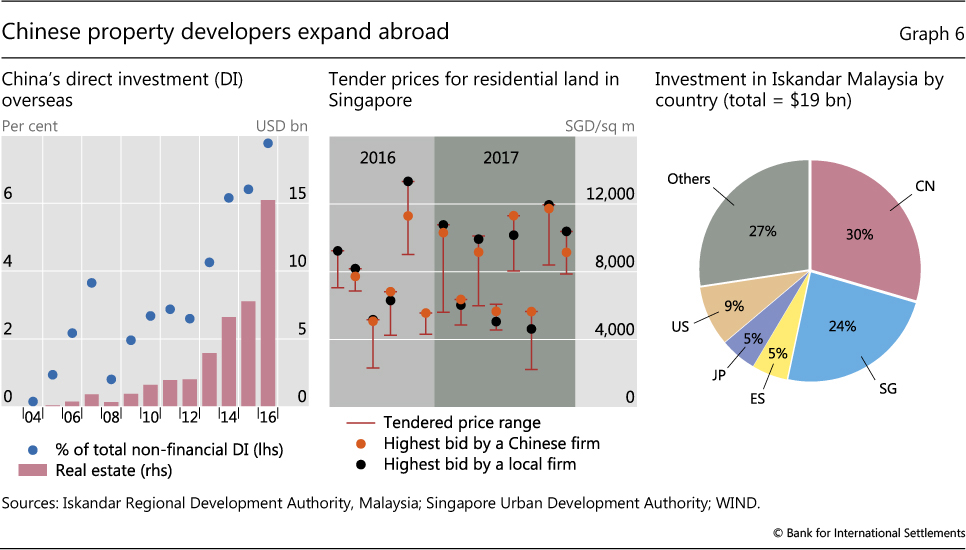
Some of the US dollar borrowing has funded activities in foreign currencies - for example, the strong expansion of Chinese developers outside China. Chinese residents' outstanding foreign direct investment in the real estate sector doubled in 2016 to $16 billion, accounting for around 8% of Chinese direct investment in all non-financial sectors (Graph 6, left-hand panel). Chinese property developers and their subsidiaries have been particularly active in other Asian economies. In Singapore, Chinese companies have bid aggressively in residential land auctions (Graph 6, centre panel). In Malaysia, they accounted for almost 30% of the funding of Iskandar Malaysia, a large real estate project in the region neighbouring Singapore (Graph 6, right-hand panel). When completed, the project was intended to establish around 336,000 new private residential units - more than the entire existing stock of private homes in Singapore. While these projects could bring in foreign currency revenues, these may not necessarily be in the same currencies as the debt that finances them.6
Property developers can also hedge their liabilities through derivatives contracts. While detailed information on corporate hedging activities is generally scarce, it appears that some firms do not hedge their foreign currency exposures at all. Only 12 of the 34 Hong Kong-listed Chinese real estate companies that had issued foreign currency-denominated bonds over the past few decades reported hedging their exposures. But financial hedges may not be complete. Financial statements of the few firms that provide detailed information on their hedging strategies show that, in order to economise on hedging costs, they often resort to contracts that limit the amount of protection in case of very large currency movements. Any losses that exceed this amount are incurred by the borrower. Moreover, firms tend to use strategies that require them to regularly roll over hedging contracts. If liquidity in the derivatives markets evaporates, seemingly hedged positions could thus suddenly become unhedged.
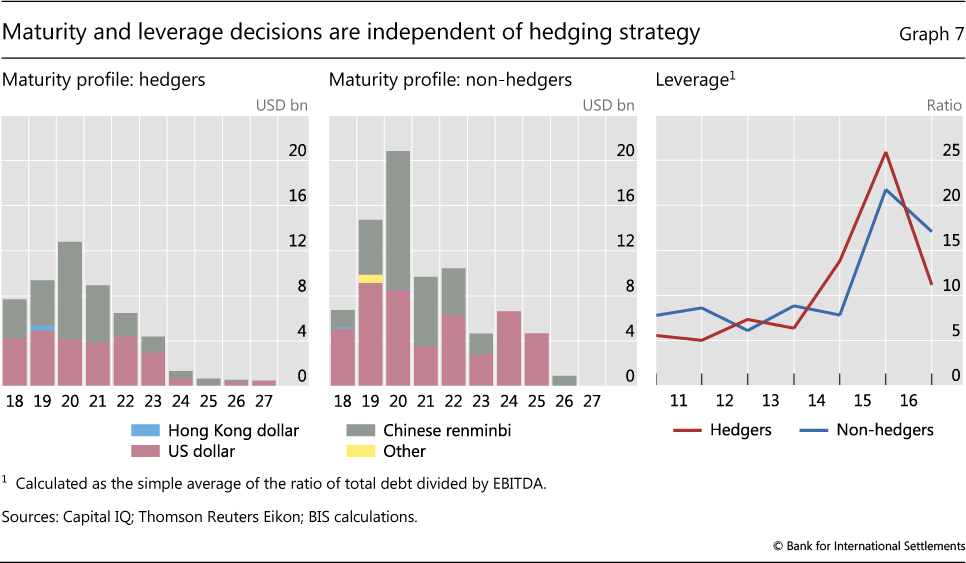
The rest reported that they had not hedged, or some said they would consider hedging if the need arose. Interestingly, the debt maturity profiles of "hedgers" and "non-hedgers" are roughly similar, as are their leverage patterns (Graph 7). Furthermore, non-hedgers commonly point to the high cost of buying derivatives on emerging market currencies as a reason for not hedging.
At least for Chinese firms, the risk of sharp losses from currency mismatches from their bond borrowings in case of a depreciation appears to have decreased in recent years. This is because of a shift towards renminbi-denominated bonds. Simulations based on bond issuance data for the 22 Chinese firms that do not hedge their FX exposures show that a 20% depreciation of the renminbi against all foreign currencies would raise scheduled repayments on their outstanding bonds by 13% in 2019 and less than that in the subsequent three years, when most of the debt on the firm's balance sheet today is coming due (Graph 8, left-hand panel).
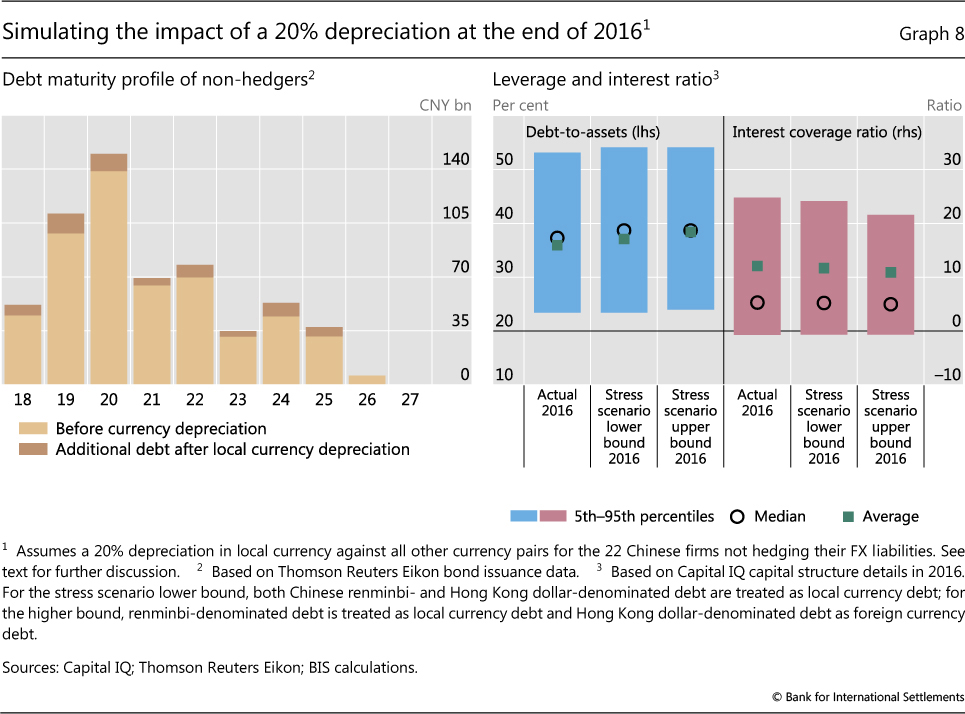
A more comprehensive stress test would require information on the currency composition of assets as well as liabilities. For example, if a Chinese developer issues a Hong Kong dollar bond and uses the proceeds to purchase a property in Hong Kong, there is no exchange rate risk. Since this information is not available, we consider two scenarios: a lower bound where all Hong Kong dollar borrowings carry no currency risk, and an upper bound where all Hong Kong dollar-denominated debts carry the same exchange rate risk as that in US dollars and other foreign currencies. Crucially, we assume that EBITDA and domestic assets and liabilities remain unchanged.
When the same exercise takes into consideration firm-level data on the total debt of the non-hedgers - where total debt includes bank loans, securities and other forms of debt - the results suggest that a 20% depreciation of the local currency would have only a minor impact on firms' fundamentals, irrespective of our assumptions as to what assets back Hong Kong dollar debt. Leverage as measured by the debt-to-assets ratio would remain almost unchanged, although the interest coverage ratio would drop even further (Graph 8, right-hand panel). While the mean and median of the distribution would remain fairly stable, a depreciation could have more important effects on the firms in both tails. In particular, more firms would see their interest coverage ratio drop below one, meaning that they would no longer earn enough to service their debt.
Unfortunately, missing data on the interest rates paid on the debt outstanding preclude us from doing a similar exercise for the impact of higher interest rates on developers' cash flows. The available information suggests that interest shocks would not affect firms immediately, since a large part of their debt pays a fixed rate. But maturities of bank loans are often fairly short, so higher market rates may affect developers' interest coverage ratios relatively quickly.
Conclusions
Large Asian property developers substantially increased their indebtedness during the property booms that followed the GFC. The near-term financial stability risks associated with this debt appear to be limited. While debt levels of property developers are quite high in some economies, approaching 30% of GDP at end-2016 in Hong Kong, 15% in Singapore and 5% in China, leverage looks modest and interest coverage ratios are above critical levels. At the same time, from a longer-term perspective, the sector's deteriorating fundamentals give reason for concern. Profitability has declined since the boom years at the beginning of the decade, and many firms' returns on assets are below their costs of debt. This also means that leverage has been rising and interest coverage ratios falling.
Such weakened fundamentals make developers more vulnerable to shocks - for instance, higher interest rates or lower property prices. Since most of the developers' debt is in the form of bank loans, which tend to pay floating rates, higher market rates could quickly push up debt costs. Their impact could be compounded by valuation losses if higher interest rates are accompanied by a drop in property prices, which would push up leverage. Exchange rate depreciation could add to the woes, given non-negligible currency mismatches. The experience of past crises has shown that higher interest rates, drops in property prices and exchange rate depreciation often occur concurrently, and that fundamentals can deteriorate quickly.
A deterioration of the developers' financial health can have significant economic repercussions. The financial accelerator works in both directions. While easy financing conditions in the aftermath of the GFC have arguably added fuel to the property booms in many economies, a tightening in the years ahead could force firms to sell off inventory, driving down prices. Firms may also be forced to lay off workers.
Moreover, falling returns on assets and declining interest coverage ratios could pose problems even in the absence of external shocks. At the very least, they could hinder developers' ability to grow further, which could in turn affect property prices and employment.
References
Bank of Spain (2017): Informe sobre la crisis financiera y bancaria en España, 2008-2014, May.
Bank of Thailand (2018): Monetary Policy Report, December 2017.
Bernanke, B, M Gertler and S Gilchrist (1999): "The financial accelerator in a quantitative business cycle framework", in J Taylor and M Woodford (eds), Handbook of macroeconomics, Amsterdam: North-Holland.
Chang, R and A Velasco (2000): "Financial fragility and the exchange rate regime", Journal of Economic Theory, vol 92, issue 1, May, pp 1-34.
Corsetti, G, P Pesenti and N Roubini (1999): "What caused the Asian currency and financial crisis?", Japan and the World Economy, vol 11, issue 3, September, pp 305-73.
Hofmann, B and B Peersman (2017): "Is there a debt service channel of monetary transmission?", BIS Quarterly Review, December, pp 23-37.
Hofmann, B, I Shim and H S Shin (2017): "Sovereign yields and the risk-taking channel of currency appreciation", BIS Working Papers, no 538, revised version, May.
Hong Kong Monetary Authority (2017): "Hong Kong's property market and macroprudential measures", BIS Papers, no 94, December, pp 141-52.
International Monetary Fund (1998): International capital markets: developments, prospects and key policy issues, September.
--- (2017): "Spain: selected issues", Country Report, no 17/24, January.
Maza, L and J Peñalosa (2010): "La situación actual del ajuste de la inversión residencial en España", Bank of Spain, Boletín Económico, December, pp 66-79.
Quigley, J (2001): "Real estate and the Asian crisis", Journal of Housing Economics, vol 10, pp 129-61.
Whelan, K (2014): "Ireland's economic crisis: the good, the bad and the ugly", Journal of Macroeconomics, vol 39, pp 424-40.
Appendix
Data sources and methodology
Data sources. Our analysis uses both aggregate bank lending and firm-level data. First, bank loans to the real estate sector (defined as those to property developers and construction firms) are compared with mortgage loans to gauge the relative importance of developers to households as borrowers. Second, we extract firm-level balance sheet and debt issuance data from S&P Capital IQ and Thomson Reuters Eikon, respectively. Security-by-security issuance data from Eikon allow us to build an aggregate debt profile by currency for each economy. Information about whether a company has hedged its foreign currency risk or not is extracted from the company's financial reports.
Sample selection. Our first-pass filter is to select listed companies that are constituents of property-related stock indices. Then we exclude all real estate investment trusts and those firms specialising in hotels/rentals, but add those "non-developer" companies that reported a significant proportion of total revenues (>50%) from their property development business. On this basis, our sample has 233 companies: 104 in China (69 listed in China + 34 listed in Hong Kong), 43 in Thailand, 34 in Hong Kong, 32 in Malaysia and 20 in Singapore.
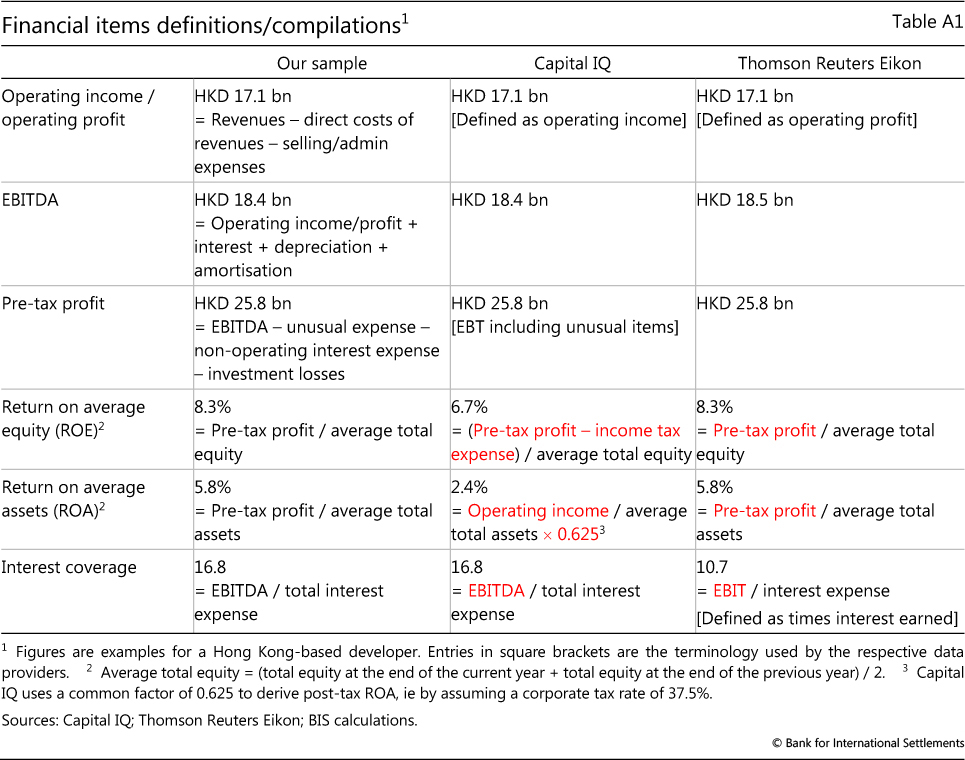
Data definition. Data providers employ slightly different definitions in reporting key financial ratios to allow for peer group or international comparison. Consequently, an apparently identical financial ratio of a company provided by different data providers could vary. Thus, we derive our own financial ratios from raw balance sheet data. Table A1 summarises our data for a Hong Kong-based developer and compares them with those reported by Capital IQ and Eikon.
1 The authors would like to thank Claudio Borio, Benjamin Cohen and Hyun Song Shin for helpful comments. The views expressed are those of the authors and do not necessarily reflect those of the BIS.
2 Research on the Asian crisis focuses mainly on issues such as currency speculation, "overlending" and contagion (eg Corsetti et al (1999), Chang and Velasco (2000)). Quigley (2001) is a notable exception and concludes that "part of the debacle [the Asian financial crisis] can be attributed to the combination of outmoded banking practices and an immature market for real property".
3 The Bank of Thailand (2018) warns that once many large-scale property projects are completed in four to five years' time, house prices could adjust sharply because of an oversupply of condominiums. Under such circumstances, the central bank argues, financial pressures on property developers could spread to the banking sector, as bank loans have been the main funding source of these firms.
4 When real estate is the dominant form of collateral, there is an added incentive for a company to build in an appreciating market in order to borrow funds to expand (Quigley (2001)).
5 Calculated by subtracting bank debt from total debt. Note that the exclusion of Chinese developers listed in Hong Kong from our sample could contribute to the difference.
6 There are exceptions: for example, an Indonesian firm issued a US dollar bond in Singapore to finance the purchase of a service apartment block targeting expatriate families. Since the rents were charged in US dollars, the prospective income streams provided some natural hedge to the investment, although mismatches remained as purchases were priced in Singapore dollars. However, it should also be noted that Singapore dollar- and Malaysian ringgit-denominated bond issuance by Chinese firms has been negligible over the past few years, despite Chinese firms' extensive activities in both countries.