Highlights of the BIS international statistics
The BIS, in cooperation with central banks and monetary authorities worldwide, compiles and disseminates data on activity in international financial markets. This chapter summarises the latest data for the international banking and over-the-counter (OTC) derivatives markets and for residential property prices, available up to end-2016.1
Takeaways
- International banking activity weakened in Q4 2016. Cross-border claims dropped by $281 billion in the quarter (view data), but were nevertheless up 1.9% in the year to end-December 2016. The decline was driven primarily by reduced lending to non-banks and unrelated banks, while intragroup positions picked up (view data).
- Trends diverged between advanced economies and emerging market economies (EMEs). The weakness in Q4 2016 mainly reflected a fall in cross-border lending to advanced economies, while aggregated claims on EMEs remained relatively stable.
- The latest $16 billion quarterly rise in claims on China supported a moderate recovery that had started in Q2 2016 but stalled in the third quarter.
- The on-balance sheet dollar funding of non-US banks grew in 2016, despite the loss of funding associated with the implementation of the money market fund reform in the United States.
- Against the backdrop of two of the three largest debt securities offerings in the history of EME sovereign debt, cross-border claims on oil-producing economies in the Middle East also expanded during 2016. Over the same period, deposits from those economies in the international banking system dropped, driven by a $43 billion decline in US dollar-denominated deposits.
The international banking market weakened in Q4 2016
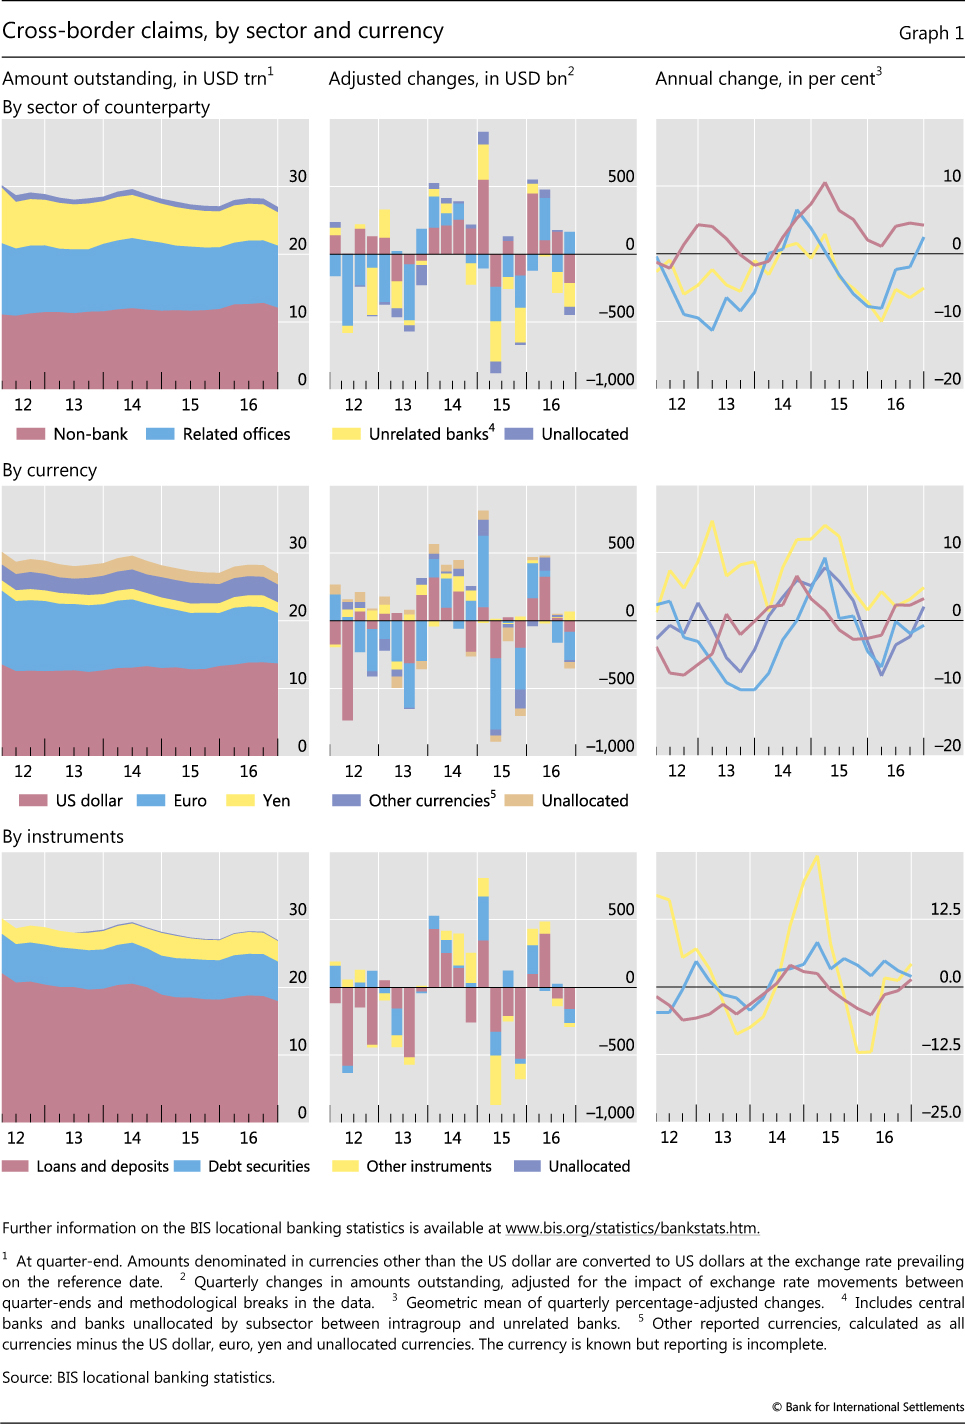
According to the BIS locational banking statistics (LBS), the cross-border claims of BIS reporting banks fell by $281 billion between end-September and end-December 2016, after adjustment for exchange rate movements and methodological breaks (Graph 1, top panels).2 This represented the second consecutive quarterly decline in 2016. Nevertheless, reflecting strong growth in the first half of 2016, the year-on-year growth rate remained positive at 1.9%, resulting in an increase of $504 billion during 2016.
As regards currency composition, reduced euro-denominated lending led the decline in Q4 2016. A contraction of $208 billion in euro-denominated claims over the last quarter took the year-on-year growth rate to -1% (Graph 1, middle panels). While lending denominated in US dollars also fell, by $81 billion, cross-border claims in yen rose by $68 billion. Both US dollar- and yen-denominated credit were up on an annual basis at end-2016, by 3% and 5%, respectively.
Claims fell across all instrument categories in Q4 2016. Banks' holdings of debt securities dropped by $105 billion, slowing the pace of increase from 3% at end-September to 2% at end-December 2016 (Graph 1, bottom panels). Loans declined by $157 billion and other instruments by $30 billion; nevertheless, their annual growth rates were still positive, at 1% and 4%, respectively.
The fourth quarter downturn was driven primarily by lower lending to non-banks, which decreased for the first time in a year. Claims on non-banks fell by $210 billion, due mainly to a $120 billion contraction in lending to non-bank financial institutions, which include hedge funds, money market funds, pension funds and insurance companies.3 Meanwhile, interbank activity remained broadly unchanged, reflecting offsetting changes in claims on related offices and unrelated banks.
On a consolidated basis, bank credit to the official sector remained roughly constant. As of end-December 2016, foreign claims on the official sector - which include not only claims on governments but also deposits with central banks - amounted to 26% of total outstanding foreign claims, down 1 percentage point from the previous quarter.4
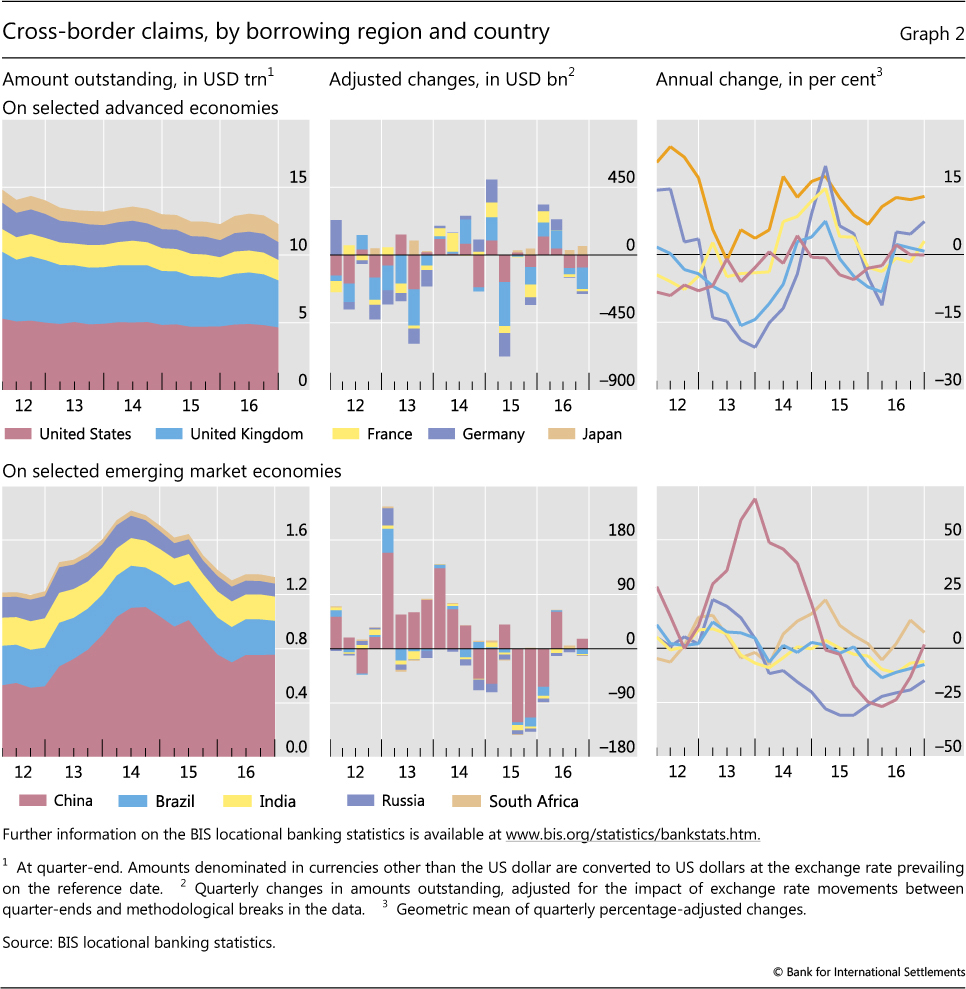
The $287 billion Q4 2016 contraction in lending to advanced economies primarily reflected a $143 billion fall in cross-border claims on the United Kingdom (Graph 2, top panels). As in the previous quarter, euro-denominated claims accounted for the largest share of the fall in cross-border claims on the United Kingdom (96% in Q3 and almost 80% in Q4 2016). All counterparty sectors shared in the overall decline. Cross-border claims on banks in the United Kingdom shrank by $72 billion and those on non-banks by $47 billion, while the remaining $24 billion contraction could not be allocated to a specific sector. Cross-border lending to the United States (-$82 billion) and several euro area countries also fell, whereas cross-border claims on Japan grew by $60 billion (Graph 2, top panels).
Cross-border claims on EMEs relatively stable
Cross-border bank claims on EMEs were relatively stable in Q4 2016, declining by $9 billion. The growth rate for 2016 as a whole was slightly positive (1%), representing a reversal of the annual decline experienced during 2015 and the first year-on-year increase since early 2015. Cross-border claims on Latin America and the Caribbean (-$16 billion) and emerging Europe (-$13 billion) contracted during Q4 2016, while claims on Africa and the Middle East and emerging Asia-Pacific rose by $13 billion and $7 billion, respectively.
In Latin America, a decline in claims on borrowers located in Brazil and Mexico accounted for the bulk of the overall decrease (Graph 2, bottom panels). Cross-border claims on Brazil fell by $9 billion, due primarily to a decline in claims on banks (-$15 billion). By contrast, the $6 billion fall in cross-border lending to Mexico mainly reflected a reduction in lending to non-financial sectors (-$5 billion).
Within emerging Europe, claims on Turkey fell the most in Q4 2016, declining by $9 billion. More than half of this decline reflected weaker US dollar-denominated lending. Claims on banks accounted for the quarterly fall, taking the outstanding stock of claims on this sector to $89 billion, down $17 billion in the year to end-December 2016.
The $16 billion quarterly increase in cross-border bank claims on China brought the outstanding stock of cross-border claims to $755 billion at the end of 2016. This latest quarterly rise supported a moderate recovery that had started in Q2 2016 but stalled in the third quarter. Interbank activity, especially among unrelated offices, was behind the Q4 increase. By contrast, cross-border lending to emerging Asia excluding China shrank by $9 billion. A $7 billion decline in lending to Korea and a $3 billion fall in claims on Indonesia were the main drivers, while lending to Chinese Taipei ($4 billion) grew marginally.
US money market fund reform affects international banking flows
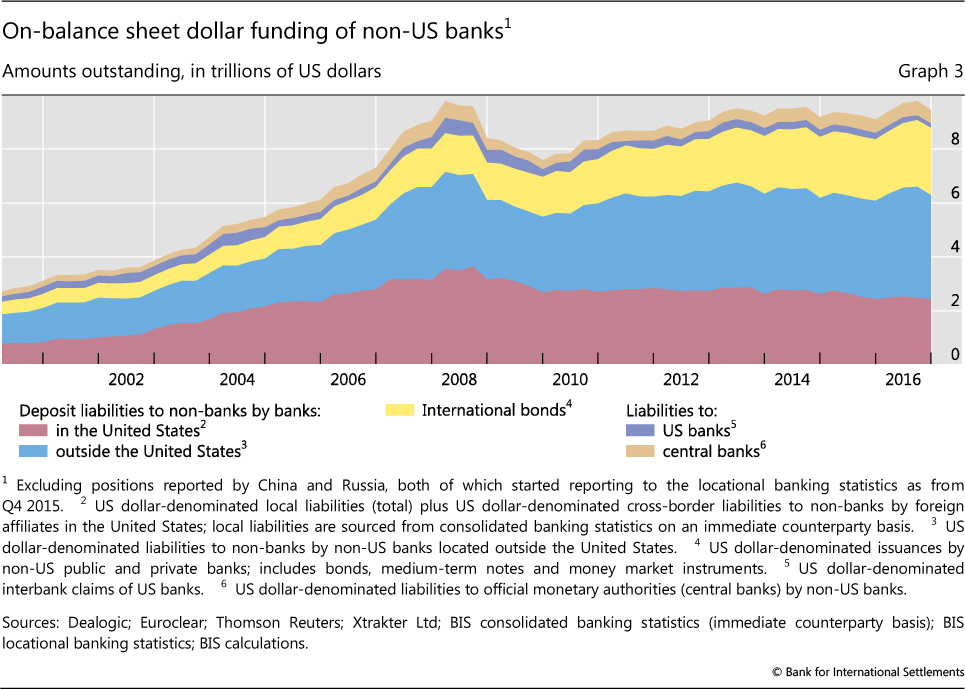
The reform of US money market funds (MMFs), which resulted in a substantial adjustment of dollar funding patterns for non-US banks, took effect in October 2016.5 Despite the fall in prime MMF funding, non-US banks increased their total on-balance sheet dollar funding over the adjustment period prior to the MMF reform (Q3 2015 to Q3 2016; Graph 3). Over this period, a loss of about $310 billion in US dollar funding from MMFs was compensated by increases in deposits of (ie liabilities to) non-banks in bank offices outside the United States ($467 billion) and international bonds ($179 billion). After reaching a record of $9.8 trillion in Q3 2016, on-balance sheet US dollar funding of non-US banks stood at $9.4 trillion as of end-December 2016, driven by a decline in offshore deposits.
Middle East oil exporters draw on global financing6
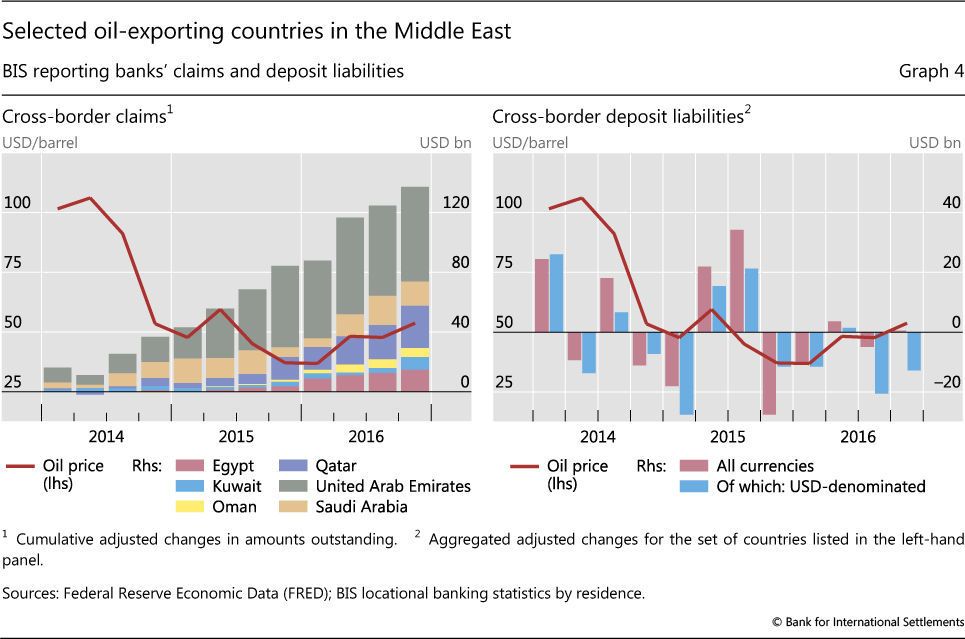
International banking and securities flows in 2016 were influenced by persistently low global oil prices, which put pressure on the fiscal position of many oil-exporting countries. Prices came down from more than $100 a barrel in 2014 to almost $30 at the beginning of 2016, before recovering partially to $54 by end-2016.
As explained in Domanski et al (2015),7 rising debt levels in the oil sector can create new linkages between certain commodity markets and the broader global economy. Further, the build-up of leverage has an impact on the responses of oil producers to lower revenues and, ultimately, oil price dynamics.
In securities markets, borrowers in oil-exporting countries carried out two of the three largest debt offerings in the history of EME sovereign debt. Saudi Arabia issued $17.5 billion in October 2016, and Qatar raised $9 billion in May 2016. The BIS international debt securities (IDS)8 database suggests that general government net issuance in 2016 reached $30.6 billion for Saudi Arabia, $10 billion for the United Arab Emirates and $9 billion for Qatar.
Meanwhile, bank lending to oil-exporting countries in the Middle East saw a sharp increase. The cross-border claims of BIS reporting banks, capturing loan and debt security holdings, on Saudi Arabia climbed by $10 billion (or 11% year on year at end-December 2016), by $13 billion (or 23%) on Qatar and by $11 billion (or 69%) on Egypt during 2016. Those on the United Arab Emirates rose by $9 billion (or 5%), while claims on Kuwait ($6 billion, or 29%) and Oman ($5 billion, or 41%) also went up (Graph 4, left-hand panel). From Q2 2014, when oil prices reached their most recent highs, to end-2016, the aggregate cross-border borrowing of these oil-exporting countries surged by $128 billion, taking the stock of outstanding claims to $404 billion at end-December 2016. About 77% of this new borrowing was denominated in US dollars, while sterling- and euro-denominated claims accounted for 9% and 7%, respectively.
A breakdown by instrument shows that traditional loans still dominate. Despite the record debt issuance observed in 2016, cross-border loans still capture 93% of the outstanding stock of total claims on the six oil producers covered in this section.
On a consolidated basis, UK banks feature as the most important single group of creditors. As of end-2016, UK banks reported the highest outstanding stock of international claims on these oil-exporting economies, at $67 billion, or 23% of the total. Euro area banks (French, German and Dutch) jointly accounted for 22%, followed by US (16%) and Japanese (14%) banks. That said, international banking activity involving banks from Asian EMEs is playing an increasingly important role.
Low oil prices also affected capital flows from Middle East oil producers into the international banking system, as those countries tend to draw down their deposits in periods of low revenues. Aggregate cross-border deposits held by residents of these oil-exporting economies with BIS reporting banks came down by $11 billion in 2016, taking the stock to $499 billion (Graph 4, right-hand panel). Deposits denominated in US dollars, in particular, dropped by $43 billion over that period. The outstanding stock of US dollar deposits, however, still made up more than two thirds of the total at end-2016. Saudi Arabia, the largest depositor country among the oil exporters under review, reduced its overall holdings the most (-$42 billion, or -22% year on year at end-2016).
As the LBS suggest, more than half of total deposits were placed with banks in advanced economies, such as the United Kingdom ($156 billion), the United States ($48 billion), France ($28 billion) and Switzerland ($26 billion).
Box A
Central clearing makes further inroads
Philip Wooldridge
Central clearing - a key element in the reform agenda for over-the-counter (OTC) derivatives markets aimed at reducing systemic risks - made further inroads in the second half of 2016. When, at end-June 2016, the BIS collected comprehensive data on central counterparties (CCPs) for the first time, the numbers showed that central clearing was predominant in OTC interest rate derivatives markets but less prevalent in other OTC derivatives segments. Data at end-December 2016 indicate that central clearing is gaining in importance in these other segments too.
In OTC interest rate derivatives markets, the share of outstanding contracts centrally cleared through CCPs stood at 76% of notional amounts outstanding at end-December 2016, similar to the share observed six months earlier (Graph A, left-hand panel). If this share is adjusted to approximate the proportion of trades - as opposed to outstanding positions - that are cleared through CCPs, then the estimated minimum clearing rate was 61%. The share of outstanding positions booked against CCPs was highest for forward rate agreements, at 92%, followed by interest rate swaps, at 81%. It remained less than 1% for interest rate options, although the outstanding amount of option contracts reported against CCPs quadrupled in the second half of 2016, from $53 billion to $225 billion.
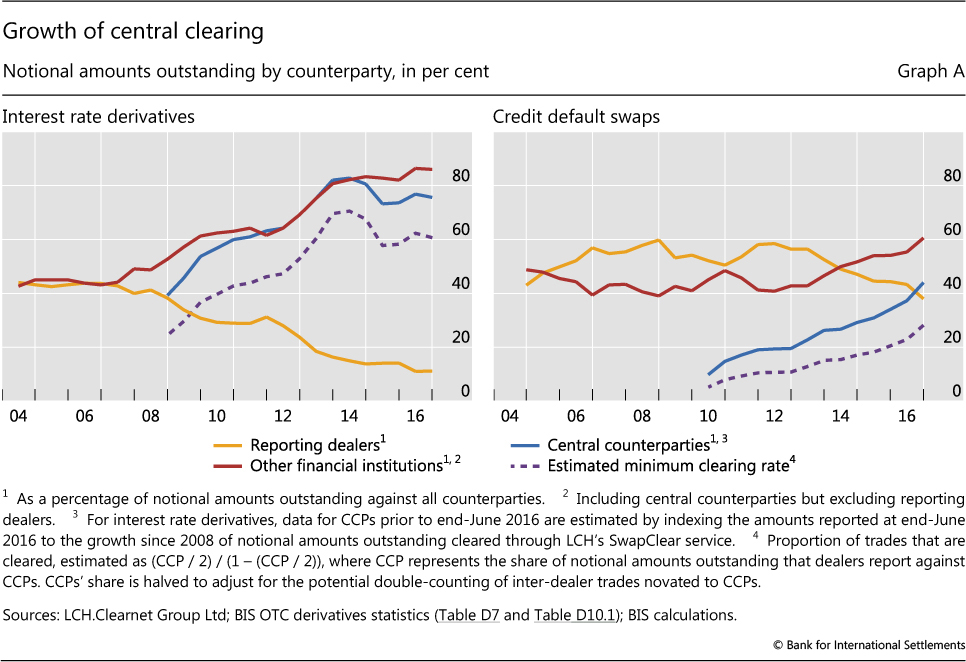
In credit default swap (CDS) markets, the share centrally cleared jumped from 37% of notional amounts outstanding at end-June 2016 to 44% at end-December 2016. This movement represented the largest semiannual increase in the centrally cleared share since CCP data for CDS were first collected in 2010 (Graph A, right-hand panel). It corresponds to an increase in the estimated minimum clearing rate from 23% to 28% in the second half of 2016. The proportion of outstanding CDS contracts centrally cleared increased for single-name as well as multi-name instruments, although the proportion remained much higher for the latter: 54% compared with 36%. Multi-name products tend to be more standardised than single-name products and consequently more amenable to central clearing. Notably, the increase in the proportion was driven by a sharp decline in the uncleared segment of CDS markets. Whereas the notional amount cleared through CCPs was more or less unchanged in the second half of 2016, at $4.3 trillion, the notional amount for contracts between reporting dealers fell from $5.1 trillion to $3.7 trillion.
In OTC foreign exchange derivatives markets, only 1% of notional amounts were centrally cleared at end-December 2016. That said, the outstanding amount cleared almost tripled in the second half of 2016, from $352 billion to $903 billion. While the BIS data do not break down FX derivatives into FX swaps and forwards, the growth of clearing was probably concentrated in non-deliverable forwards because they are commonly offered for clearing, whereas this is not the case for other FX instruments.
The rising importance of central clearing in OTC derivatives markets is consistent with the incentives provided by higher capital and margin requirements for non-centrally cleared derivatives. Regulators in most of the major derivatives markets require certain classes of standardised OTC derivatives, particularly interest rate swaps and CDS, to be centrally cleared. While options, FX derivatives and equity derivatives are generally not covered by these requirements, higher margin requirements for non-centrally cleared derivatives are being phased in, starting in Canada, Japan and the United States in September 2016 and in other key markets in 2017.
The proportion of outstanding positions against CCPs is typically larger than the proportion of trades cleared through CCPs - known as the clearing rate - because the former counts trades between dealers twice. In the BIS OTC derivatives statistics, whereas inter-dealer positions are adjusted to eliminate double-counting, inter-dealer trades that are subsequently novated to a CCP are not adjusted. When a derivatives trade is cleared by a CCP, the initial contract between counterparties A and B is replaced, in an operation called novation, by two new contracts: one between counterparty A and the CCP, and a second between the CCP and counterparty B. Under the extreme assumption that all positions with CCPs are initially inter-dealer contracts, positions with CCPs could be adjusted by dividing by two. The actual clearing rate is likely to be higher than this minimum estimate because some positions with CCPs may initially be trades with institutional investors and other financial customers, which in the BIS OTC derivatives statistics are not double-counted when novated to CCPs. For further discussion, see P Wooldridge, "Central clearing predominates in OTC interest rate derivatives markets", BIS Quarterly Review, December 2016, pp 22-24. See Financial Stability Board, "OTC derivatives market reforms: eleventh progress report on implementation", August 2016.
Box B
Residential property price developments
Robert Szemere
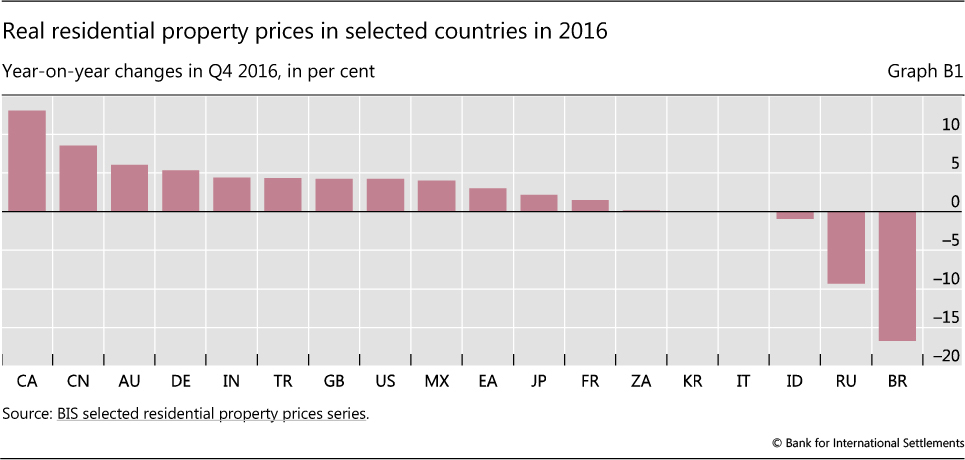
Residential property prices increased significantly in almost all advanced economies (AEs) during 2016. On average, prices grew by 4% in real terms - ie deflated by the consumer price index (CPI) - on a year-on-year basis. Their growth was particularly marked in Canada. Prices also rose strongly, though more moderately, in Australia, the United Kingdom and the United States. They grew less in Japan and in the euro area, where a significant increase in Germany was offset by stable prices in Italy (Graph B1).
Most of the emerging market economies (EMEs) also experienced strong price increases during 2016. Prices rose, for example, in China, India, Mexico and Turkey, but they fell markedly in Russia and even more so in Brazil. On average, real prices were up by 3% for EME regions as a whole (Graph B1).
Developments since 2007
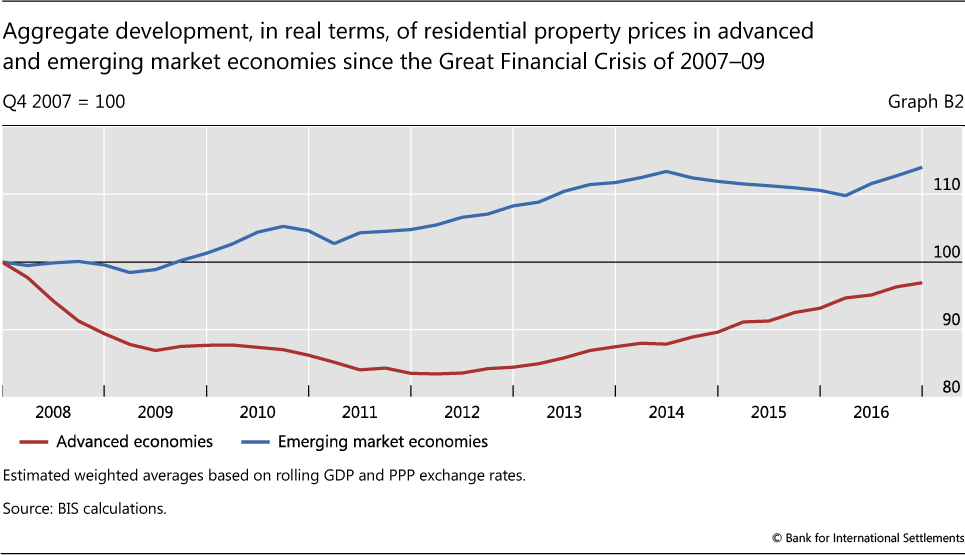
After a sharp decline following the Great Financial Crisis (GFC) of 2007-09, average real residential property prices in AEs bottomed out in 2011-12. They have now almost recouped their post-GFC declines (Graph B2). At the end of 2016, real prices were only modestly below their 2007 levels in the United Kingdom and the United States (by 6-7%). The gap was slightly wider for the euro area (by 10%), with important disparities across this region: real prices are now significantly above their pre-GFC levels in Germany, but they are well below this benchmark in France and even more so in Italy. Turning to those other AEs which were much less affected by the GFC, real prices are almost comparable to their 2007 levels in Japan, whereas they are significantly above them in Canada and Australia (Graph B3).
After a marked expansion in the early 2010s, real residential property prices in EMEs have almost stabilised since 2014, at almost 15% above the levels registered in 2007 (Graph B2). Compared with the period of the GFC, prices have almost doubled in India. They are one third higher in Brazil, despite the significant downward correction observed most recently, and are also slightly higher in China, Mexico and Turkey (by around 10% in each case). By contrast, prices are still below their 2007 levels in Indonesia and South Africa, and they have roughly halved in Russia (Graph B3).
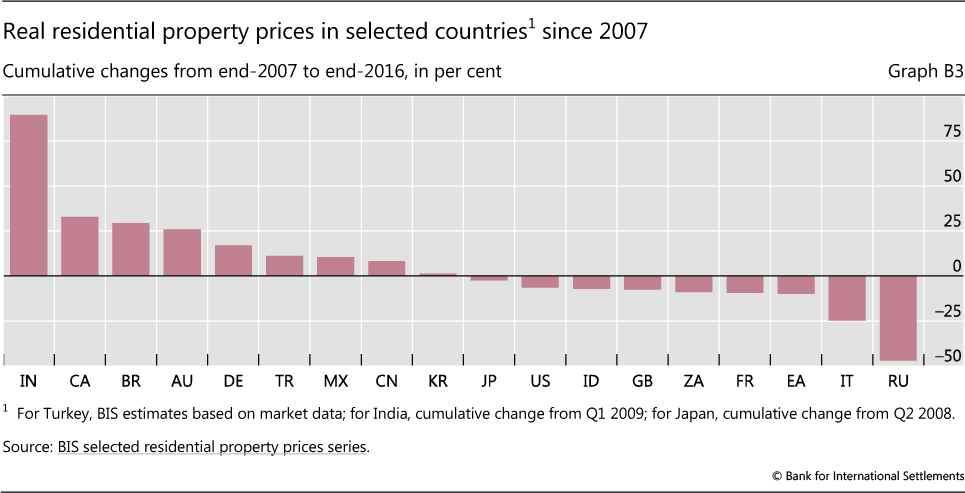
A note focusing on the most recent developments is published in February, August and November. Q1 2017 data are already available in the BIS data sets for some countries, but Q3 and Q4 2016 data are not yet available for two and three countries, respectively. Price developments since early 2008 for Japan and early 2009 for India. For China, BIS calculation based on the average of the prices reported for the 70 largest cities.
References:
Scatigna, M and R Szemere (2015): "BIS collection and publication of residential property prices", Irving Fisher Committee Bulletin, no 39, April.
Scatigna, M, R Szemere and K Tsatsaronis (2014): "Residential property price statistics across the globe", BIS Quarterly Review, September, pp 61-76.
Shim, I and K Kuttner (2013): "Can non-interest rate policies stabilise housing markets? Evidence from a panel of 57 economies", BIS Working Papers, no 433, November.
Tissot, B (2014): "Monitoring house prices from a financial stability perspective - the BIS experience", International Statistical Institute Regional Statistics Conference, November.
1 This article was prepared by Iñaki Aldasoro (inaki.aldasoro@bis.org) and Cathérine Koch (catherine.koch@bis.org). Statistical support was provided by Swapan-Kumar Pradhan.
2 The locational banking statistics are structured according to the location of banking offices and capture the activity of all internationally active banking offices in the reporting country regardless of the nationality of the parent bank. Banks record their positions on an unconsolidated basis, including those vis-à-vis their own offices in other countries. Quarterly changes in outstanding amounts are adjusted for the impact of exchange rate movements between the ends of the respective quarters and for methodological breaks in the data series.
3 For more information on sector definitions and other technical terms, see the Glossary on the BIS website.
4 These figures draw on the BIS consolidated statistics on an ultimate risk basis, which exclude intragroup positions and take into account risk transfers. The inclusion of claims on central banks in the aggregate for government claims represents a different approach from that used in the System of National Accounts.
5 See "Highlights of global financial flows", BIS Quarterly Review, March 2017, pp 15-23.
6 To single out the economic aspects, this analysis focuses on the following set of oil-exporting countries in the Middle East: Egypt, Kuwait, Oman, Qatar, Saudi Arabia and the United Arab Emirates.
7 D Domanski, J Kearns, M Lombardi and H S Shin, "Oil and debt", BIS Quarterly Review, March 2015, pp 55-66.
8 IDS are debt securities issued in a market other than that of the country of residence of the borrower.