Oil and debt
The total debt of the oil and gas sector globally stands at roughly $2.5 trillion, two and a half times what it was at the end of 2006. The recent fall in the oil price represents a significant decline in the value of assets backing this debt, introducing a new element to price developments. In common with other episodes of retrenchment induced by rapid declines in asset values, greater leverage may have amplified the dynamics of the oil price decline. The high debt burden of the oil sector also complicates the assessment of the macroeconomic effects of the oil price decline because of its impact on capital expenditure and government budgets, and due to the interaction with a stronger dollar.1
JEL classification: D24, L71, Q02, Q43.
From mid-2014, the price of crude oil fell substantially after hovering at historically high levels around $100 for four years. In spite of the expected boost to household incomes and corporate profits globally, an intense debate has unfolded about what lower oil prices imply for the outlook across economies.
A new element that can help shed light on this question is the high level of debt of the oil sector. The debt borne by the oil and gas sector has increased two and a half times over, from roughly $1 trillion in 2006 to around $2.5 trillion in 2014.2 As the price of oil is a proxy for the value of the underlying assets that underpin that debt, its recent decline may have caused significant financial strains and induced retrenchment by the sector as a whole. If the adjustment takes the form of increased current or future sales of oil, it may amplify the fall in the oil price. Similarly, if the need to service debt delays a pullback in production, a lower price may act more slowly to balance supply and demand.
More broadly, assessing the macroeconomic impact of lower oil prices becomes more complicated. The resultant decline in capital expenditure will be sharper for more indebted firms, and tighter credit conditions for all firms will reverse the debt-financed investment boom. The fiscal impact of the oil price decline will be felt more acutely in countries where debt issuance by state-owned oil companies has facilitated the transfer of profits to the government.
This special feature explores the link between oil and debt. It is organised as follows. The first section discusses the recent fall in oil prices. The second documents the increase in leverage in the oil-producing and related sectors. The third analyses oil firms' responses to lower oil prices against the backdrop of high debt. The fourth explores the broader economic and financial ramifications of the collapse in the price of oil. The last section concludes.
The fall in the price of oil
As typically occurs with abrupt price changes, commentators and policymakers have scrambled to rationalise the recent fall in oil prices.3 Strong growth in US oil production is an important part of the explanation: since early 2009 it has risen more than 70%, equivalent to almost 4 million barrels per day, with the bulk of the increase coming from shale oil. Overall, however, the growth of oil production has not been especially rapid. The decline in prices has also been attributed in part to demand-side developments: slower economic growth in Asia and Europe has reduced current and expected future oil consumption (see IEA (2015) for a detailed analysis of supply and demand trends).
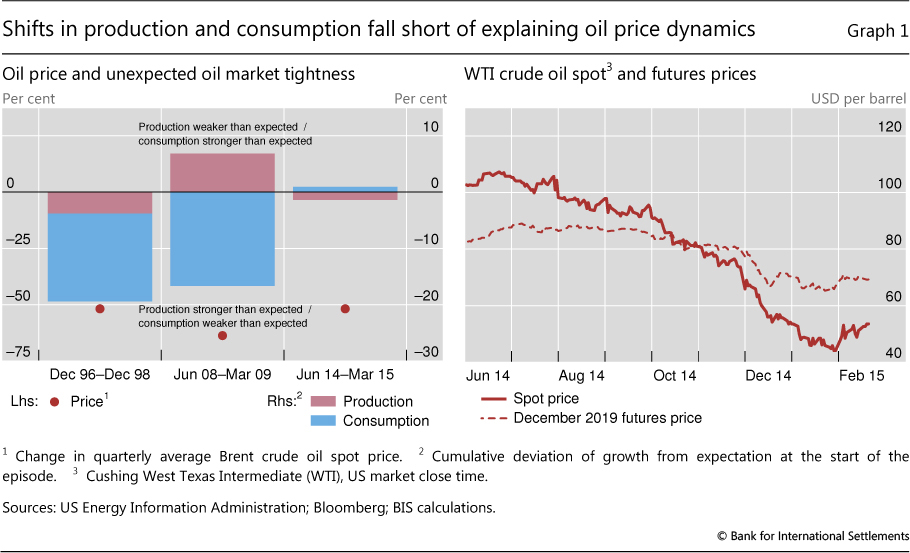
However, shifts in production and consumption seem to fall short of a fully satisfactory explanation of the collapse in oil prices. Current estimates of the growth of oil production and oil consumption since mid-2014 have deviated little from earlier forecasts (Graph 1, left-hand panel). This contrasts starkly with the last two periods of comparable oil price declines in 1996 and 2008: these episodes were associated with sizeable reductions of oil consumption and, in 1996, with some expansion of production. While the recent oil production and consumption figures are estimates that can be revised, the absence of sharp declines in other commodity prices and industrial production also suggest that the fall in the oil price is not attributable to a large contraction in oil consumption which is not yet reflected in the data. Rather, the steepness of the oil price decline since mid-2014 and the clustering of very large day-to-day price declines are reminiscent of an asset market, whose dynamics reflect not only shifts in market participants' expectations about fundamentals but also binding financial constraints that condition firms' responses.
As regards expectations about fundamentals, prices fell along the whole futures curve after OPEC's decision in November 2014 to maintain production levels in response to falling prices. Long-dated futures prices, which had been relatively stable during the preceding fall in the spot price, dropped by about $15 in the two weeks after the OPEC meeting (Graph 1, right-hand panel).4 Commentators have identified this as change in expectations about equilibrium prices because of a persistent change in supply conditions.5 Oil market participants apparently saw OPEC's decision as a signal that it is no longer prepared to act as swing producer in the face of rapidly rising non-OPEC production.
As regards financial constraints, the price decline occurred against the backdrop of much higher debt levels of oil producers. By analogy with the housing market, when the underlying assets of a leveraged sector fall in value, the strain imposed by the price decline induces retrenchment - for instance, by trying to sell more of the asset backing the debt. Oil is not housing, but analogous actions such as hedging may exert additional downward pressure on the underlying asset. The remainder of this article explores in more detail the mechanisms through which the substantial increase in leverage of the oil industry took place, and the forces that are unleashed when that leverage starts to unwind.
The build-up of oil-related debt
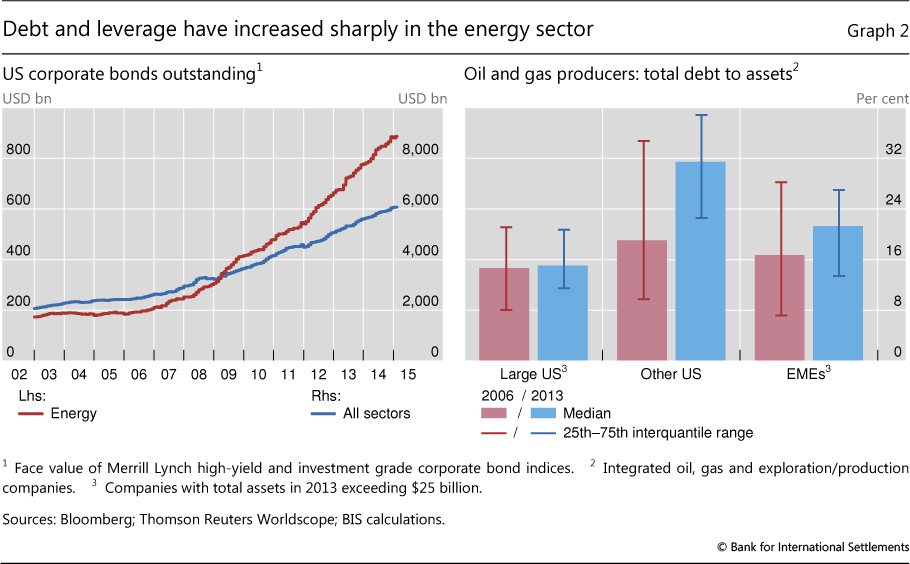
The greater willingness of investors to lend against oil reserves and revenue has enabled oil firms to borrow large amounts in a period when debt levels have increased more broadly due to easy monetary policy. Since 2008, companies in the oil sector have borrowed both from banks and in bond markets. Issuance of debt securities by oil and other energy companies has far outpaced the substantial overall issuance by other sectors (Graph 2, left-hand panel). Oil and gas companies' bonds outstanding increased from $455 billion in 2006 to $1.4 trillion in 2014, a growth rate of 15% per annum. Energy companies have also borrowed heavily from banks. Syndicated loans to the oil and gas sector in 2014 amounted to an estimated $1.6 trillion, an annual increase of 13% from $600 billion in 2006.6
Overall, the stock of debt of energy firms has risen even faster than that of other sectors. Debt issued by oil and other energy firms accounts for about 15% of both investment grade and high-yield major US debt indices, up from less than 10% just five years earlier.
A substantial part of the increased borrowing has been by state-owned major integrated oil firms from emerging market economies (EMEs). From 2006 to 2014, the stock of total borrowing (syndicated loans and debt securities) of Russian companies grew at an annual rate of 13%, that of Brazilian companies 25% and that of Chinese companies 31%. Borrowings of companies from other EMEs increased by 17% per annum. The increase in the leverage of EME companies contrasts with the stable leverage of comparable-sized large firms in the United States (Graph 2, right-hand panel). These EME companies have substantial existing production and therefore revenue. In many cases, their borrowing has coincided with large dividend payments to their sovereign owners. Hence, their behaviour appears similar to that of large, cash-rich firms in other sectors that have used very easy borrowing conditions in international markets to increase equity returns.
US oil companies have also borrowed heavily. They account for around 40% of both syndicated loans and debt securities outstanding. Much of this debt has been issued by smaller companies, in particular those engaged in shale oil exploration and production. Indeed, while the ratio of total debt to assets has been broadly unchanged for large US oil firms, it has on average almost doubled for other US producers - including smaller shale oil companies. These firms borrowed heavily to finance the expansion of production capacity, often against the backdrop of negative operating cash flow. Indeed, shale investment accounts for a large share of the increase in oil-related investment. Annual capital expenditure by oil and gas companies has more than doubled in real terms since 2000, to almost $900 billion in 2013 (IEA (2014)).
Producers' responses to lower oil prices
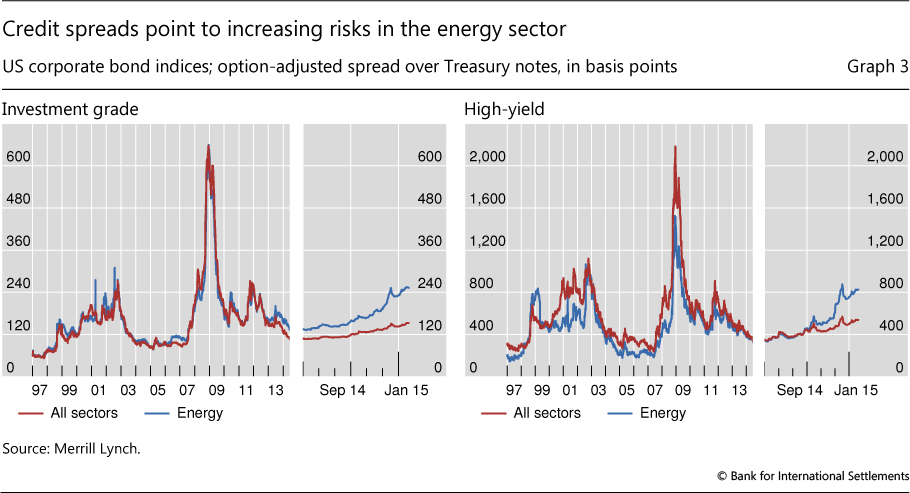
The combination of falling oil prices and higher leverage can lead to financial strains for oil-related firms. First, the price of oil underpins the value of assets that back these firms' debts. Lower prices will tend to reduce profitability, increase the risk of default and lead to higher financing costs. Indeed, spreads on energy high-yield bonds widened from a low of 330 basis points in June 2014 to over 800 basis points in February 2015, much more than the increase for total high-yield debt (Graph 3). Second, a lower price of oil reduces the cash flows associated with current production and increases the risk of liquidity shortfalls in which firms are unable to meet interest payments.
Such strains may affect the way firms respond to lower oil prices in two main ways. The first is by adjusting investment and production. Where a substantial portion of investment is debt-financed, higher costs and tighter lending conditions may accelerate the reduction in capital spending. Highly indebted firms could even be forced to sell assets, including rights, plant and equipment. As regards production, highly leveraged producers may attempt to maintain, or even increase, output levels even as the oil price falls in order to remain liquid and to meet interest payments and tighter credit conditions. Second, firms with high debt levels face stronger imperatives to hedge their exposure to highly volatile revenues by selling futures or buying put options in derivatives markets, so as to avoid corporate distress or insolvency if the oil price falls further.
The overall impact of these responses on oil price dynamics is two-sided. On the one hand, cutbacks in the capital expenditure of oil firms (or announcements thereof) would tend to lift oil prices through (expectations of) future lower supply. Asset sales should be price-neutral. On the other hand, if financial constraints keep production levels high and result in increased hedging of future production, the addition to oil sales would magnify price declines. In the extreme, a downward-sloping supply response of increased current and future sales of oil could amplify the initial decline in the oil price and force further deleveraging.7 Assessing the possible role of such an induced increase in supply during the current market downturn is an empirical question which will be tackled in the remainder of the section.
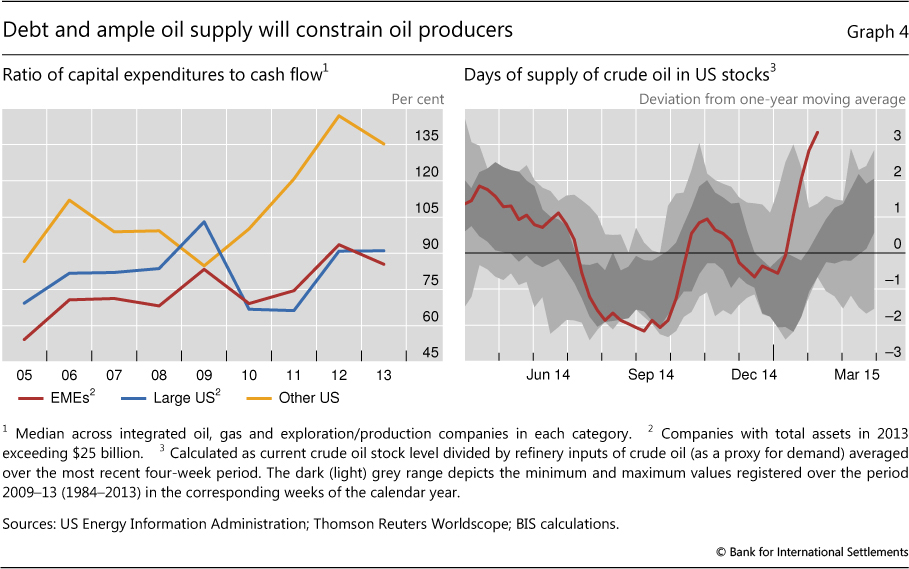
Recent developments in oil capital spending and production appear consistent with the responses laid out above. Many companies have already announced reductions in capital spending of 30% or even 50%. Companies with less cash flow from existing production, and larger interest payments from existing high debt, will be most constrained in financing ongoing investment. In particular, for smaller US firms, including many shale oil firms, capital expenditures have exceeded cash flows from oil sales by wide margins (Graph 4, left-hand panel). Indeed, the US shale rig count has fallen sharply in recent months.
At the same time, oil production has remained strong. In the United States, estimates of oil stocks have increased quite markedly in recent months on the strength of production growth and some softening of demand (Graph 4, right-hand panel). Production typically responds with a lag to lower prices as existing wells continue to produce even when prices fall given their large fixed costs and lower marginal costs. However, the combination of a lower rig count with continued strong production in spite of the short life of shale wells may reflect more selective exploitation of productive wells by producers to meet cash flow needs.
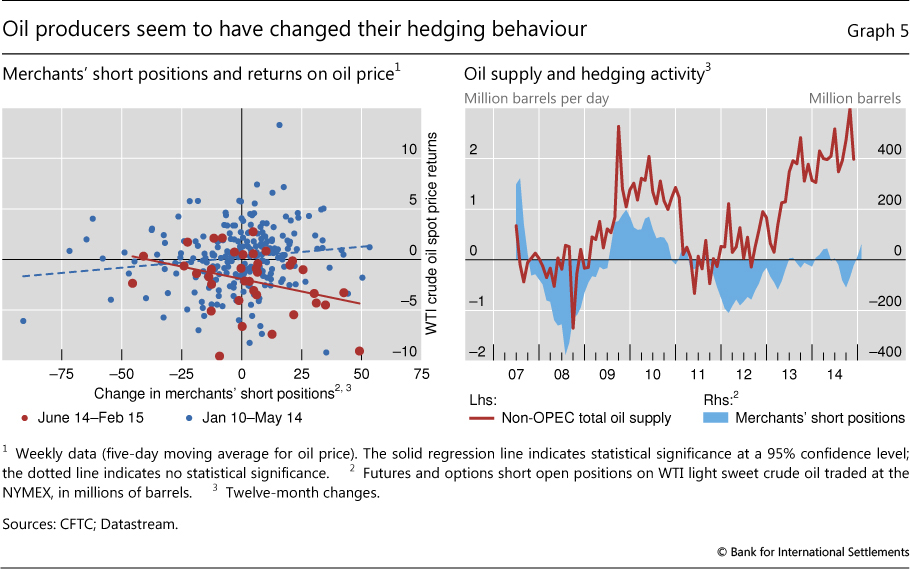
More notably, increased hedging by oil producers seems to have been associated with downward pressure on oil prices more recently. The short positions of "merchants" in organised derivatives markets as reported by the US Commodities and Futures Trading Commission (CFTC), a proxy for this hedging activity,8 have increased by about 70 million barrels since August 2014.9 The left-hand panel of Graph 5 plots the association between increases in short positions and changes in the oil price. This relationship is mildly positive (but not statistically significant) during the period of relatively stable prices between January 2010 and May 2014, but it turns negative after June 2014. And, in contrast to the earlier episode of falling oil prices in 2008, when the slope of the regression line was also negative, the relationship is statistically significant for the most recent period. Since July 2014, producers have sold additional oil in the futures market amidst declining prices - that is, the supply response has been downward-sloping. This could well reflect the role of leverage, although a more in-depth investigation would be needed to establish whether it is indeed leverage that explains the difference from 2008.
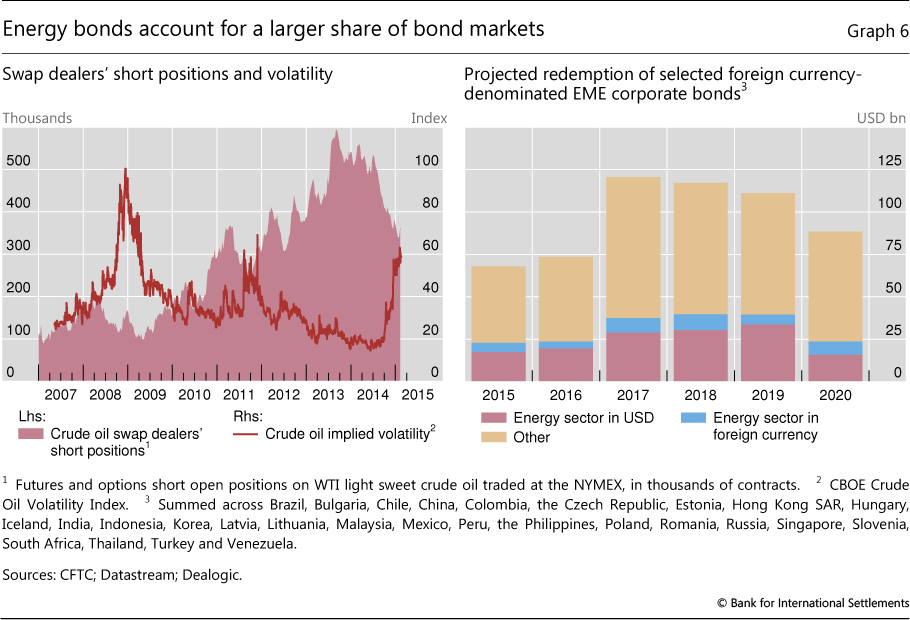
Position-taking in organised derivatives markets provides only a partial picture of oil producer hedging. Producers also rely on tailor-made derivatives contracts (over-the-counter (OTC) contracts) provided by swap dealers for hedging. There is some, albeit indirect, evidence that producers have increasingly hedged through swap dealers over the past few years. Between 2007 and 2012, changes in CFTC-reported short positions of merchants broadly tracked shifts in oil production (Graph 5, right-hand panel), suggesting that hedging kept pace with extraction activity.10 In contrast, the surge in production in 2013 - mostly of US shale oil - was not matched by an increase in merchants' short positions in the CFTC data. Instead, short positions of swap dealers almost doubled (Graph 6, left-hand panel). However, during the period of falling oil prices from mid-2014, short positions of swap dealers fell sharply.
These shifts in short positions of swap dealers raise questions about possible broader changes in oil derivatives markets that may have affected the availability and cost of hedging. Swap dealers are an important part of the oil derivatives ecosystem. They comprise specialised commodity traders (including trading affiliates of some large oil producers) as well as subsidiaries of major banks. Some of the latter are, in turn, major providers of commodity investment products such as exchange-traded funds (ETFs) and mutual funds. The demand for energy-backed investment products provided a natural match to producer hedging needs. This changed with outflows from energy investment products beginning in 2013 (Barclays (2015)), which may have forced swap dealers to cover their exposures vis-à-vis producers by taking short positions in the open market.
Finally, liquidity in oil derivatives markets may have deteriorated. Financial intermediaries have reduced market-making capacity post-crisis in response to market pressure and more stringent regulation (Fender and Lewrick (2015)). And, as with other market-makers, commodity swap dealers will aim to reduce positions when volatility increases (Graph 6, left-hand panel).11 Oil derivatives trading is no exception to the risks arising from the withdrawal of such "fair weather liquidity".12
Broader economic repercussions
The previous section explored how high debt levels could affect the response of producers to falling oil prices. While far from being conclusive, there is some support for the view that leverage is affecting production and hedging decisions of oil producers. Related to this, there are broader questions about the impact of oil sector debt on the financial system and the wider economy.
From the perspective of market functioning and financial stability, the large outstanding debt of the oil sector focuses attention on how that debt is intermediated. Both banks and bond markets play an important role in providing credit to oil-related firms.
As regards banks, anecdotal evidence points to risk-shedding that is similar to other episodes of sharply declining values of collateral assets. In particular, US banks have reportedly cut back short-term credit lines to shale oil companies, or demanded additional collateral.
Perhaps even more important is the behaviour of long-term fixed income investors. Being able to absorb losses in the short term, long-term investors in debt securities have often been considered a stabilising influence on financial markets. However, recent experience suggests that even long-term investors have limited appetite for losses and may join in any selling spree. A sell-off of oil company debt could spill over to corporate bond markets more broadly if investors try to reduce the riskiness of their portfolios. The fact that debt of oil and gas firms represents a substantial portion of future redemptions underlines the potential system-wide relevance of developments in the sector (Graph 6, right-hand panel).
The high debt level of the oil sector also complicates the macroeconomic assessment of lower oil prices, for at least three reasons. First, any amplifying effect of high leverage on capital expenditure in the oil sector could have knock-on effects on investment in other sectors. As discussed in Banerjee et al (2015), uncertainty and expected profitability are major determinants of investment. Retrenchment in the oil sector could therefore affect the outlook and spending in energy-related sectors, but also in other sectors of economies or regions that are heavily dependent on oil production.
Second, the impact of the oil price collapse on government fiscal revenue can be large. In several countries, oil-related revenue accounts for a substantial proportion of the government budget, and the financial strains posed by the oil price decline for highly leveraged state-owned oil companies will impose more acute fiscal constraints on government spending. Some countries have hedged their fiscal commitments by entering into formal hedging transactions. For instance, Mexico's Oil Income Stabilisation Fund (FEIP) has an explicit hedging programme using option contracts in oil for one year. However, pressure on fiscal revenues will be felt if hedges expire before oil prices recover. Finally, oil companies in some EMEs seem to have increased leverage in order to finance dividend payments to governments (Graph 4, left-hand panel). Sustaining such payments has become much more costly.
Third, there is a potential interaction between the oil price collapse and exchange rate movements. As noted already, many firms in the oil sector are non-US (often EME) firms that have nevertheless borrowed in dollars. Currency mismatches in their cash flows may be smaller than for other sectors to the extent that oil revenues are in dollars. Even so, oil companies located in EMEs may be perceived to be more risky and find access to new foreign currency borrowing more difficult than those in advanced economies. Given that EME oil firms have increased their borrowing sharply over the past decade, they could be particularly susceptible to tighter credit conditions.
Conclusions
This article has explored the interaction between oil prices and high debt levels of oil companies. There is some evidence that higher leverage has affected the response of oil producers to lower prices and, eventually, oil price dynamics. Oil sector leverage also complicates the assessment of the macroeconomic implications of lower oil prices.
Many of the findings are tentative, and quantifying the financial and macroeconomic significance of the mechanisms discussed remains a topic for future research. That said, the discussion highlights two issues that are of relevance beyond the energy sector.
First, the oil-debt nexus illustrates the evolving risks in the financial system. Rapidly rising leverage creates risk exposures in the non-financial corporate sector that may be transferred across the global financial system. Similarly, rising leverage puts a greater premium on the liquidity of the markets for the assets that back debt. Both developments underscore the need to better understand the functioning, behaviour and interaction of markets and intermediaries.
Second, the build-up of debt in the oil sector provides an example of how high debt levels can induce new linkages between individual markets and the wider economy. Such interaction needs to be taken into account in assessments of the economic implications of falling oil prices.
References
Banerjee, R, J Kearns and M Lombardi (2015): "(Why) Is investment growth weak?", BIS Quarterly Review, March, pp 67-82.
Barclays (2015): "The commodity investor - flows analysis", January.
Baumeister, C and L Kilian (2015): "Understanding the decline in the price of oil since June 2014", CEPR Discussion Papers, no 10404, February.
Committee on the Global Financial System (2014): "Market-making and proprietary trading: industry trends, drivers and policy implications", CGFS Papers, no 52, November.
Fender, I and U Lewrick (2015): "Shifting tides - market liquidity and market-making in fixed income instruments", BIS Quarterly Review, March, pp 97-109.
International Energy Agency (2014): "World energy investment outlook", June.
--- (2015): "Medium-term oil market report", January.
Mnasri, M, G Dionne and J-P Gueyie (2013): "The maturity structure of corporate hedging: the case of the US oil and gas industry", CIRRELT Working Paper, no 2013-65, October.
Shin, H S (2010): "Risk and liquidity", Clarendon Lectures in Finance, Oxford University Press, Oxford, United Kingdom.
1 We are grateful to Claudio Borio and Christian Upper for useful comments and suggestions, and to Pablo García-Luna and Giovanni Sgro for excellent research support. The views expressed in this article are those of the authors and do not necessarily reflect those of the BIS.
2 The data used in this special feature refer for the most part to oil and gas companies: many firms have both oil and gas operations, hence data are not available for oil companies only. Some data refer to a broader grouping of energy companies.
3 See Baumeister and Kilian (2015) for a model-based assessment of the various explanations proposed so far.
4 Futures prices also contain a risk premium. However, the change in futures prices following an important announcement is more likely to reflect a change in long-run expectations than in the risk premium.
5 Some quantitative models fail to detect a shock to supply during this period. See, for instance, Baumeister and Kilian (2015).
6 These figures probably overstate the stock of loans outstanding to some extent, because some loans are never drawn down and others are repaid early, but they provide a reasonable estimate of the rate of growth.
7 Such deleveraging would be akin to that observed in other asset markets during the financial crisis. Shin (2010) notes that downward-sloping supply responses are a common feature of asset markets with leveraged actors.
8 The CFTC reports on a weekly basis the positions taken by different types of market participants in organised oil futures and options markets. The short side of the market is normally dominated by "merchants", ie agents engaged in the production or processing of oil. By contrast, the typical counterparties in derivatives markets to such hedging activities have been "money managers", ie agents who want to gain exposure to oil price risk but have no underlying business in the oil market.
9 Interestingly, the recent increase in merchants' short positions was partially driven by the purchase of put options. While this pattern is not unusual for periods of high oil price volatility, it is also consistent with the finding that oil and gas firms rely more on put options when the risk of financial distress increases (Mnasri et al (2013)).
10 Graph 5 shows only changes in non-OPEC production, reflecting the stated policy of OPEC producers not to hedge production.
11 Commodity-related investment products suffered substantial outflows in 2013 and 2014. Barclays (2015) estimates outflows of more than $50 billion in 2013 and nearly $20 billion in 2014. This may have further exacerbated the impact, by reducing swap dealers' capacity to compensate for the risk they face in entering hedging contracts by passing on such risk to investors in the form of commodity-related investment products.
12 See CGFS (2014).