Highlights of global financial flows
The BIS, in cooperation with central banks and monetary authorities worldwide, compiles and disseminates data on activity in international financial markets. It uses these data to compile indicators of global liquidity conditions and early warning indicators of financial stability risks. This chapter analyses recent trends in these indicators. It is based on the latest data for international banking markets, available up to September 2016, and for international debt securities, available up to December 2016.1
Takeaways
- Growth in international bank claims resumed in the second and third quarters of 2016, following year-on-year declines in late 2015 and early 2016. The recovery was led by 3.8% year-on-year growth in claims on the non-bank sector, while interbank claims contracted by 3.2% in Q3 2016.
- The stock of international debt securities grew steadily at the rate of 3.8% year on year in the fourth quarter of 2016, helped by a pickup in banks' net debt issuance to 2.2%. Net debt securities issuance by non-banks also increased slightly, as outstanding securities rose 4% year on year in Q3 2016 and 4.6% in Q4.
- US dollar credit to non-bank borrowers outside the United States grew by $420 billion between end-Q1 and end-Q3 2016. When newly reported data for credit extended by banks in China and Russia are included, the total outstanding amount at end-September 2016 stood at $10.5 trillion.
- US dollar credit to emerging market economy (EME) non-banks grew slightly. After including the newly reported data by banks in China and Russia, it stood at $3.6 trillion at end-Q3 2016.
- As a result of reforms to US money market funds, US dollar funding for non-US banks from prime funds fell by $555 billion from end-September 2015 to end-December 2016; this was partly offset by a $140 billion increase in funding from government funds (see box). Despite the cut, US dollar credit to non-US banks continued to grow, as these banks found funding from other sources.
Global credit recovered in the second half of 2016
Global credit conditions, as measured by the aggregates tracked by the BIS global liquidity indicators (GLIs), recovered and strengthened somewhat in the second half of 2016.2 The increase was driven by international bank claims (cross-border claims plus local claims in foreign currency),3 which picked up in the second quarter of 2016 and fell only a small amount in the third quarter. Cumulated annual flows were small but positive in these two quarters, leading to moderate year-on-year increases of 0.2% in each case (Graph 1, top panel). Continuing a trend that started in the second quarter of 2015, global interbank credit decreased on a year-on-year basis. The pace of the decline, however, slowed in both Q2 and Q3 2016. By contrast, credit to non-banks picked up in those quarters, after a slight deceleration in Q1 2016. International bank claims on the non-bank sector rose for 10 consecutive quarters up to the third quarter of 2016, the latest observation available.

Net issuance of international debt securities4 also picked up slightly in the second half of 2016 (Graph 1, bottom panel), with $229 billion net issuance in the third quarter alone. The stock of debt securities grew 3.8% from end-December 2015 to end-December 2016 - the largest four-quarter increase since Q3 2009-Q2 2010. Both banks and non-banks expanded their use of international bond markets: year-on-year growth in the stock of international debt securities by the banking sector was positive in Q3 2016 (1.2%, the first year-on-year expansion since Q2 2015), and picked up further in Q4 to 2.2%. Net debt securities issuance by non-banks also accelerated in the second half of 2016, as year-on-year growth in outstanding amounts advanced from 3.6% in Q2 2016 to 4% and 4.6% in the third and fourth quarters, respectively.
With the recovery in overall international bank credit and debt securities issuance, total foreign currency credit, in particular in US dollar and euros, also grew slightly faster in the second and third quarters of 2016 (Graph 2).
US dollar- denominated bank loans to the non-bank sector outside the US grew 2.4% in the third quarter of 2016 over the preceding year, compared with less than 1% in the first two quarters of 2016 (Graph 2, top panels). Outstanding amounts of US dollar-denominated debt securities by non-residents in the non-financial sector increased by 6.2% year on year in the third quarter, accelerating from 4% and 5.9% in the first and second quarters, respectively. Total outstanding US dollar credit (bank loans plus debt securities) to the non-financial sector outside the US rose from $8.1 trillion at end-March 2016 to $8.4 trillion at end-September 2016. During the same period, US dollar credit to non-banks rose from $10.1 trillion to $10.5 trillion.
The recent inclusion of China and Russia in the set of countries reporting to the BIS locational banking statistics (LBS) has made more detailed information on foreign currency credit available.5 In particular, the estimates now include data for credit extended by banks in China and Russia. Without the newly available data, the estimate for the total amount of US dollar credit to non-banks outside the US would have been $10 trillion at end-September 2016 - about $500 billion lower than the current estimate. The effect of the additional data on the trend increase in outstanding amounts since Q1 2016, however, was minimal.
Supported by low euro area sovereign bond yields, the stock of euro-denominated debt securities issued by non-financials outside the euro area continued to rise. Year-on-year growth was 13% up to the end of the third quarter of 2016 (Graph 2, centre panels), marking the 12th consecutive quarter of year- on-year growth exceeding 10%. In contrast, euro-denominated bank loans to non-residents were essentially flat in the second and third quarters of 2016, with 0.6% and -0.6% year-on-year growth, respectively. As a result, the overall amount of euro- denominated credit to non-financials outside the euro area increased by just €36 billion ($39 billion)6 from end-March to end-September 2016, to reach a total of €2.2 trillion ($2.3 trillion).
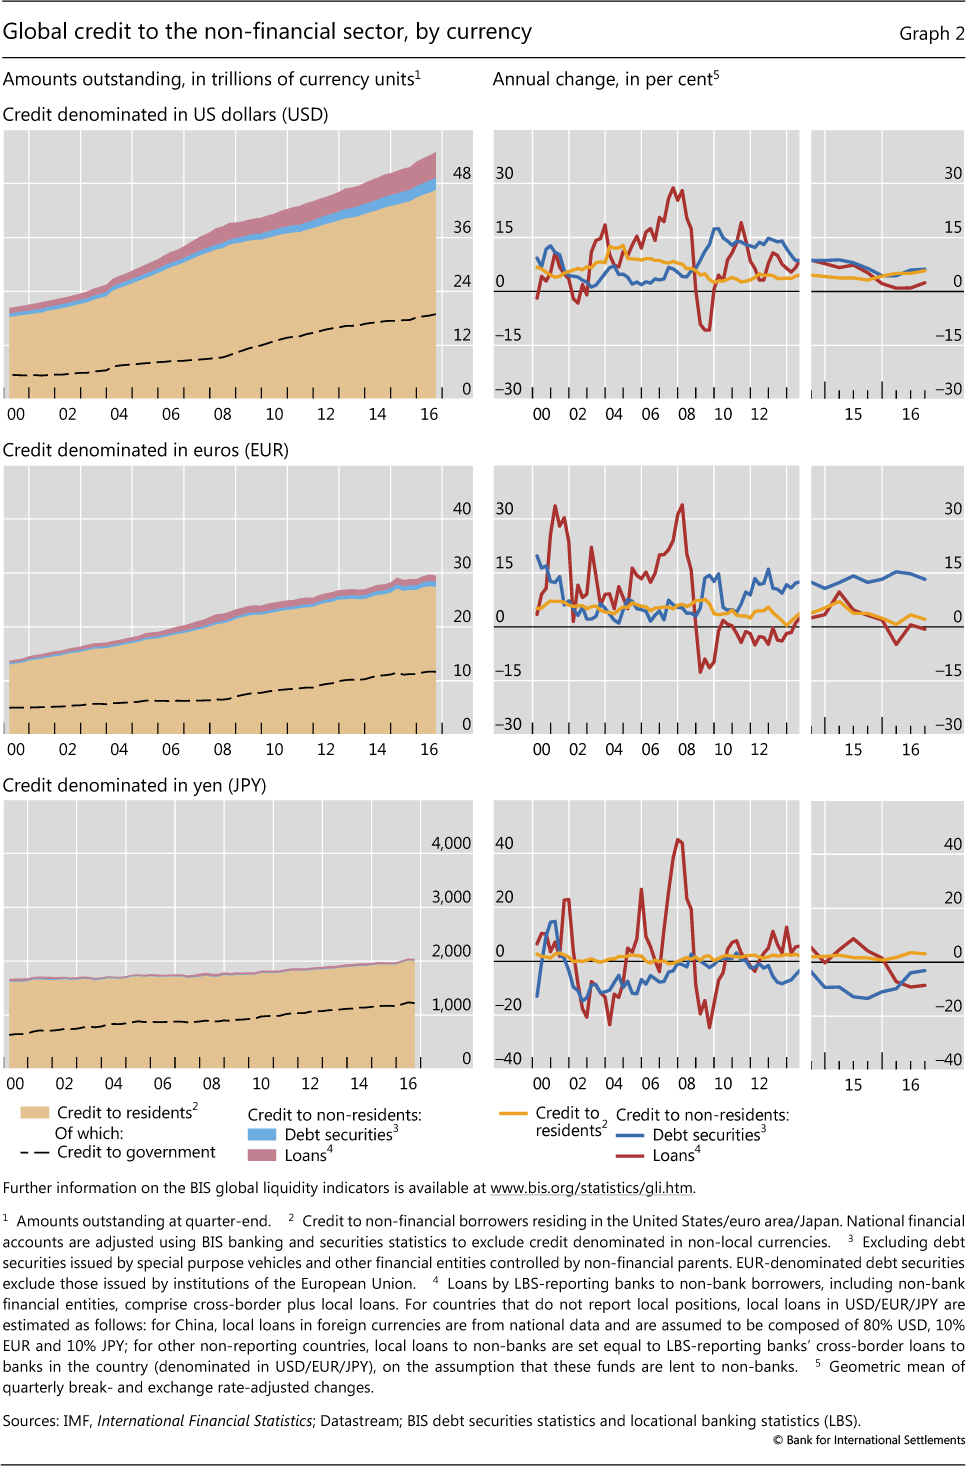
Yen-denominated credit to non-residents in the non- financial sector, for which overall amounts are much smaller than those of credit denominated in dollars or euros (¥37 trillion or $311 billion at end-September 2016), continued to decline on an annual basis. Net international debt securities issuance in yen started to recover, but the stock of outstanding securities still fell by 3.1% year on year (Graph 2, bottom panels).
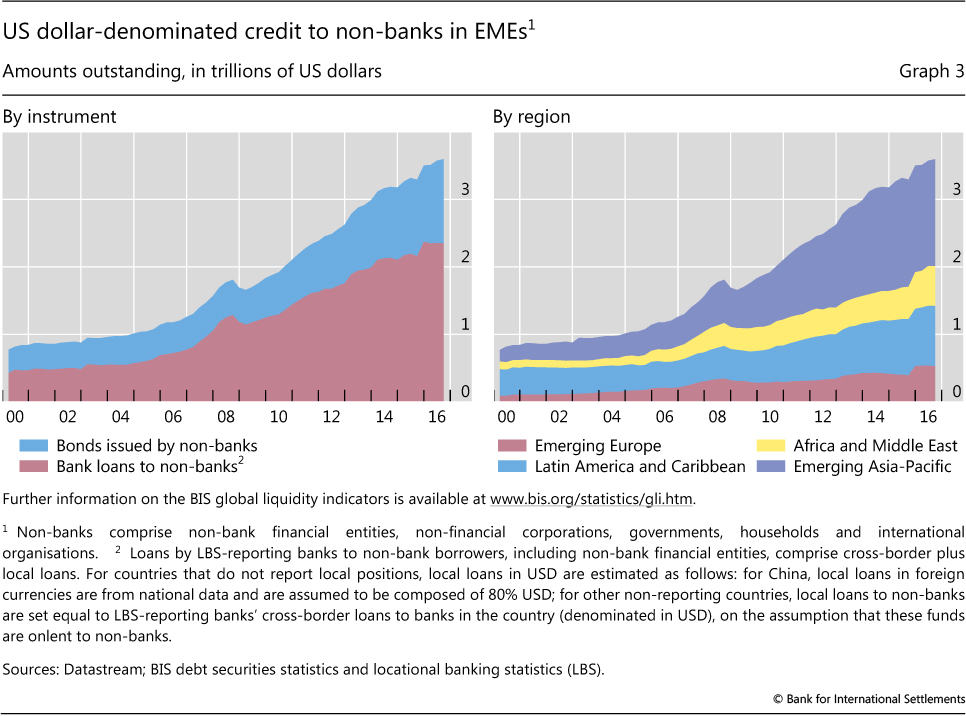
US dollar credit to non-banks in EMEs grew at a slow pace. While the turmoil in international financial markets in early 2016 led to a temporary decline in this aggregate in Q1 2016, the second and third quarters saw a combined increase of $87 billion, to $3.6 trillion at end-September 2016 (Graph 3, left-hand panel). Without the newly available data for China and Russia from the LBS, the total outstanding amount would have been $3.3 trillion. The trend increase since Q1 2016 would be about the same.
The moderate rise in dollar credit to EME non-banks in Q2 and Q3 2016 was almost entirely driven by debt securities issuance, as outstanding US dollar bank loans stayed essentially flat. Countries in Africa and the Middle East contributed more than half ($48 billion) of the increase (Graph 3, right-hand panel), led by oil-exporting countries in the Middle East. More than a third ($30 billion) went to borrowers in Latin America, and less than 20% ($17 billion) to emerging Asia. US dollar credit to emerging Europe declined by $8 billion during the second and third quarters of 2016.
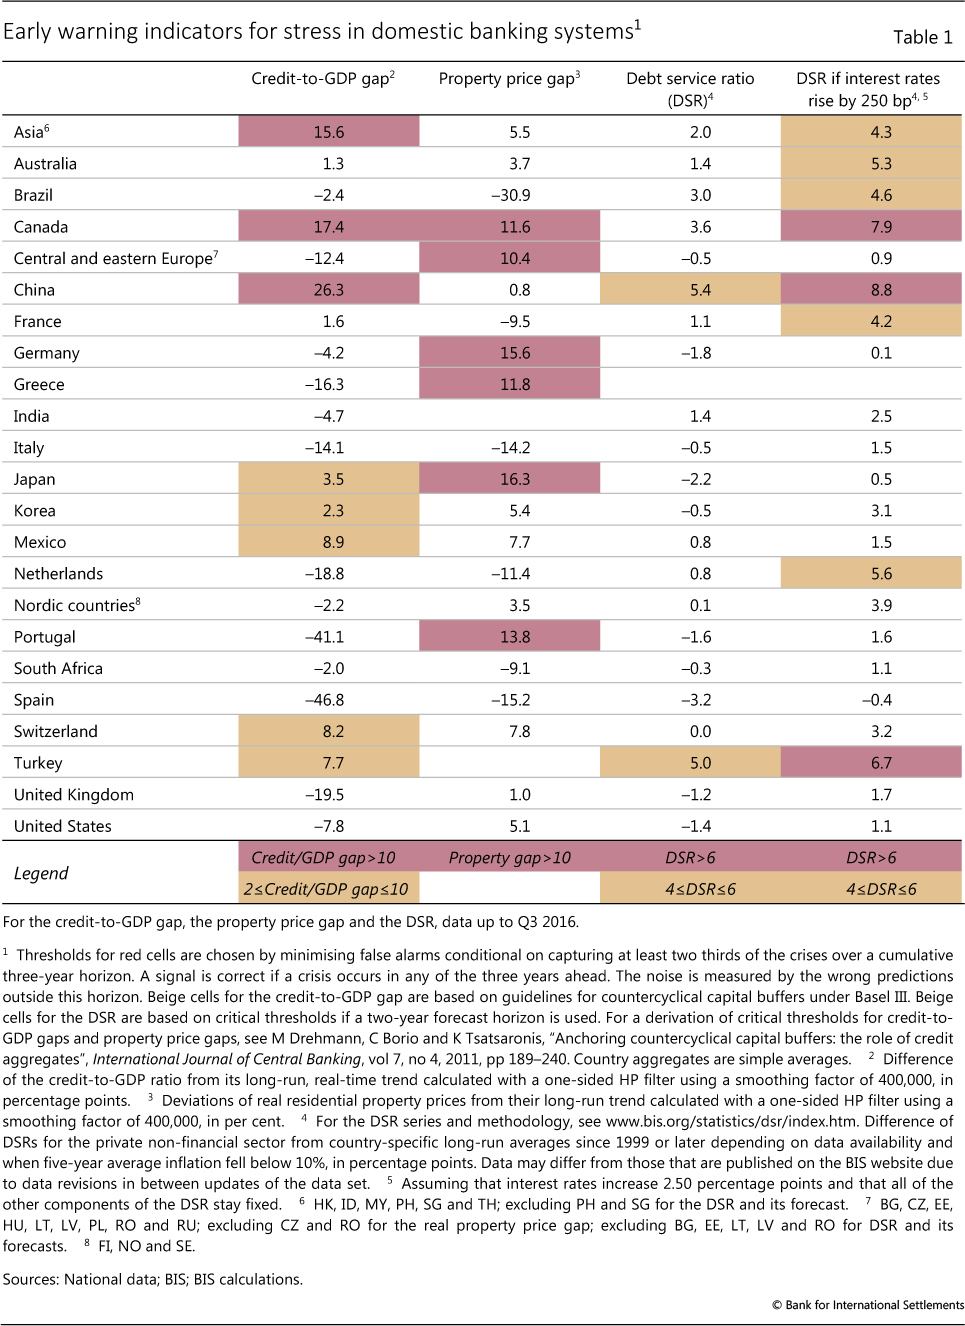
Early warning indicators for financial crises continue to signal vulnerabilities in several jurisdictions. Table 1 summarises the early warning indicators for domestic banking risks produced by the BIS, with data up to Q3 2016 for most countries.7 Relative to previous readings,8 the set of countries showing large and positive credit-to-GDP gaps remained the same (first column). The credit gap for China remained high at 26.3% of GDP, well above the threshold of 10%.9 Canada, as well as a group of Asian countries, saw increases in the credit gap since September 2016. The size of the property price gap (second column) remains in line with historical trends in many jurisdictions, with the exception of Canada, Germany, Greece, Japan, Portugal and a group of central and eastern European countries, for which the gaps remain relatively large. However, a high reading need not indicate accelerating price growth - for Greece, Japan and Portugal, the high property price gap does not necessarily indicate vulnerabilities, as it is driven by property price growth returning to normal levels after long periods of decline.
The last two columns of Table 1 present two alternative measures of debt service ratios, which aim to capture aggregate principal and interest payments in relation to income for the total private non-financial sector. For most countries, debt service ratios stand at manageable levels under the assumption of no change in interest rates (third column). Under more stressed conditions - a 250 basis point increase in rates - and assuming 100% pass-through, the numbers point to potential risks in Canada, China and Turkey (fourth column). However, the figures are meant to be only indicative, and are not the outcome of a proper stress test: a rise in rates would take time to translate into higher debt service. The degree of pass-through depends on the share of debt at floating rates, debt maturities and possible changes in borrowing behaviour.
Non-US banks' global dollar funding grows despite US money market reform
Despite the loss of dollar funding owing to money market mutual fund (MMMF) reform in the United States, non-US banks' aggregate US dollar funding rose to all-time highs in Q3 2016. In particular, deposits outside the United States have risen strongly, offsetting reduced funding from MMMFs. In aggregate at least, non-US banks are not suffering a dollar shortage as in 2008-09.
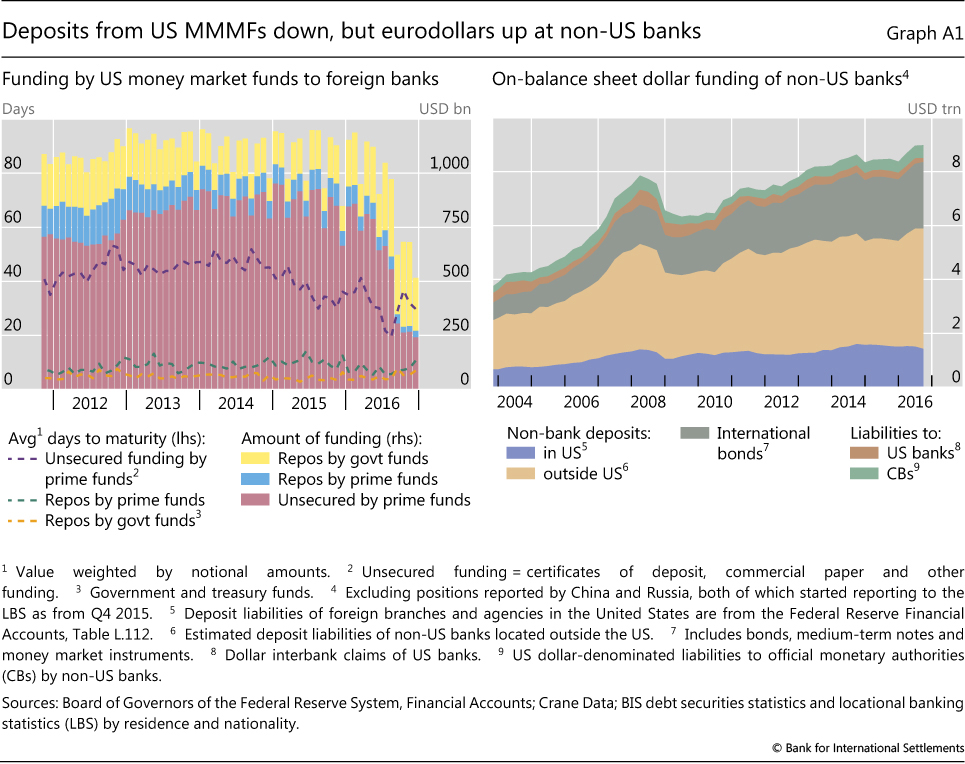
We estimate that the reform of institutional prime MMMFs, which formally took effect in October 2016, subtracted around $415 billion of dollar funding from non-US banks between September 2015 and December 2016. In some cases, including the largest institutional MMMF, fund sponsors converted such funds into "government-only" funds. In addition, fund investors switched from prime funds to existing government and Treasury-only funds. Both fund conversion and fund switching led to a shrinkage of prime funds' assets by $1.3 trillion over that period. Not all of this came at the expense of non-US banks' funding, given prime funds' investments in US-chartered banks and government paper, and government funds' investment in repos with non-US banks. In the five quarters to end-December 2016, non-US banks lost around $555 billion of US dollar funding from prime MMMFs, but gained approximately $140 billion in repo funding from government MMMFs (Graph A1, left-hand panel). This switch reduced the maturity of non-US banks' MMMF funding.
Based on this evidence, many analysts have concluded that non-US banks have suffered a shortage of dollar funding. However, taking a global perspective, up until Q3 2016, non-US banks saw a rise in their on-balance sheet dollar funding to $9.0 trillion (Graph A1, right-hand panel). (In addition to on-balance sheet funding, non-US banks also raise dollars by swapping foreign currency for dollars.) Despite the run-off of eurodollar deposits held by US MMMFs, offshore deposits in non-US banks actually rose by $531 billion to $4.5 trillion in the first three quarters of 2016. This is consistent with the $67 billion increase in customer deposits in foreign currency (mostly dollars) reported by Japanese banks in the seven months to end-October 2016. The increase in bids for eurodollars widened both the Treasury-eurodollar and the Libor-OIS spread, raising the cost of floating rate US dollar debt (see Graph 9 in "A paradigm shift in markets?", BIS Quarterly Review, December 2016). In addition, some well rated banks issued more long-term bonds in dollars. No aggregate dollar shortage is evident here.
The balance sheets of foreign branches and agencies in the United States shed further light on the adjustment of non-US banks to the funding shock. The loss of funding from US MMMFs shows up in the right-hand panel of Graph A2 as a decline of deposits and the net due to headquarters, the latter reflecting reduced eurodollar deposits by MMMFs in offshore branches, such as in the Cayman Islands. Foreign branches and agencies in the United States have by and large responded by running down their holdings of excess reserves at the Federal Reserve (Graph A2, left-hand panel). While cutting these low-yielding assets, foreign banks increased their more remunerative loans.
As background, recall that non-US banks had built up disproportionately large holdings at the Fed after 2011, when the widening of the FDIC assessment base under the Dodd-Frank legislation imposed a balance sheet charge on US-chartered banks. Consequently, US-chartered banks left it largely to foreign branches to "arbitrage" by taking funds from those unable to earn interest on their Fed balances, such as Fannie Mae and Freddie Mac, and holding these funds as excess reserves at the Fed. Since the return on these transactions was modest, about 15 basis points, it was widely and correctly predicted that holdings at the Fed would feel the brunt of the lost dollar funding.
By nationality of bank, the largest losers of deposits were Canadian and Japanese banks (Graph A2, right-hand panel). As "federal funds arbitrageurs", the Canadian banks repaid the money market fund placements by running down their holdings at the Fed and by drawing on funding from affiliates outside the United States. Japanese bank branches added more to their loans and other assets than Canadian banks and drew more funding from their affiliates abroad. As noted above, the consolidated foreign currency balance sheet of Japanese banks suggests that the ultimate source of this affiliate funding was customer deposits.
Overall, we find that non-US banks offset their loss of funding due to US MMMF reform by raising dollar deposits at offices outside the United States and by drawing down excess reserves at the Fed. With less cash, rising loans and the shift to short-term repo funding from MMMFs, foreign branches and agencies in the United States have extended the maturity of their portfolios and taken on more credit risk. However, they collectively still held $630 billion in reserves at the Fed at end-September 2016, a third of the total.

See "A paradigm shift in markets?", BIS Quarterly Review, December 2016, p 10. See H Nakaso, "Monetary policy divergence and global financial stability: from the perspective of demand and supply of safe assets", speech to the International Bankers Association of Japan, 20 January 2017. By contrast, see the decline in branch loans by European banks in R Correa, H Sapriza and A Zlate, "Liquidity shocks, dollar funding costs, and the bank lending channel during the European sovereign crisis", Board of Governors of the Federal Reserve System International Finance Discussion Papers, no 1059, 2012. See R McCauley and P McGuire, "Non-US banks' claims on the Federal Reserve", BIS Quarterly Review, March 2014, pp 89-97.
1 This article was prepared by Iñaki Aldasoro (Inaki.Aldasoro@bis.org) and Torsten Ehlers (Torsten.Ehlers@bis.org). Statistical support was provided by Kristina Bektyakova, Pamela Pogliani, and Matthias Loerch.
2 A description of the methodology used to construct the BIS GLIs is available at www.bis.org/statistics/gli/gli_methodology.pdf.
3 International bank credit as used in the BIS global liquidity indicators (GLIs) corresponds to the BIS locational banking statistics' definition. International bank credit captures banks' cross-border claims in all currencies and their local claims in foreign currencies, where local claims refer to credit extended by banks' affiliates located in the same country as the borrower. Quarterly changes are corrected for exchange rate effects and breaks in series.
4 The BIS defines international debt securities as securities issued by non-residents in all markets. For details, see B Gruić and P Wooldridge, "Enhancements to the BIS debt securities statistics", BIS Quarterly Review, December 2012, pp 63-76.
5 See K Goh and S Pradhan, "China and Russia join the BIS locational banking statistics", BIS Quarterly Review, December 2016, pp 25-6.
6 All currency conversions into US dollars are based on quarterly average exchange rates for the respective quarter.
7 These indicators aim to capture the potential for financial distress over the medium term. See "Highlights of global financing flows", BIS Quarterly Review, March 2016, p 28, for a discussion of the indicators and their interpretation.
8 See eg "Highlights of global financing flows", BIS Quarterly Review, September 2016, p 23.
9 In the past, two thirds of banking crises were preceded by credit-to-GDP gaps breaching this threshold during the three years before the event.