Statistical release: BIS international banking statistics and global liquidity indicators at end-March 2025

Key takeaways
- Global cross-border bank credit expanded by $1.5 trillion in the first quarter of 2025, reaching a record $34.7 trillion.
- The increase was driven by lending to non-bank financial institutions (NBFIs), whose annual growth rate rose to 14%.
- Cross-border bank credit to emerging market and developing economies (EMDEs) expanded by $100 billion.
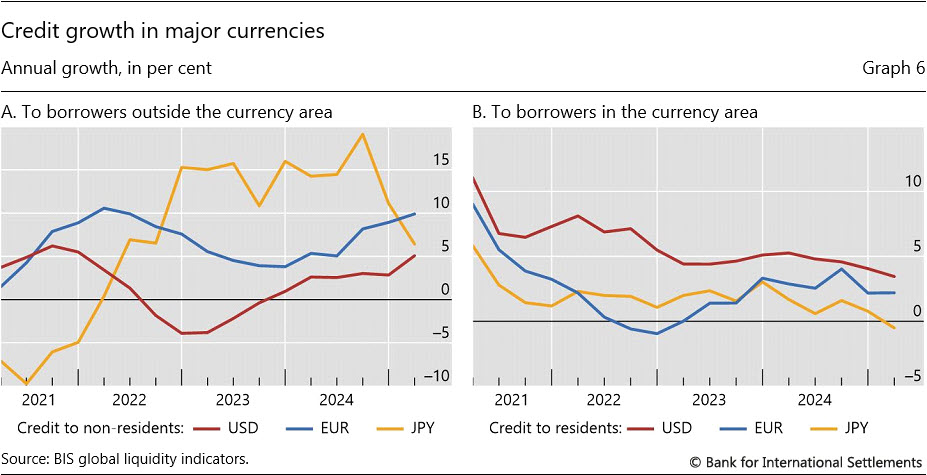
- The BIS global liquidity indicators show that foreign currency credit in dollar, euro and yen grew respectively by 5%, 10% and 6% year-on-year at the end of the first quarter of 2025.
Cross-border bank credit reached new heights
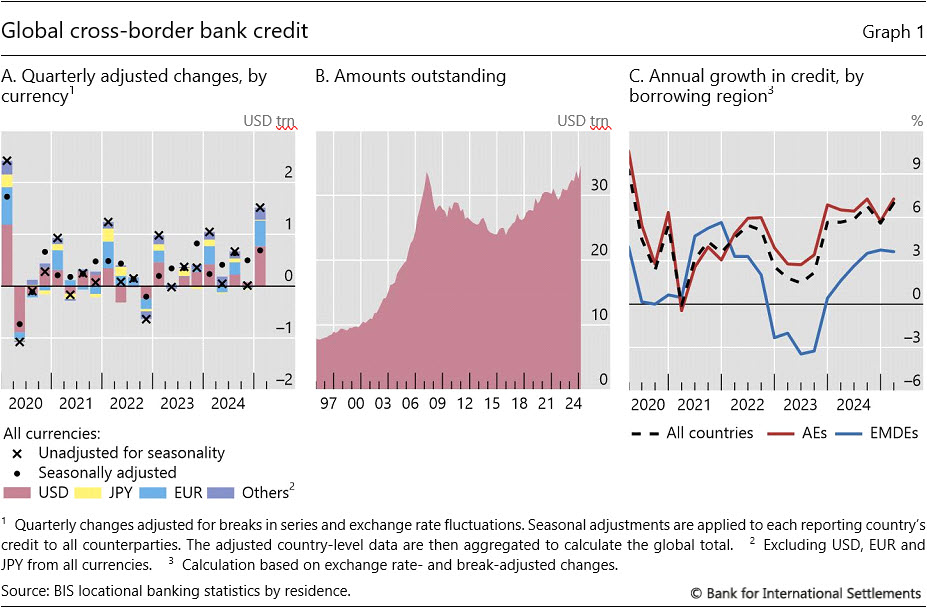
The BIS locational banking statistics (LBS) show a significant expansion in cross-border bank credit1 in Q1 2025. The increase was $1.5 trillion, adjusting for exchange rates and breaks in series, and $0.7 trillion when accounting for seasonal effects (Graph 1.A). The increase in credit during this quarter was denominated mainly in US dollars ($0.8 trillion) and euros ($0.5 trillion). At end-Q1 2025, the global stock of cross-border bank credit stood at $34.7 trillion, surpassing the pre-Great Financial Crisis peak ($33.6 trillion) (Graph 1.B).2
The latest increase in cross-border bank credit pushed up its year-on-year growth rate to 7% (Graph 1.C). It was primarily driven by credit to borrowers located in advanced economies (AEs), whose stock reached $28.1 trillion at end-Q1 2025.
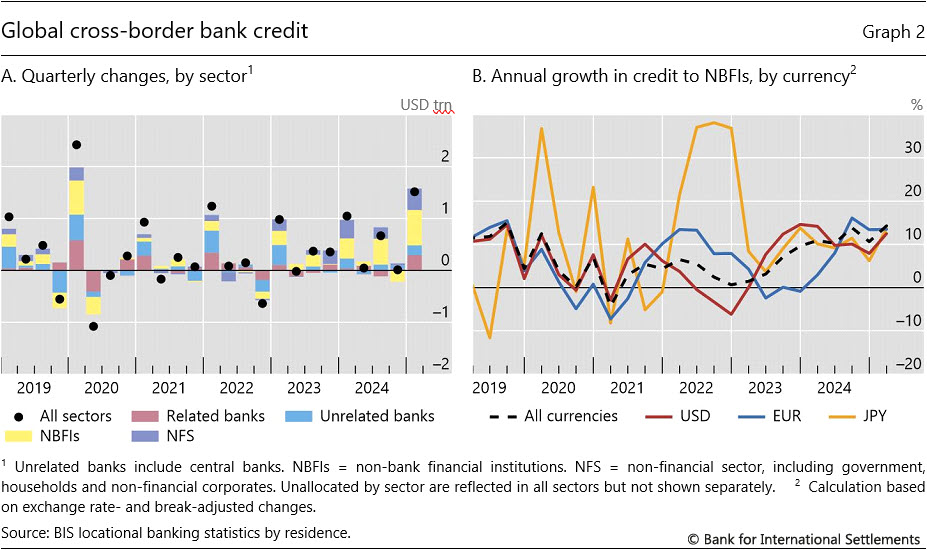
The bulk ($678 billion) of the increase went to non-bank financial institutions (NBFIs) (Graph 2.A). The year-on-year growth in credit to NBFIs rose to 14% at end-Q1 2025, the highest since Q3 2019 (Graph 2.B). Growth rates at end-Q1 2025 were roughly even across US dollar, euro and yen credit. Nevertheless, dollar positions, which account for the bulk of global lending to NBFIs, were the main drivers of the latest overall quarterly increase.
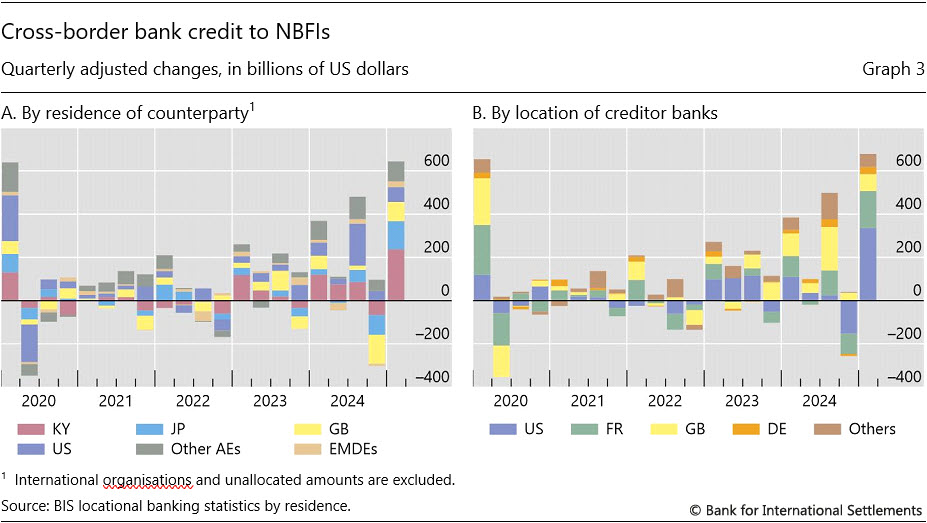
Most of the Q1 2025 increase in bank credit to NBFIs occurred among major advanced economies and financial centres. About two thirds of the global increase ($456 billion) went to NBFIs located in the Cayman Islands ($237 billion), Japan ($131 billion) and the United Kingdom ($88 billion) and only $26 billion went to NBFI borrowers in EMDEs (Graph 3.A). The vast majority ($585 billion) of the global increase came from banks located in three AE jurisdictions: the United States, France and the United Kingdom (Graph 3.B).
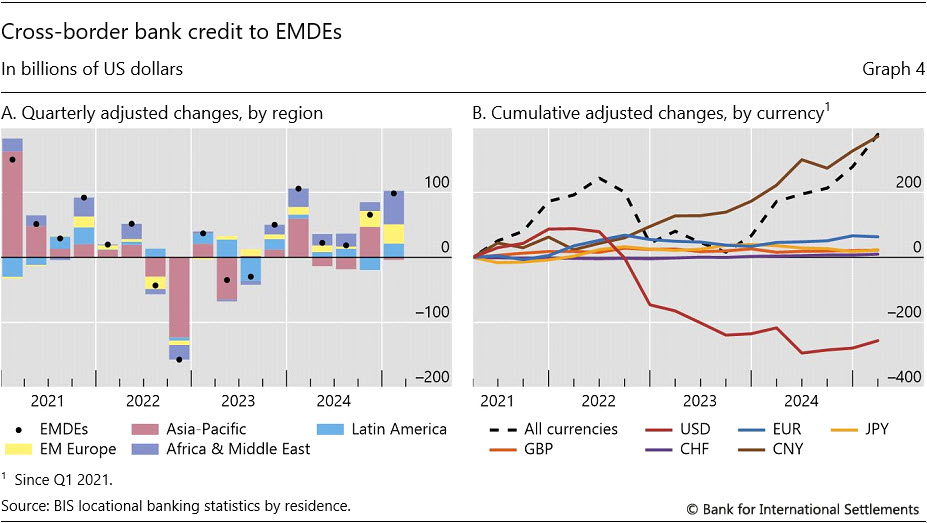
Cross-border bank credit to EMDEs continued to expand (Graph 4.A). It rose by $100 billion in Q1 2025, with its outstanding stock increasing to $5.9 trillion. The largest expansion ($52 billion) was vis-à-vis borrowers in Africa and the Middle East (Graph 4.A). Borrowers in emerging Europe and Latin America saw increases of $30 billion and $21 billion, respectively. Meanwhile, credit to borrowers in the Asia-Pacific region declined by $2 billion.
A large part of the expansion of cross-border bank credit to EMDEs in Q1 2025 was denominated in the Chinese renminbi ($45 billion).3 This was almost entirely due to an expansion in renminbi credit ($44 billion) to borrowers in Asia-Pacific, which was largely offset by a contraction in dollar credit (–$40 billion) to those borrowers. Borrowers in other EMDEs saw an expansion in dollar credit ($63 billion), while renminbi credit remained virtually unchanged.
This continued a pattern of increased lending denominated in renminbi over recent years. The cumulative expansion in renminbi cross-border bank credit to EMDE borrowers (mainly in the Asia-Pacific region) since Q1 2021 reached $373 billion in Q1 2025, amid a cumulative decline in dollar credit amounting to $257 billion over the same period (Graph 4.B). The year 2022 marked a turning point away from dollar- and euro-denominated credit and towards renminbi-denominated credit, corresponding to the monetary tightening cycles in the United States and the euro area.
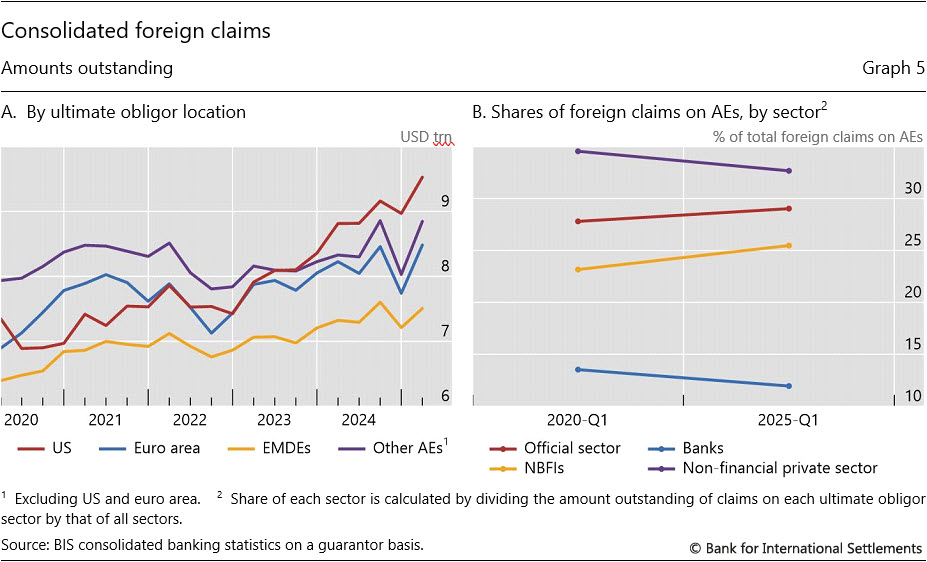
Since 2020, consolidated bank exposures4 to AEs rose considerably. The most notable expansion was vis-à-vis the United States. Foreign claims5 – those on borrowers outside of the bank's country of headquarters – where the ultimate obligor was from the United States have risen from $6.9 trillion in mid-2020 to $9.5 trillion at end-Q1 2025 (Graph 5.A). Over this same time span, the counterparty sector composition of foreign claims on AEs has been shifting away from banks and private non-financial borrowers (falling by 2 percentage points each) and towards the NBFI and official sectors (rising by 2 and 1 percentage points, respectively).6
Global liquidity indicators at end-March 2025
The BIS global liquidity indicators track total credit to non-bank borrowers, covering both loans extended by banks and funding from international bond markets. This is broader than the bank credit considered in the previous section. International bond funding is captured through the net issuance (gross issuance less redemptions) of international debt securities. The focus is on foreign currency credit denominated in the three major reserve currencies (US dollar, euro and Japanese yen) to non-residents, ie borrowers outside the respective currency areas.
Foreign currency credit saw elevated or rising growth rates. Year-on-year growth in foreign currency dollar credit (ie to borrowers outside the United States) was 5% as of Q1 2025 (up from 3% posted the previous quarter), reaching $13.7 trillion. The comparable figures for euro and yen stood at 10% (reaching €4.6 trillion) and 6% (reaching ¥65.6 trillion), respectively (Graph 6.A). While the growth rates of dollar and euro foreign currency credit have been rising since 2023, the growth rate of yen credit outside of Japan, though still robust, has been falling since Q3 2024. The yen slowdown came after the start of monetary tightening in Japan and the August 2024 carry trade unwinding, following growth rates of well over 10% during the preceding two years.
The year-on-year growth rates of credit to residents of the respective currency areas were considerably lower than their non-resident (foreign currency) counterparts and trending down. Dollar credit to US residents remained positive at 3% (at end-Q1 2025) but continued a declining trend seen over the past four years (Graph 6.B). Euro credit growth within the euro area also remained low (2%), while growth in yen credit to borrowers in Japan dipped just below 0%.
1 In the BIS LBS, bank credit comprises (i) loans and deposits; and (ii) holdings of debt securities. Bank claims further include (iii) derivatives with a positive market value and other residual instruments (combined), which declined by $0.7 trillion in Q1 2025, primarily driven by banks in Germany and France.
2 This is the highest amount recorded in the BIS banking statistics. The pre-Great Financial Crisis peak (reached at end-Q1 2008) was first met at end-Q3 2024 ($33.8 trillion).
3 14 jurisdictions, including China, Hong Kong SAR, Macao, Korea and Australia, report renminbi-denominated claims.
4 The BIS consolidated banking statistics measure banks' country risk exposures comprising foreign claims, derivatives, guarantees extended and credit commitments. They capture the worldwide consolidated positions of banks headquartered in BIS reporting countries, including positions of their foreign affiliates but excluding intragroup positions.
5 In the consolidated banking statistics, the published statistical tables use the term "claims", which comprise mainly deposits, loans and holdings of debt securities, but exclude derivatives with a positive market value. The stocks are not adjusted for breaks in series and exchange rate movements.
6 See Chapter II of the 2025 BIS Annual Economic Report for further discussion of the increasing role of NBFIs in the financial system and rising credit to governments.