Statistical release: BIS international banking statistics and global liquidity indicators at end-March 2023

Key takeaways
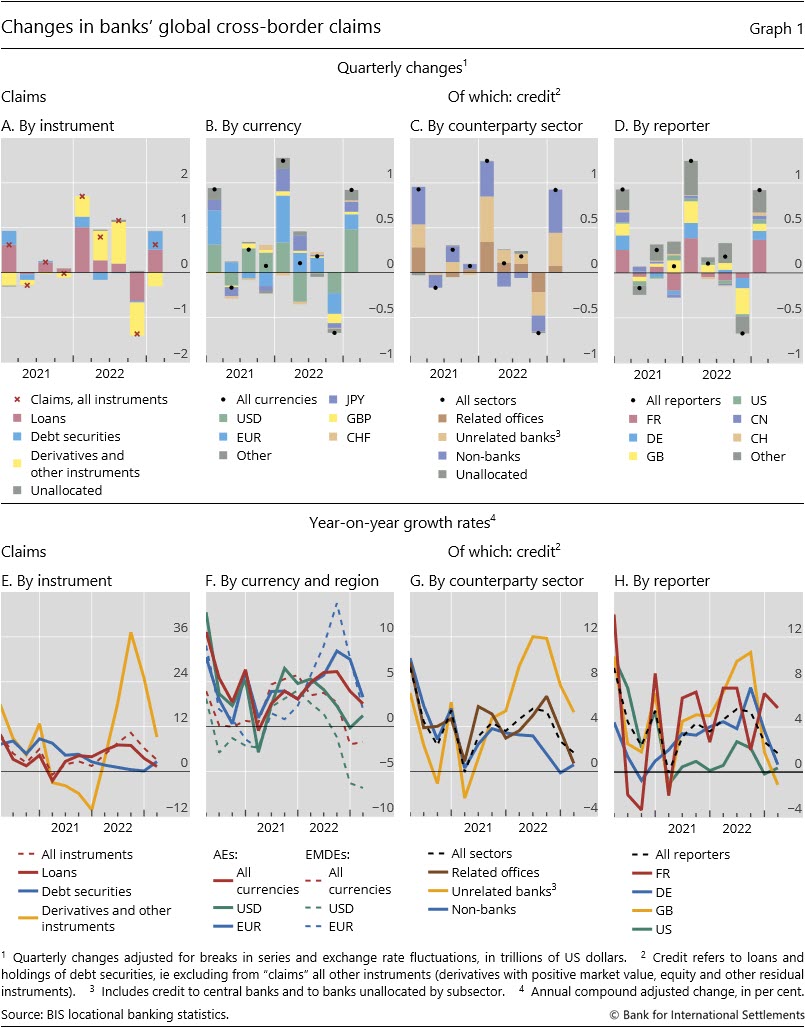
- In Q1 2023, global cross-border claims rose by $619 billion and credit (ie loans and holdings of debt securities) by $921 billion, due mainly to seasonal factors.
- Against the backdrop of rising global interest rates, the year-on-year (yoy) growth in cross-border credit has slowed over the past few quarters, falling to 2% by Q1 2023. Credit to advanced economies (AEs) expanded yoy while that to emerging market and developing economies (EMDEs) contracted.
- Banking sector strains that came to a head in March 2023 have had a limited impact on cross-border deposits, with only banks in Switzerland and the United Kingdom reporting outsize outflows.
- The BIS global liquidity indicators (GLIs) show that foreign currency credit denominated in US dollars contracted yoy, while that denominated in euro expanded but at a slower rate. These developments are in line with rising funding costs and the strength of the respective currencies.
Global cross-border credit rose in Q1 2023
The BIS locational banking statistics (LBS) show that banks' global cross-border claims rose by $619 billion during the first quarter of 2023, with the stock reaching $37 trillion for the first time (Graph 1.A and Annex Graph A.1).1 The quarterly rise reflected an increase in bank loans (+$507 billion) and debt securities (+$414 billion), offset in part by a $309 billion drop in the market value of derivatives and other instruments (Graph 1.A). However, seasonal factors appear to have played an outsize role in these developments (see below); looking at yoy growth rates instead reveals a third consecutive quarterly slowdown in the growth of cross-border claims against a backdrop of rising interest rates and dollar strength (Graph 1, lower panels).
Cross-border bank credit in all major currencies expanded in Q1 2023 (Graph 1.B). Yet, on a yoy basis, dollar credit growth remained slow, weighed down by falling credit to EMDEs, at –7% (Graphs 1.F and 2.D). In fact, dollar credit growth has been losing momentum since mid-2022 after the Federal Reserve began to raise interest rates, while yoy growth in euro credit started to slow in late 2022, after the ECB started its tightening cycle (Graph 1.F). All in all, growth in cross-border credit overall has remained positive, ending the latest quarter at 2% yoy.
Cross-border credit to all sectors grew in Q1 2023 (Graphs 1.C and 1.G), with credit to non-banks expanding the most. Credit to non-bank financial institutions (NBFIs), in particular, has expanded steadily in recent years along with their growing heft in the global financial system. By Q1 2023, NBFIs' share in global bank cross-border credit reached 22%.
Dollar credit to emerging economies continues to decline
The bulk ($866 billion) of the Q1 2023 increase in cross-border credit went to AEs (Graph 2). Cross-border credit to the United States and the Cayman Islands accounted for more than half of that amount (Graph 2.A). The consolidated banking statistics (CBS), which aggregate worldwide claims by banking system, indicate that a rise in French and Japanese banks' reported foreign claims on the US official sector drove the Q1 increase in cross-border credit to the United States.2
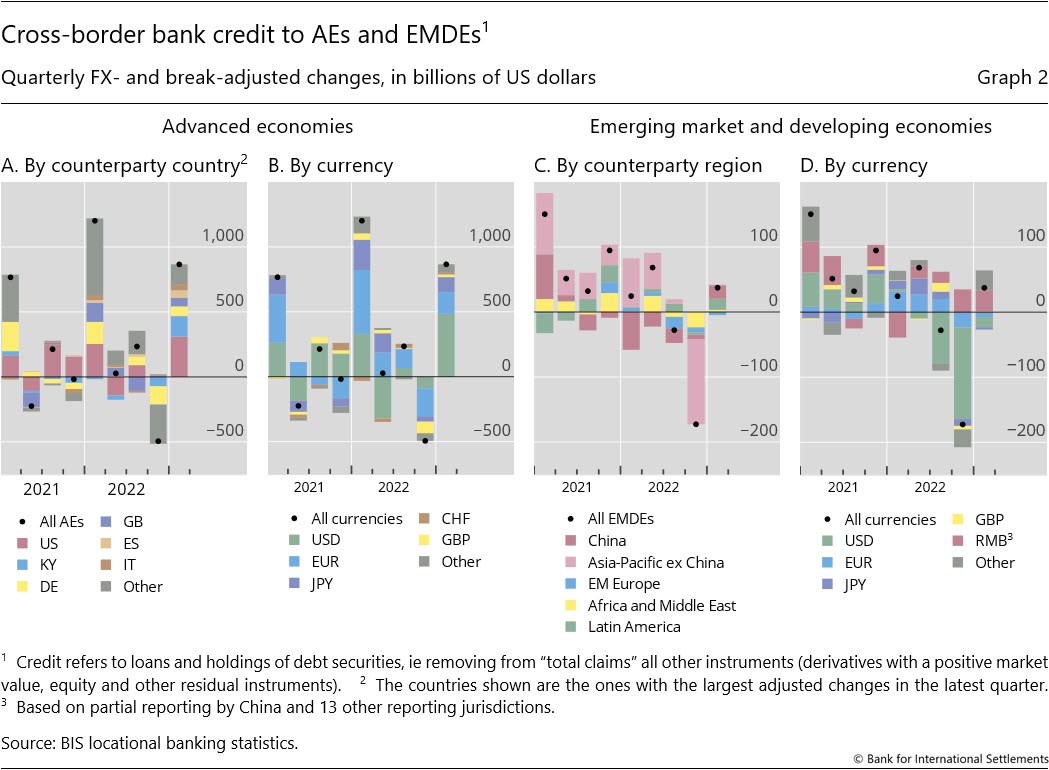
Against a longer trend decline in dollar credit, cross-border credit to EMDEs edged up in Q1 2023. Credit increased the most to China and Korea while the largest drops were vis-à-vis Singapore and Saudi Arabia. Lending in Chinese renminbi (RMB) grew while credit in dollar, euro and yen continued to drop (Graph 2.D). Dollar credit, in particular, has been falling sharply over the past four quarters, by $245 billion (or by 7% yoy, at end-Q1 2023) (Graph 1.F). Over the same period, credit in renminbi expanded by more than $100 billion (red bars), mostly in the form of regional credit to China, Hong Kong SAR and Macao SAR.3
Seasonal factors drive large quarterly changes in Q1
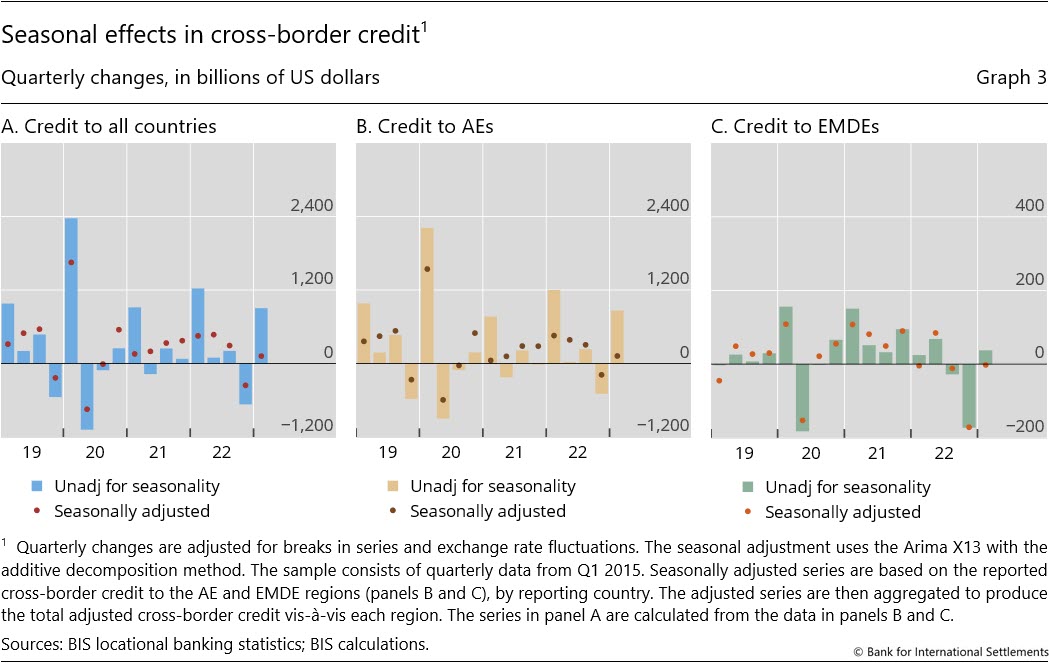
The rise in global cross-border credit in Q1 2023 was mainly the result of seasonal factors inherent to several large banking systems. This regularly occurs at year-ends, when banks in some jurisdictions reduce their positions only to expand them again in the following quarter (Graph 1.D).4 Removing these seasonal effects lessens the fluctuations in cross-border credit (from the bars to the dots in Graph 3). Such seasonal effects accounted for as much as 80% of the expansion registered in Q1 (Graph 3.A). The remaining amount was due to other factors and went mostly to AEs (Graph 3.B).
Deposit flows amidst recent banking strains
The banking strains of March 2023 in the context of global monetary tightening also left a mark on the BIS international banking statistics. Several US regional banks failed following depositor runs triggered by losses on long-maturity government securities. In Europe, the strains appear to have peaked in late March, when Credit Suisse was taken over by UBS, Switzerland's other global systemically important bank.5
In the United States, the strains appear to have had a limited impact on banks' cross-border funding. National data show deposit outflows from small domestic banks in Q1 2023 (Graph 4.A, blue bars). That said, large banks also saw deposit outflows before the March 2023 turmoil (red bars), likely reflecting the pull from higher returns offered by money market funds (MMFs).6 Yet, these developments remained largely contained: cross-border deposits held with banks in the United States have remained stable in aggregate over the past year (Graph 4.B).
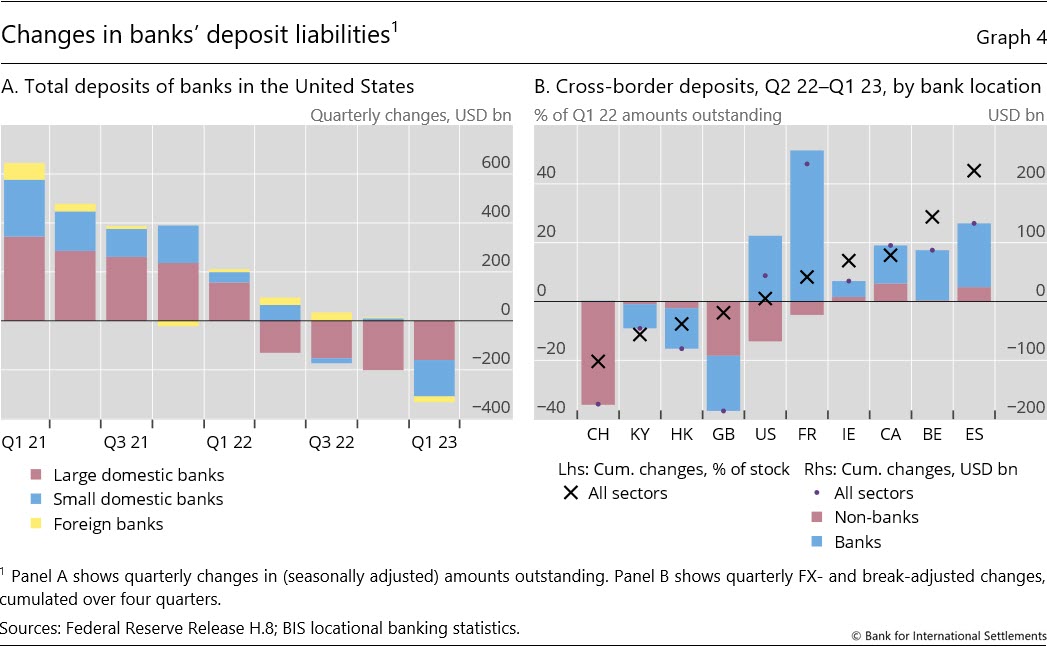
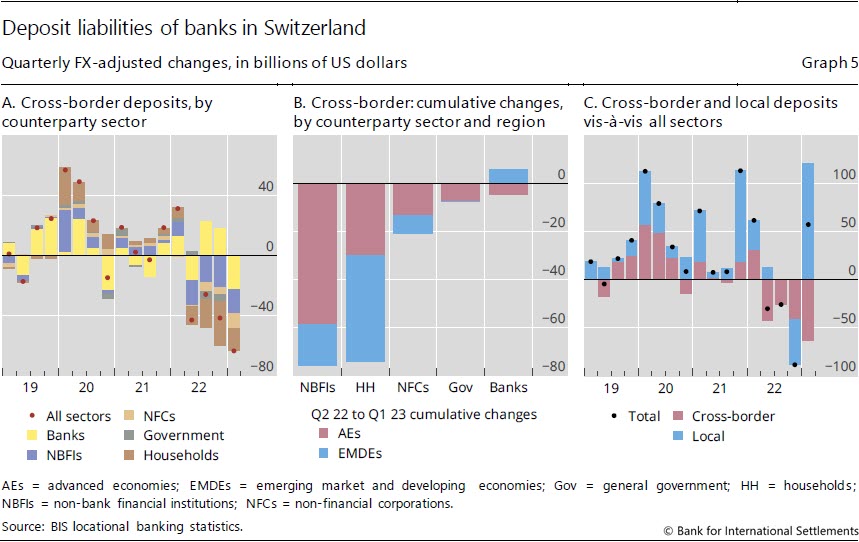
There are few signs across BIS-reporting jurisdictions of generalised cross-border deposit outflows (Graph 4.B). If anything, banks in several major economies experienced deposit inflows over the past year, including banks in the euro area.7 Most inflows were interbank deposit placements. By contrast, deposits placed by non-banks proved to be less stable. Indeed, banks in the United Kingdom and in Switzerland lost deposits worth 4% and 20% of the respective totals; the latter coincided with the growing strains at Credit Suisse.8 For banks in Switzerland, households and NBFIs abroad played an important role in these developments (Graph 5.A). Most notably, households in EMDEs withdrew as much as $44 billion over the past year (Graph 5.B). Local deposits (Graph 5.C, blue bars) began to decline only in Q4 2022. The loss of deposits was counterbalanced by forceful liquidity measures by the Swiss National Bank in support of an orderly takeover of Credit Suisse.
Global liquidity indicators at end-March 2023
The BIS global liquidity indicators (GLIs) track credit to non-bank borrowers, covering both loans extended by banks and funding from global bond markets through the issuance of international debt securities (IDS). The main focus is on foreign currency credit denominated in three major reserve currencies (US dollars, euros and Japanese yen) to non-residents, ie borrowers outside the respective currency areas.9
Global foreign currency credit in the three major currencies rose slightly in Q1 2023. The quarterly increase of $79 billion in US dollar credit to non-banks outside the United States left the outstanding stock at $12.9 trillion (Graph 6.A, solid red line). Even so, the yoy growth rate remained firmly negative (Graph 6.B, solid red line). Euro-denominated credit to non-banks outside the euro area also lost momentum (Graph 6, blue solid lines), bringing the stock to €4 trillion, 5.5% higher than the year before. In contrast, yen credit outside Japan continued to expand at a rapid pace (yellow line).
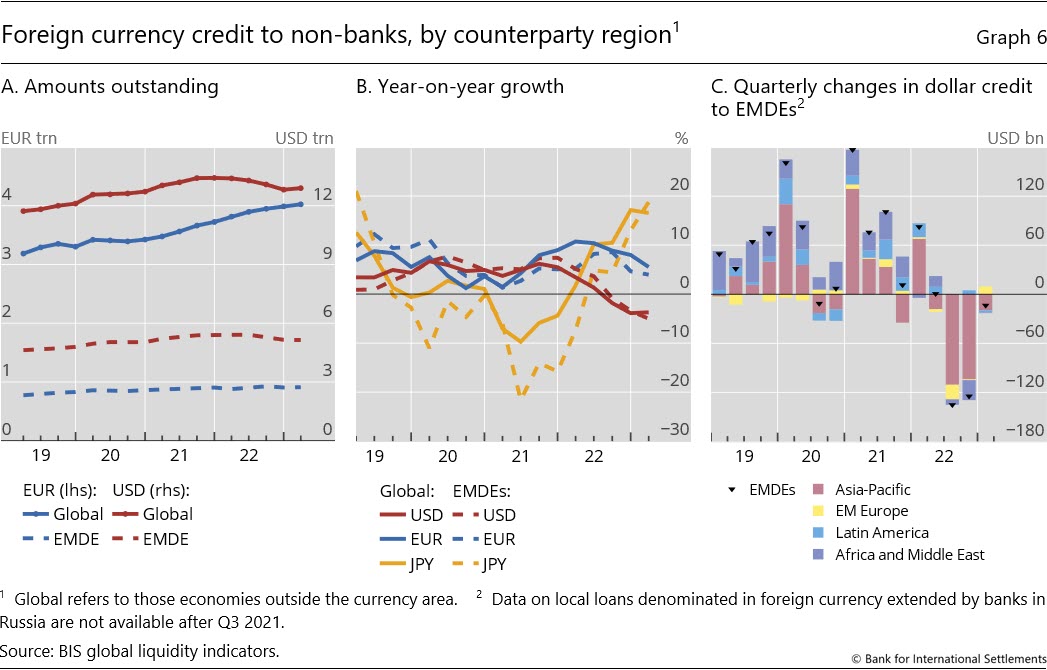
Foreign currency credit to non-banks in EMDEs remained fairly steady in Q1 2023 (Graph 6.A, dashed lines). Dollar credit inched down while euro credit rose slightly, leaving the respective stocks at $5.1 trillion and €0.9 trillion. Yet the yoy growth rates for dollar and euro credit continued to decline, with dollar credit shrinking at an annual rate of 5%. By contrast, the growth in yen credit accelerated further due to brisk bank lending (Graph 6.B, dashed lines).
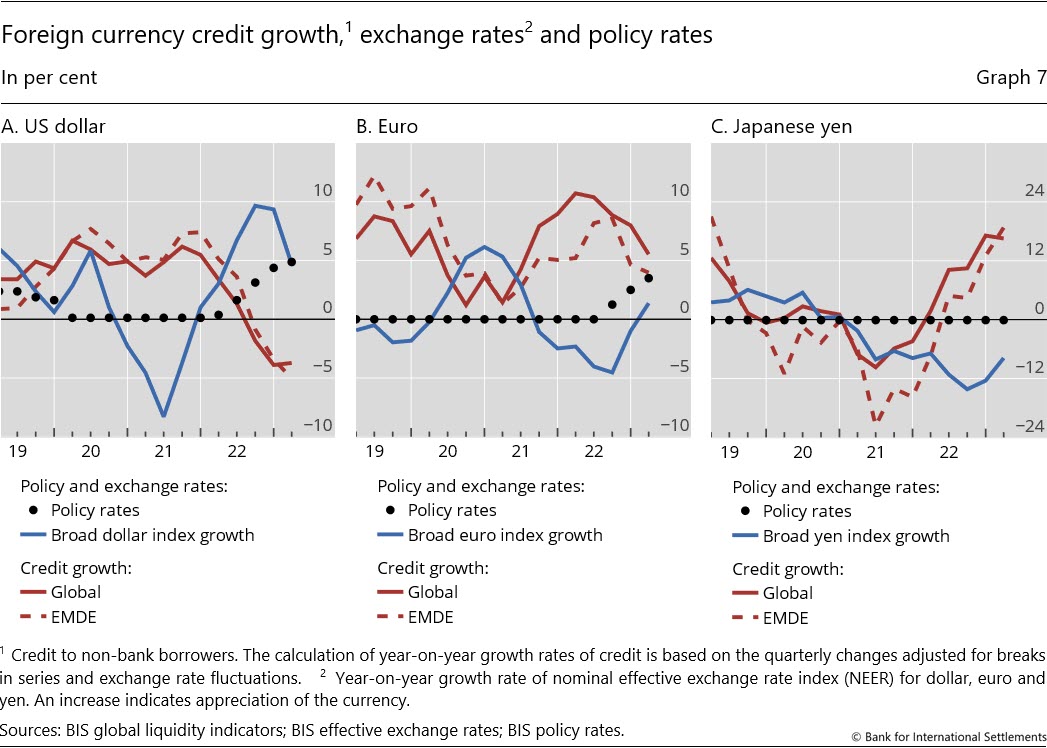
The divergence in global foreign currency credit growth across the three major currencies continues to reflect their respective funding costs and associated exchange rate movements. The growth in dollar- and euro-denominated credit has fallen as interest rates rose and the respective currencies strengthened (Graphs 7.A and 7.B, solid lines).10 This pattern was more pronounced for credit to EMDEs (dashed lines). Even as the pace of US tightening slowed in 2023, US funding rates and the dollar index remained elevated, resulting in tight financial conditions. By contrast, the Bank of Japan's continued monetary easing contributed to the sustained increase in yen-denominated credit growth (Graph 7.C).
1 In the BIS locational banking statistics, claims comprise: (i) loans and deposits; (ii) holdings of debt securities; and (iii) derivatives with a positive market value and other residual instruments (combined). Credit is defined as the sum of (i) and (ii).
2 In the LBS, Japan does not report a complete sectoral breakdown of cross-border claims on the non-financial sector. Japan does report a complete breakdown of foreign claims in the CBS.
3 The coverage of renminbi positions in the BIS international banking statistics is incomplete, since only 14 reporting countries break out the Chinese currency.
4 Most reporting banks' fiscal year closes at the end of the calendar year. Some, however, have their fiscal year-end at end-March (eg Japanese banks).
5 See BIS Annual Economic Report, 2023, Chapter I, www.bis.org/publ/arpdf/ar2023e1.htm.
6 Federal Reserve Bank of New York research shows that the use of MMFs rises along with interest rate increases, since the interest rates paid by MMFs to their investors adjust faster than those of bank deposits. See G Afonso, M Cipriani and G La Spada, "Banks' Balance-Sheet Costs, Monetary Policy, and the ON RRP", Federal Reserve Bank of New York, Staff Reports, no 1041, December 2022.
7 On the domestic side, the ECB bank lending survey for Q1 2023 finds that outflows from overnight deposits shifted into term deposits owing to the stronger interest rate increases for term deposits.
8 For more on deposit outflows from Credit Suisse, see Financial Times, 24 April 2023 and Credit Suisse Q1 2023 results. On liquidity assistance and other analysis, see Swiss National Bank, Financial Stability Report, June 2023.
9 For more details, see the GLI methodology: www.bis.org/statistics/gli/gli_methodology.pdf.
10 See the previous GLI Statistical Release. Rapid US monetary policy tightening in 2022 led the value of the US dollar to peak in September 2022, making it expensive relative to other major currencies and depressing dollar-denominated foreign currency credit. Euro credit started to reflect rising rates and higher valuations only later in 2022, while the Bank of Japan's commitment to monetary easing and protracted depreciation have made the yen a preferred funding currency.