BIS international banking statistics and global liquidity indicators at end-March 2021

Key takeaways
- Banks' cross-border claims increased by $646 billion during the first quarter of 2021, to reach $36 trillion. Their year-on-year (yoy) growth rate stood at -0.6%.
- The growth in claims on advanced economies was again strong in the first quarter (+$460 billion). Greater claims on borrowers in the euro area, United States and Japan was partially offset by a drop on those in the United Kingdom.
- Claims on emerging market and developing economies rebounded in the first quarter, driven by lending to the Asia and Pacific region.
- Banks' claims on the official sector, which comprises governments and central banks, reached 27% of their total claims in Q1 2021, up from 22% at end-2019.
- Foreign currency credit growth, an indicator of global liquidity, held up for credit dominated in US dollars, but weakened for euro- and yen-denominated credit. Bank lending declined for all three currencies against the backdrop of strong bond issuance in dollars and euros.
Bank claims on advanced economies rise in Q1 2021
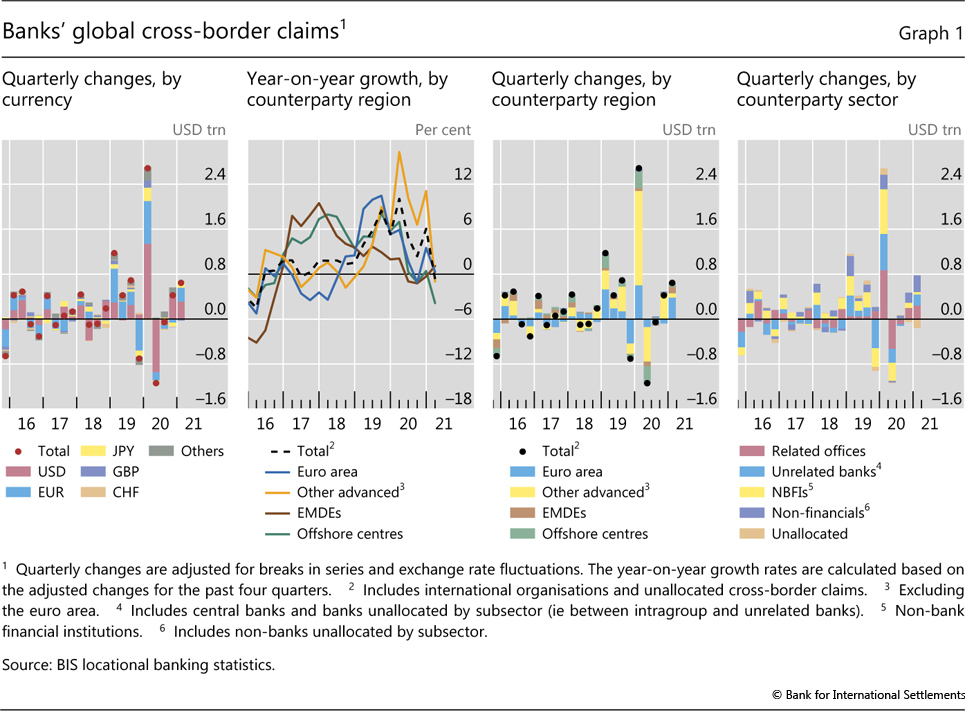
The BIS locational banking statistics (LBS) show that internationally active banks' cross-border claims rose by $646 billion during the first quarter of 2021 (on an FX- and break-adjusted basis), following strong growth in the previous one. A seasonal component in cross-border positions, whereby claim stocks fall at end-year and then rebound in the first quarter, may have contributed.1 Despite the two consecutive quarterly expansions, the year-over-year (yoy) growth rate at end-Q1 stood at -0.6% due to the outsized $1.1 trillion contraction in Q2 2020 (Graph 1, second panel).2
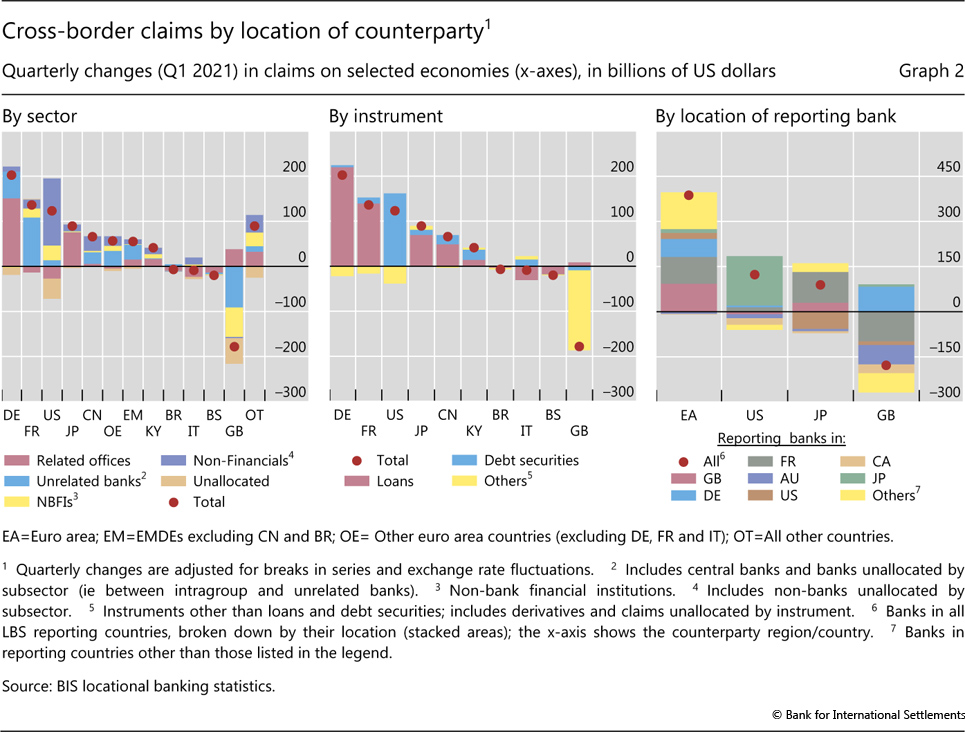
The growth in cross-border claims on advanced economies (AEs) was again strong in the first quarter, up $460 billion following a $351 billion increase in Q4 2020 (Graph 1). This mainly reflected a marked rise in claims on the euro area, the first such increase since the outbreak of the pandemic (third panel). Claims on Germany and France rose the most, by $202 and $136 billion respectively, mainly the result of greater interbank loans (to related offices and unrelated banks) (Graph 2). By contrast, lower interbank claims on Italy drove a $9 billion decrease in claims on the country.
Cross-border claims on other major AEs rose as well in the first quarter. Banks in Japan reported greater holdings of debt securities issued by non-financials in the United States, driving the overall $123 billion increase in claims on that country (Graph 2).3 Similarly, banks in France channelled funds to their offices in Japan, driving the $89 billion increase on that country.
By contrast, claims on the United Kingdom dropped sharply, by $178 billion (−5% yoy) (Graph 2). This was the result of lower claims on banks and non-bank financials in the country reported under "other instruments", which captures mainly derivatives and equity holdings.4 This was reported by banks in several countries (Graph 2, right-hand panel), and followed an outsized expansion banks' derivatives positions a year earlier.5
Cross-border claims on EMDEs expand, driven by credit to Asia-Pacific
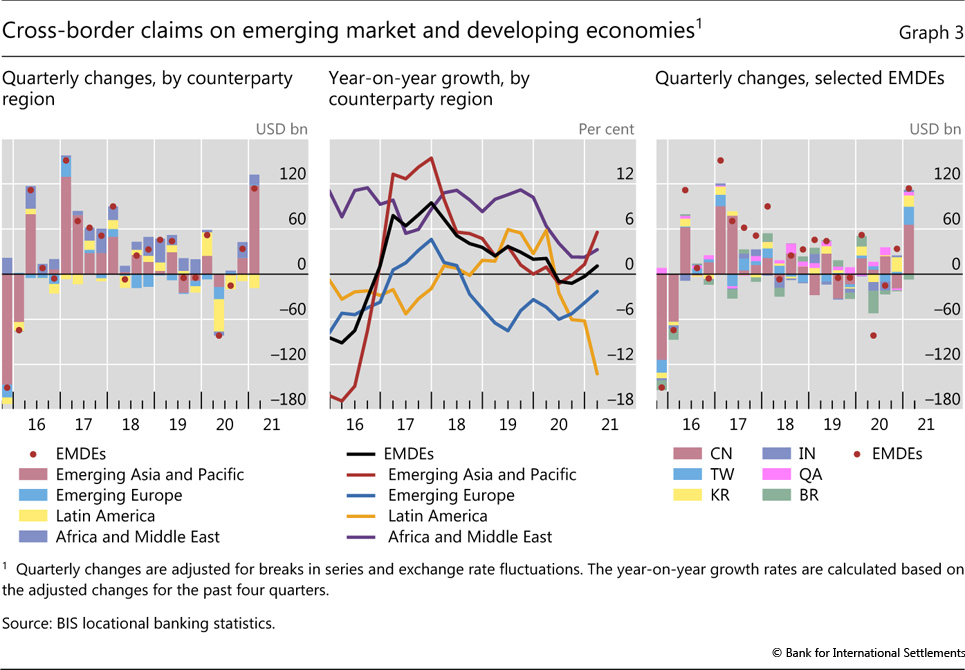
Banks' cross-border claims on emerging market and developing economies (EMDEs) surged in Q1 2021, driven by lending to the Asia and Pacific region. Overall, claims grew by $114 billion - the largest rise since Q1 2017 - with increases observed vis-à-vis three of the four EMDE regions (Graph 3, left-hand and centre panels). This pushed the yoy growth rate of claims on EMDEs back into positive territory (+1.1%).
Cross-border claims on the Asia and Pacific region rose the most, by $118 billion, the largest increase since 2017. This mainly reflected a sharp $66 billion rise in claims on China, by far the largest amongst EMDE borrowers (Graph 3, right-hand panel). Reporting banks in France, Macao SAR, Japan and Korea contributed some 75% of this increase, channelling funds to banks and non-financials in China. Banks' claims on Chinese Taipei, Korea and India also increased (by $24, $15 and $3 billion, respectively), while those on Thailand shrunk (-$3 billion).
Claims on borrowers in the Africa and Middle East and the emerging Europe regions also rose (by $13 and $1 billion, respectively). In particular, claims expanded vis-à-vis Israel ($5 billion) and Qatar ($4 billion). In emerging Europe, Russia ($4 billion) and Hungary ($3 billion) recorded inflows, whereas Romania (-$2 billion) and the Czech Republic (-$2 billion) saw outflows.
By contrast, claims on Latin America continued to fall in Q1 2021 (-$18 billion), bringing the total decline since end-2019 to $89 billion. This pushed the yoy growth rate of cross-border claims on the region to -13.3%, its lowest level since Q2 2009. Claims on most major countries in Latin America fell since end-2019, with those on Brazil (-$43 billion), Mexico (-$15 billion), Chile (-$10 billion) and Colombia(-$4 billion) falling the most. Claims on banks in the region contracted the most, followed by those on non-financials (including governments). Reporting banks, mainly in the Cayman Islands, Spain and the United States, reduced their interbank lending while banks in the United Kingdom reported lower holdings of debt securities issued by borrowers in Mexico.
Banks continue to channel funds to the official sector
Internationally active banks' balance sheets have expanded significantly since the start of the Covid-19 pandemic. The BIS consolidated banking statistics (CBS), which track the globally consolidated positions of banks headquartered in a given country (net of inter-office positions), show that reporting banks' total assets grew from $67 trillion at end-2019 to $79 trillion by the first quarter of 2021, an 18% increase (Graph 4, left-hand panel).6 Their total liabilities followed a similar pattern.
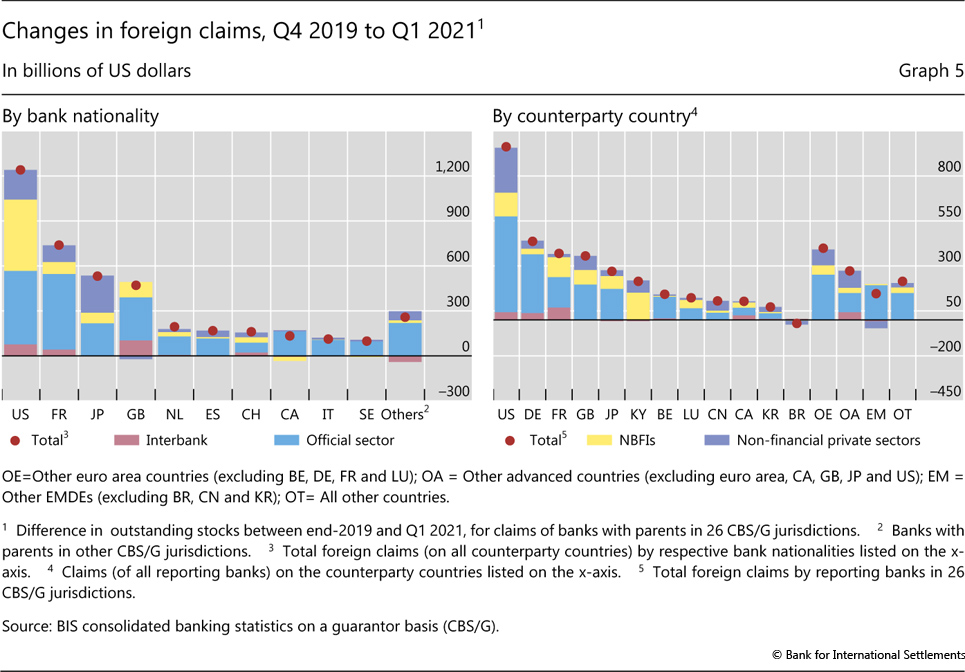
Overall, banks' foreign claims - ie cross-border claims and local claims booked by banks' foreign affiliates - have risen by $3.6 trillion since end-2019 (Graph 4, left-hand panel).7 US banks' foreign claims (on non-US counterparties) expanded the most, by $1.2 trillion (Graph 5, left-hand panel), with greater claims on the official sector in advanced Europe and on non-bank financials in advanced Europe and the Cayman Islands. Similarly, French and Japanese banks' foreign claims also expanded, by $739 billion and $532 billion, respectively.
However, the bulk - roughly 70% - of the increase in total claims since end-2019 reflected greater domestic claims, ie claims on residents of reporting banks' home countries (Graph 4, left-hand panel). This pattern was evident across many banking systems. As a result, reporting banks' foreign claims accounted for 33% of their total consolidated claims at end-Q1 2021, down from 34% at end-2019.
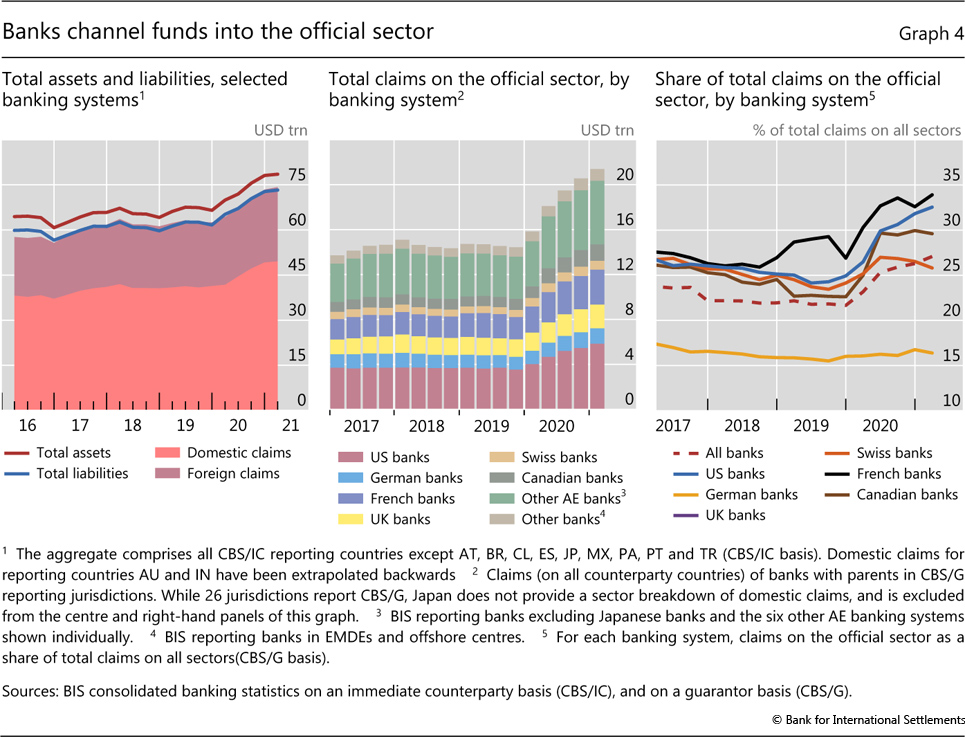
The expansion in banks' balance sheets since the start of the pandemic has gone hand-in-hand with greater claims on the official sector, comprising governments and central banks (Graph 4, centre panel).8 Banks' total claims on this sector - mainly in the form of holdings of government bonds and reserves at central banks - stood at $21.4 trillion at end-Q1 2021, up from $14.4 trillion at end-2019, a substantial increase of 48% in unadjusted stocks.9 Over that period, the share of claims on the official sector in total claims of BIS-reporting banks (excluding Japanese banks) rose by almost 5 percentage points to reach 27% at end-Q1 2021 (Graph 4, right-hand panel). Canadian, French and US banks' shares rose by roughly 7 percentage points, while all other banks' shares rose by an average of 5 percentage points.
Banks channelled funds to the official sector both at home and abroad. Their domestic claims on the official sector in their home countries rose from $8.7 trillion at end-2019 to $13.5 trillion at end-Q1 2021 (excluding Japanese banks), accounting for a full 55% of the total increase over this period. At the same time, their foreign claims (including Japanese banks) on the official sector, in particular vis-à-vis the United States, grew by $532 billion, or 27% (Graph 5, right-hand panel). Non-US banks' claims on the US official sector, reflecting holdings of US Treasury securities and reserves at the Federal Reserve, reached $2.5 trillion, or 34% of their total consolidated foreign claims (up from 31% at end 2019). For their part, US banks' foreign claims on the official sectors (outside the United States) reached $1.4 trillion, or 34% of their total foreign claims.
1 The most recent turn shows a stronger-than-average (over the past 5 years) rise in cross-border claims in Q4 2020, followed by a roughly average rise in Q1 2021 (this comparison excludes the outsized surge in cross-border claims in Q1 2020). In the latest quarter (Q1 2021), banks located in Japan, Germany, the United Kingdom, France and China reported expansions in cross-border claims (by $251, $162, $152, $117 and $117 billion, respectively). In particular, banks in China reported the largest increase since their data have been reported (Q4 2015). Banks in Australia and Canada reported contractions (by $115 and $83 billion, respectively).
2 The latest yoy growth rate no longer includes the $2.7 trillion expansion in Q1 2020, which had made yoy growth rates positive throughout 2020. See Q2 2020 IBS release for discussion.
3 The increase in debt securities claims ($161 billion) was partly offset by a decline in "other instruments" (-$43 billion), which comprise financial instruments not categorised as loans and debt securities; it includes derivatives, holdings of equity securities and retained earnings.
4 Consistent with the locational banking statistics (LBS), the BIS consolidated banking statistics (CBS, guarantor basis) show that non-UK banks' consolidated derivatives claims on the United Kingdom decreased by $179 billion (unadjusted for exchange rate movements) in Q1 2021.
5 See Graph 3 and discussion in the IBS statistical commentary (July 2020).
6 The aggregation comprises banks headquartered in 22 of the 31 CBS-reporting countries because some countries report incomplete data.
7 Foreign claims on a guarantor basis comprise cross-border claims and local claims of banks' foreign affiliates. They exclude inter-office positions. Changes in amounts outstanding are expressed in US dollars and are not adjusted for exchange rate movements. Between end-2019 and end-Q1 2021, the US dollar depreciated against some major currencies (4% against EUR and GBP, and 2% against CHF). Dollar depreciation leads to an increase in the amounts reported for positions denominated in currencies other than the US dollars.
8 Note that, in the CBS, the official sector includes the central bank, and thus differs from the general government sector in the System of National Accounts.
9 These figures do not include Japanese banks' claims on the official sector because Japan does not report domestic claims on the official sector.