BIS international banking statistics at end-June 2019
- Global cross-border bank claims expanded by 6% year over year, their highest annual growth rate since the Great Financial Crisis.
- Growth in lending to all major sectors increased. Claims on non-bank financial institutions continued to expand the most rapidly (13% year over year).
- Growth in cross-border claims on emerging market and developing economies varied considerably by region, from +11% in Africa and the Middle East to -8% in developing Europe.
Lending to NBFIs continued to lead growth in cross-border claims
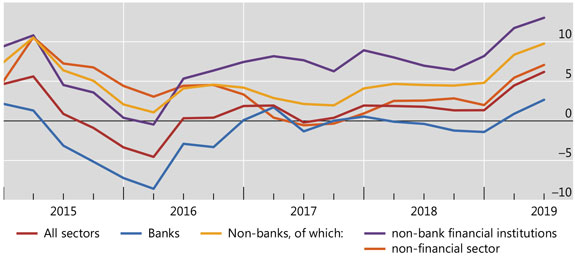
Graph 1: Annual percentage change in banks' cross-border claims by counterparty sector (interactive graph).
Source: BIS locational banking statistics (Table A1).
The BIS locational banking statistics (LBS) show that global cross-border bank claims rose by $365 billion during the second quarter of 2019, to reach $31 trillion by end-June. Their annual growth rate, which averaged around 0% since the Great Financial Crisis, reached a post-crisis high of 6% (Graph 1, red line).
Reporting banks' cross-border claims on all major sectors expanded during Q2 2019 (Graph 1). The $190 billion expansion in claims on non-banks (yellow line) accounted for more than a half of the overall quarterly increase in global cross-border claims. This, in turn, was mostly driven by claims on non-bank financial institutions (NBFIs),1 which increased by $172 billion, resulting in an annual growth rate of 13% (purple line). The majority of this new lending to NBFIs was directed towards a few financial centres, such as the Cayman Islands ($37 billion), the United Kingdom ($34 billion) and Luxembourg ($24 billion).
The latest increase in lending to NBFIs is part of a longer trend.2 Over the past five years, cross-border claims on that sector have grown at an average annual pace of 7% (compared with 1% for claims on all sectors), reaching $7 trillion at mid-2019. The BIS consolidated banking statistics (CBS) reveal that the surge in lending to NBFIs over the past few years was mainly driven by Canadian, French, Japanese, UK and US banks (interactive graph).
Cross-border lending to AEs and OFCs drove global expansion
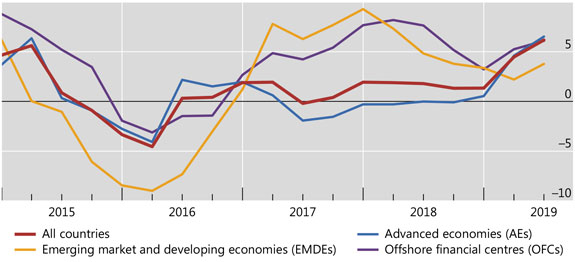
Graph 2: Annual percentage change in banks' cross-border claims by counterparty region (interactive graph).
Source: BIS locational banking statistics (Table A1).
Claims on borrowers located in advanced economies (AEs) expanded at a rapid pace. They grew at an annual rate of 7%, which took their outstanding stock to $21 trillion at end-June 2019 (Graph 2, blue line). Their latest quarterly increase was primarily driven by claims on the United Kingdom (+$67 billion), France (+$65 billion), and Germany (+$61 billion). By contrast, claims on the United States declined by $30 billion.
Lending to offshore financial centres (OFCs) remained strong. It grew at 6% year over year (Graph 2, purple line) and stood at $5 trillion as of end-June 2019, mostly to the benefit of NBFIs. Banks reported large increases in their claims on the Cayman Islands (+$45 billion), Jersey (+$9 billion) and Hong Kong SAR (+$8 billion).
Cross-border lending to EMDEs diverged considerably across regions
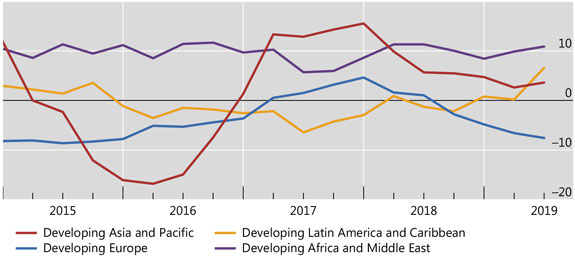
Graph 3: Annual percentage change in banks' cross-border claims by counterparty country (interactive graph).
Source: BIS locational banking statistics (Table A1).
Cross-border claims on emerging market and developing economies (EMDEs) rose by $43 billion during Q2 2019. As a result, their annual growth rate increased slightly (from 2% at end-March to 4% at end-June), but still remained considerably below its recent peak of 9% at end-2017 (Graph 2, yellow line). The outstanding stock stood at $4.1 trillion at end-June 2019.
The overall figures for EMDEs conceal considerable heterogeneity across regions.
The contraction in cross-border claims on developing Europe, which started in the middle of 2018, deepened in Q2 2019. The annual growth rate of lending to the region dropped to -8% at end-June 2019 (Graph 3, blue line). The decline in Q2 2019 was largely due to a sharp contraction in claims on Turkey (-$11 billion).
In contrast, cross-border lending to borrowers in developing Asia-Pacific rose by $27 billion, bringing the annual growth rate to 4% (Graph 3, red line). Claims on China, up by $25 billion, accounted for almost the whole increase. Those claims have grown from a recent low of $699 billion (at end-March 2016) to $990 billion (at end-June 2019).
The annual growth rate of cross-border claims on developing Latin America and the Caribbean accelerated to 7% (Graph 3, yellow line) in Q2 2019, after spending several years in negative or near-zero territory. Lending to developing Africa and the Middle East continued to expand rapidly, reaching an annual rate of 11% as of end-June 2019 (purple line).
1 For further discussion, see P García Luna and B Hardy, "Non-bank counterparties in international banking", BIS Quarterly Review, September 2019, pp 15-33.