Markets retreat and rebound
Shifting prospects for growth and monetary policy in major economies dominated market developments during the period under review.1 In December, investors' concerns that monetary policy would remain on a firmer course, despite a softening global economy, drove risky asset prices sharply lower. Starting in January, an accommodative turn in policy and improved economic signals in the United States lifted those prices again.
As 2018 drew to a close, international markets were rattled by growth worries and a renewed focus on policy uncertainty, triggering a flight to safety. Equities fell and corporate spreads widened across the globe. Sovereign yields dropped and curves flattened slightly as term premia slid. Amid a generalised repricing, US assets were hit particularly hard. In contrast, emerging market economies (EMEs) were relatively stable even as China continued to slow. In a sign of tightening financing conditions, high-yield corporate bond funds experienced large outflows, and low-rated loan and bond issuance contracted.
Financial markets found firmer footing in January, after central banks reaffirmed that monetary policy stood ready to adjust in light of risks to the global economy. The Federal Reserve reiterated that interest rate and balance sheet decisions would be data-dependent, and kept policy rates on hold, citing concerns about the global economy and muted inflation expectations. The ECB underscored rising risks to growth in the euro area, and highlighted that it was ready to deploy all policy tools as necessary. The People's Bank of China injected significant liquidity into the banking system, and introduced new policy tools as part of a multi-pronged effort to stimulate the slowing economy and bolster bank lending.
Buoyed by policy moves and renewed optimism, global markets surged in January and February. Just as investors became reassured that US monetary policy would remain accommodative, more favourable than expected macroeconomic indicators in the United States helped fuel a rally for risky assets. Equities and corporate bonds retraced earlier losses, exhibiting relatively high correlation across countries in the process. Prices of oil and industrial metals recovered. In EMEs, an initial weakening of the dollar helped sustain inflows to fixed income and equity funds, and government bond yields dropped after holding steady at the end of the year. Later in the review period, these inflows continued, but at a slower pace as the dollar appreciated.
Developments in Europe at times diverged from the cautiously improving global mood. Sovereign vulnerabilities receded in Europe at first, but picked up later in the period under review. Amid persistent economic weakness, Italian government spreads fell through January before inching up again in February, while yields on German bunds kept sliding, hitting their lowest point in more than two years. Although the outcome of Brexit negotiations became increasingly unclear, sterling and UK sovereign yields did not see large price movements. UK stocks rose.
Phase 1: Markets fall as slowdown worries grow
Expectations of a further global economic slowdown, together with concerns that monetary policy would remain on a tightening course in advanced economies (AEs), led to market weakness and volatility early in the review period. A flight-to-safety phase set in.
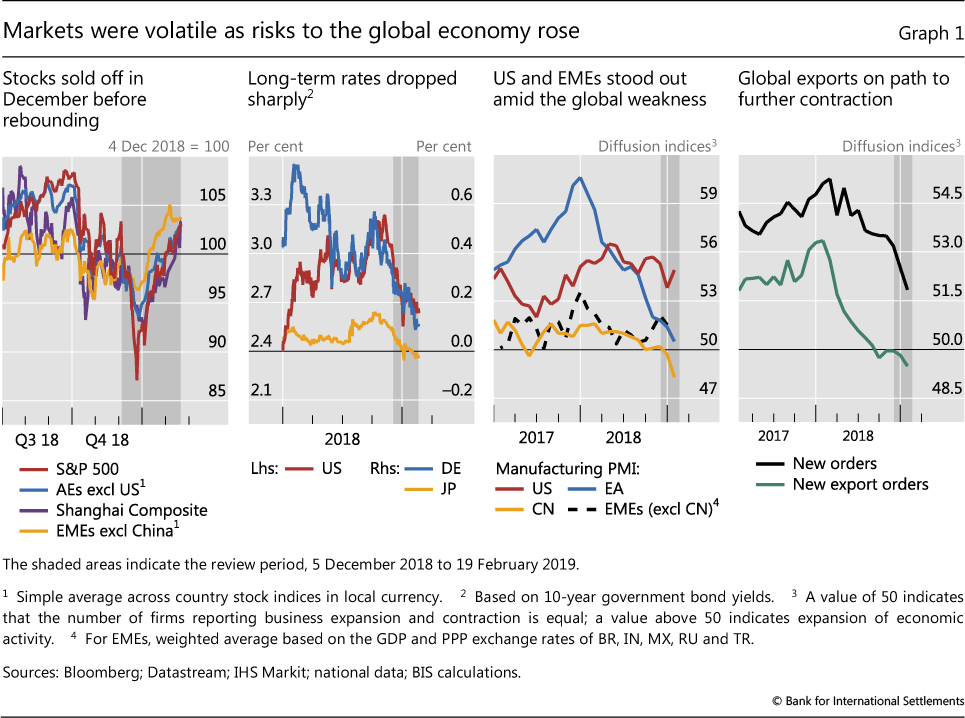
Global equities declined sharply and AE sovereign yields fell. Cumulative losses for the S&P 500 peaked at more than 10% in December. Reversing the divergent trends that had characterised most of 2018,2 US equities ceded more ground than other global stocks, while EMEs excluding China performed relatively well (Graph 1, first panel). Long-term sovereign yields eased across the board, reflecting market views on increased risks to global growth and their implications for monetary policy. In Germany and Japan, yields reached the lowest 2018 levels in December. US yields dropped more than 20 basis points up to the end of the year (second panel), even as the foreign official sector's Treasury holdings continued to decline and net issuance remained brisk.
Growth kept steady in the United States, but stronger economic headwinds in Europe and China highlighted global downside risks. In December, purchasing managers' indices (PMIs) for the US manufacturing sector pointed to a continuing expansion. Market participants appeared to become increasingly concerned that, despite favourable domestic conditions, the US economy could eventually suffer from fragility elsewhere. Late-year readings of PMIs for the manufacturing sector signalled a contraction in China, and stalling activity in the euro area (Graph 1, third panel). Although new tariffs between China and the United States were put on hold until March 2019, persistent weakness in new export orders added to investors' worries (fourth panel).
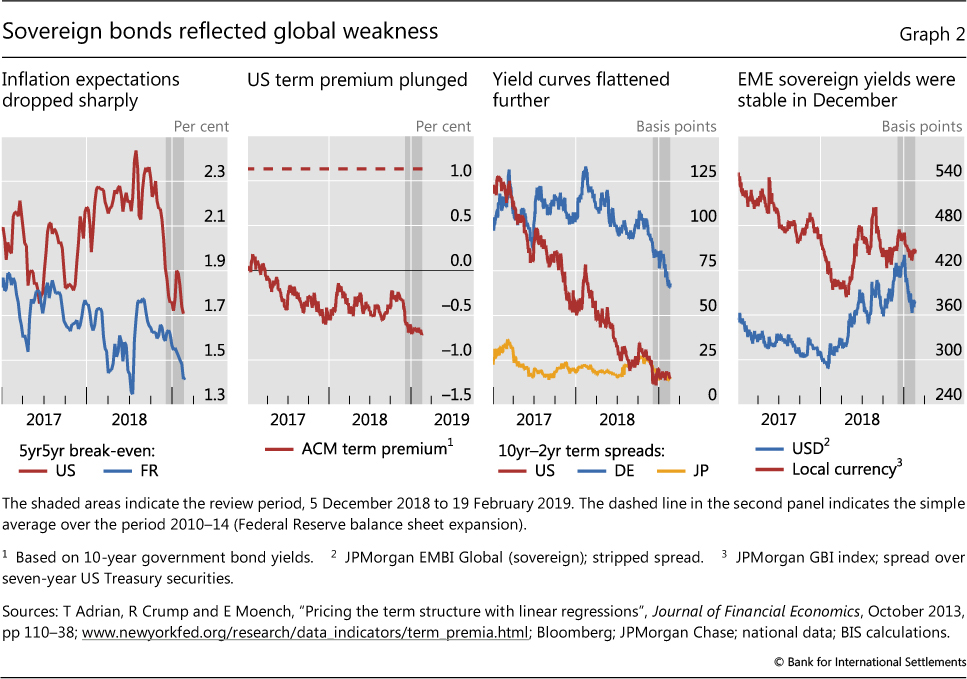
With a more vulnerable outlook, market-based inflation expectations dropped, term premia compressed and sovereign yield curves flattened. Inflation expectations had increased steadily in the United States for most of 2018 but fell substantially between early December and year-end. Break-even inflation also retraced slightly in the euro area, continuing on a steady downward path (Graph 2, first panel). The US term premium decreased by about 40 basis points from late November to December, falling further into negative territory and closing 2018 at a level lower than at any time since 2016 (second panel). Sovereign yield curves were slightly flatter on net by year-end (third panel). In contrast to AEs, and reflecting broader resilience, sovereign yields in EMEs were largely stable (fourth panel).
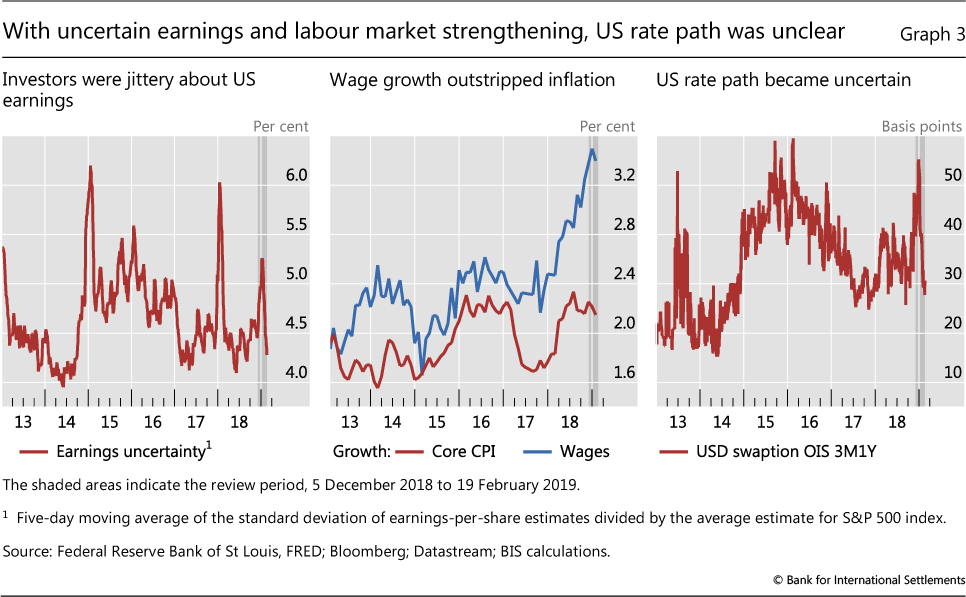
Conflicting economic signals increased uncertainty about the sustainability of corporate profits and the future path of monetary policy. The more vulnerable global economy and the relatively strong US dollar dimmed the outlook for US earnings growth, and earnings uncertainty rose quickly at the end of the year to levels reached just prior to the February 2018 market turbulence (Graph 3, left-hand panel). Despite weak economic readings in the euro area and concerns of spillovers to the United States, wage growth was rapid and outstripped core inflation, indicating a possible pass-through of wage pressures to future headline inflation (centre panel). As a result, market measures of monetary policy uncertainty spiked late in December to levels similar to those during the "taper tantrum" episode in 2013 (right-hand panel).
Contributing to investors' unease, monetary policy appeared set to continue on the preset tightening course in both the United States and the euro area. On 19 December, the Federal Reserve raised the policy rate and, while it expected a slower pace of rate increases in 2019, it also stated that balance sheet unwinding would proceed according to plan. In the euro area, the ECB's asset purchase programme ended as scheduled.
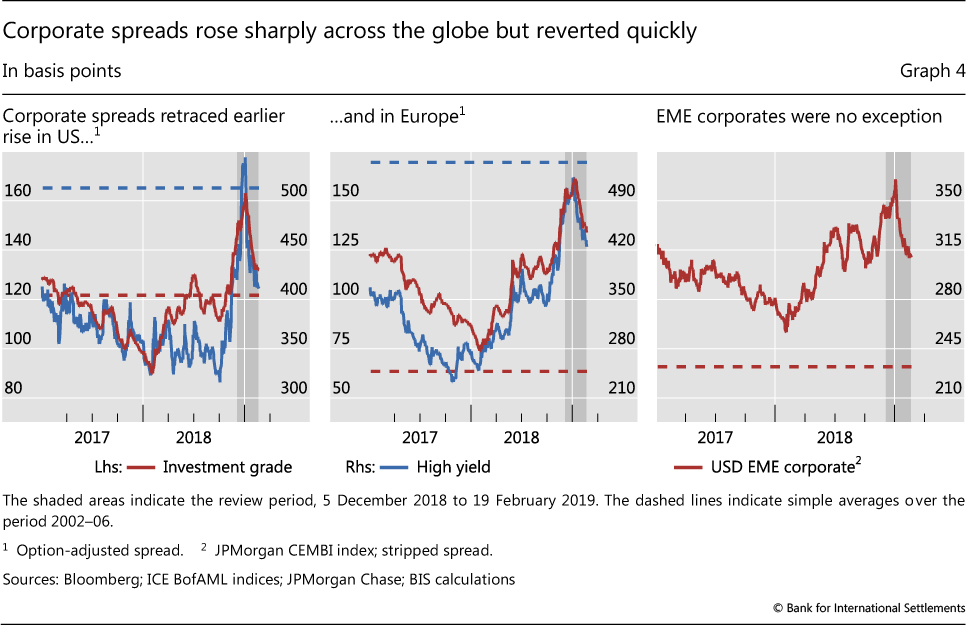
Mounting worries about the growth outlook also jolted global corporate bond markets. As December got under way, corporate bond prices faced renewed pressure across the board. Credit spreads rose sharply in the United States. High-yield (HY) companies suffered most and saw their spreads briefly exceed the pre-crisis average. Investment grade (IG) spreads also rose, but not as much (Graph 4, left-hand panel). Moreover, corporate bond issuance contracted. In Europe and EMEs, spreads rose, albeit not as markedly as in the United States (centre and right-hand panels).
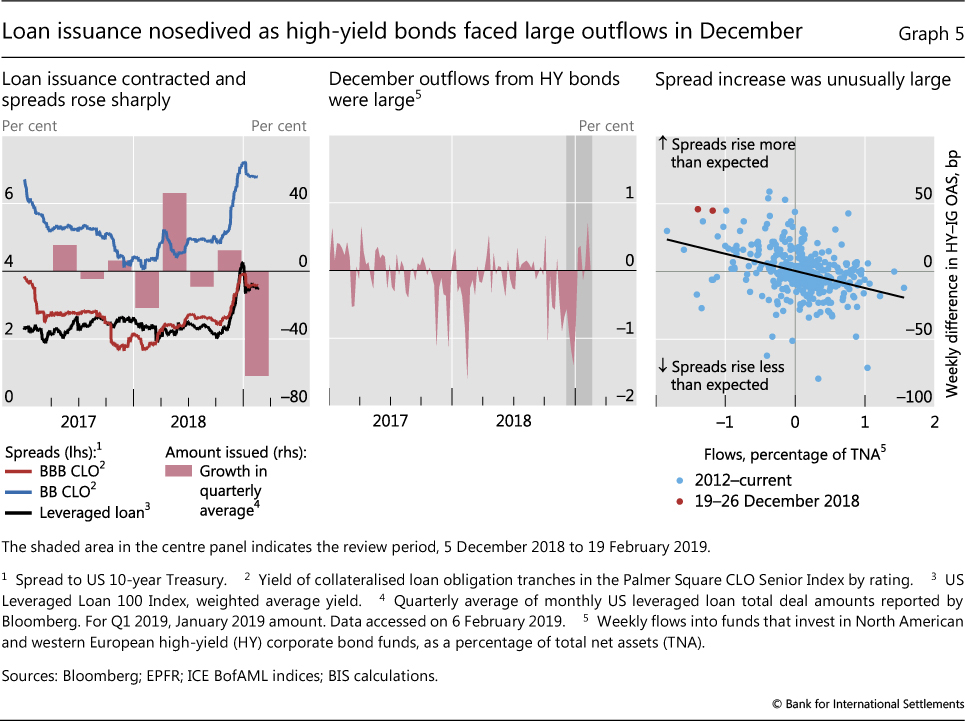
Stress in the markets for leveraged loans and collateralised loan obligations (CLOs) also pointed to tighter financial conditions for lower-rated companies. Issuance of leveraged loans dropped sharply in the United States, declining more than 50% in January (due to lags, January figures reflected the December slowdown). Spreads on leveraged loans and CLOs had been rising quickly since the beginning of the fourth quarter, and the run-up through December resulted in a doubling of the level prevailing in the past two years for leveraged loans. CLO spreads also rose rapidly in December (Graph 5, left-hand panel).
The spike in US corporate spreads largely reflected changing conditions in funding markets, but reduced year-end liquidity appeared to have played a role (Box A looks at late-December illiquidity). Spreads in the last two weeks of December proved especially sensitive to the large outflows from high-yield bond funds (Graph 5, centre panel) - more so than suggested by historical relationships. Indeed, the rise in spreads at the end of December 2018 was greater than when similarly large outflows occurred in the past (right-hand panel). This price reaction to outflows highlighted concerns about the robustness of liquidity in corporate bond markets at times of intense selling pressure (Box B discusses one possible source of outsize sales).
Phase 2: Sentiment picks up on more accommodative policy
As the global economic outlook remained unsettled, the course of monetary policy shifted in January. More accommodative signals by central banks in major economies set the tone for a market rally that started in January and reversed December losses. A phase of renewed optimism began.
The monetary policy outlook turned in January. On 4 January, the Federal Reserve Chairman underscored that both interest rate and balance sheet adjustments would be flexible to respond to incoming data. Eleven days later, the ECB President highlighted the increased downside risks to the economy and underscored that the full toolbox of monetary policy instruments remained available. On 23 January, the Bank of Japan revised its inflation forecast downwards and reaffirmed its commitment to purchase government bonds in order to keep the 10-year yield on target. During the press remarks following the Federal Open Market Committee (FOMC) meeting on 30 January, the Fed Chairman reiterated the main message of balance sheet flexibility that he had conveyed on 4 January.
Market participants responded to these monetary policy signals by resuming risk-on positions. A comparison of market developments on 19 December and 4 January illustrates the change in mood. On 19 December, investors had pulled back from risky positions in response to the FOMC policy statement. Even though the Federal Reserve had reduced the number of expected rate rises in 2019 from three to two, it had raised rates as anticipated and had indicated that balance sheet adjustments would stay on autopilot. On that day, even as investors started discounting the likelihood of a future rate increase, equities and corporate bonds added to earlier losses, especially in the United States (Graph 6, first and second panels). Later in December, investors attached a greater probability to a rate decrease than to an increase. Now, on 4 January, with the signal that balance sheet unwinding would be flexible if necessary, asset prices recouped some of their losses, with assets that had dropped more in December rallying to a larger extent (third panel).3 While the Federal Reserve articulated its balance sheet outlook in more detail on 30 January, the reaction to this FOMC meeting was more muted (fourth panel).
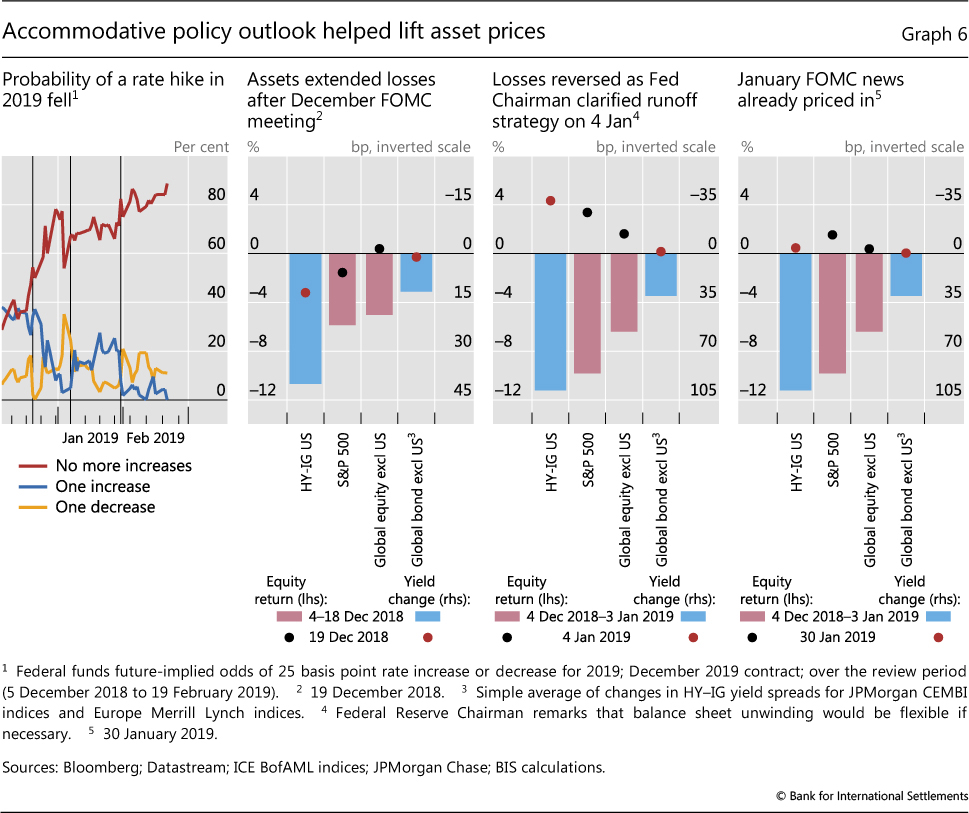
Deteriorating financial conditions, and their potential impact on the real economy, contributed to the turn in monetary policy stance as reflected in remarks to the press following the two FOMC meetings. On 19 December, the Federal Reserve Chairman had highlighted that worsening financial conditions - reflecting broad developments in interest rates, corporate spreads, and currency and stock markets among others - had not fundamentally altered the outlook for the US economy.4 On 30 January, the Chairman underscored that the sustained worsening of financial conditions, together with rising spillover risk to the United States from more fragile global growth, was a factor in the decision to pause monetary tightening that was taken at the January FOMC meeting.5
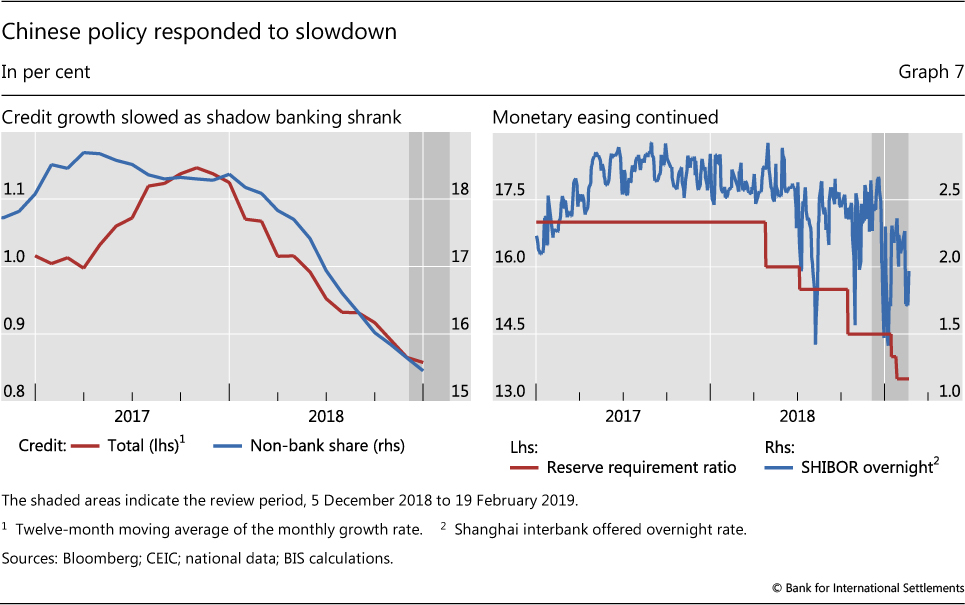
As the monetary stance eased in AEs, Chinese authorities implemented a multi-pronged strategy to fend off a persistent slowdown. For much of 2018, weakness in Chinese asset prices and macroeconomic data had partly reflected efforts to deleverage without compromising growth. Policymakers eased monetary and fiscal policy even as they sought to steer credit growth away from the shadow banking sector (Graph 7, left-hand panel). These efforts were reinforced in January. Monetary stimulus focused on banks, with the People's Bank of China cutting reserve requirements, providing large amounts of liquidity through open market operations (right-hand panel) and launching a term lending facility aimed at bolstering credit to smaller firms. Regulators also approved the issuance of perpetual bonds by banks to shore up Tier 1 capital. These bonds can be swapped with central bank bills, which in turn can be used by holders as collateral to obtain financing. On the fiscal side, the stimulus was mainly routed through "local government special bonds" that funded infrastructure projects.
Box A
Financial markets remain vulnerable to year-end stress
Sharp price movements are common at year-ends in many markets, reflecting the relatively low liquidity that results, in part, from infrequent point-in-time regulatory reporting. Events in late 2018 highlighted two developments. First, market participants and central banks made adjustments to cope with recurring price anomalies: the former front-loaded the adjustment; the latter sought to ease it. Second, year-end illiquidity makes funding and collateral markets vulnerable to unexpected events. The developments also illustrated the channels through which such price dislocations can propagate across financial markets.
FX swap markets were relatively steady in late December, although volatility had risen earlier in the year. In the past, these markets had seen sharp spikes in the cost of the US dollar against the euro and yen at year-end (Graph A, first panel). These occurred at different points over the past years, as traders manoeuvred to take positions ahead of crowded dates. This time, the three-month FX swap-implied basis dropped sharply at the end of September. This reflected a combination of investor demand from prefunding of US dollar positions and high price quotes by dealers in order to manage year-end inventory balances. Even though the drop was not as pronounced as in the past, the basis remained wider for longer, pointing to the less stark but longer-lasting effects of year-end pressures.
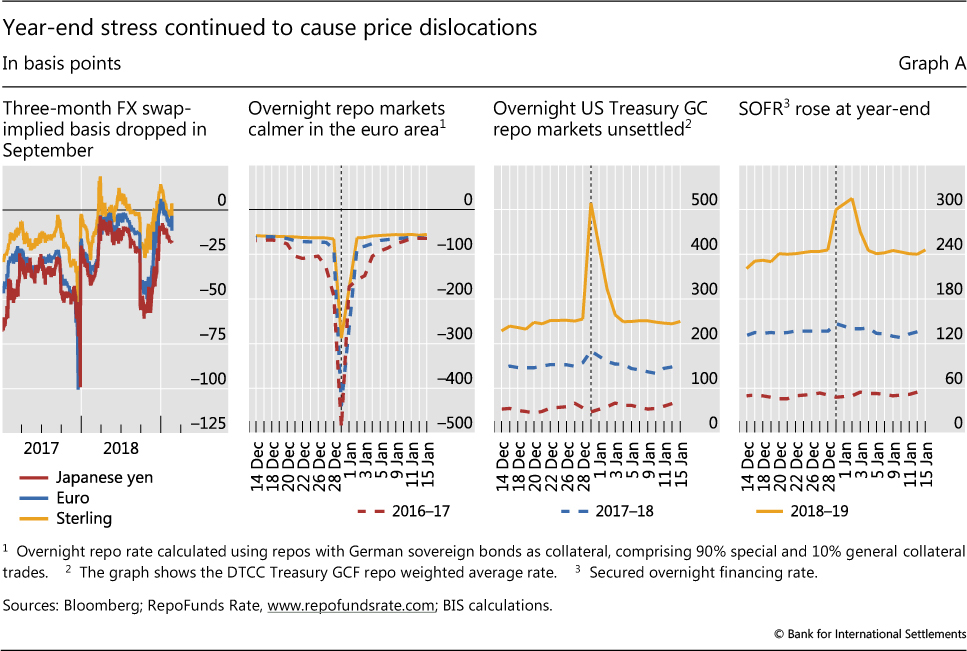
European repo markets, too, were more resilient at the end of 2018 than in previous years. For example, repo rates for highly sought- after German collateral did not drop as much into negative territory as in prior episodes (Graph A, second panel). Anticipating year-end stress in markets, investors moved ahead to lock in funding and manage collateral. Moreover, broader and easier access to securities lending programmes by the ECB and national central banks no doubt helped mitigate year-end dislocations.
Despite front-loaded adjustments, financial markets remained vulnerable to the impact of unexpected events. Large-scale US Treasury issuance took place on the last day of December, a point in time when dealers are reluctant to expand their balance sheets due to regulatory reporting. As a result, the Treasury general collateral (GC) repo rate jumped by 260 basis points (Graph A, third panel).
Localised year-end stress can spill over to other markets if it affects rates used to calculate benchmarks. A case in point was the spike in the secured overnight financing rate, which is an alternative benchmark rate to LIBOR based partly on Treasury GC repo rates (Graph A, fourth panel).
More generally, these developments reflect the fact that, post-crisis, financial institutions have recognised that the balance sheet has a price. This improvement in risk management has been hard-wired by regulation. See BIS Annual Economic Report 2018, Chapter III, for further discussion. See C Borio, R McCauley, P McGuire and V Sushko, "Covered interest parity lost: understanding the cross-currency basis", BIS Quarterly Review, September 2016, pp 45-64, for further discussion of factors affecting the cross- currency basis. See also A Schrimpf and V Sushko, "Beyond LIBOR: a primer on the new benchmark rates", BIS Quarterly Review, March 2019.
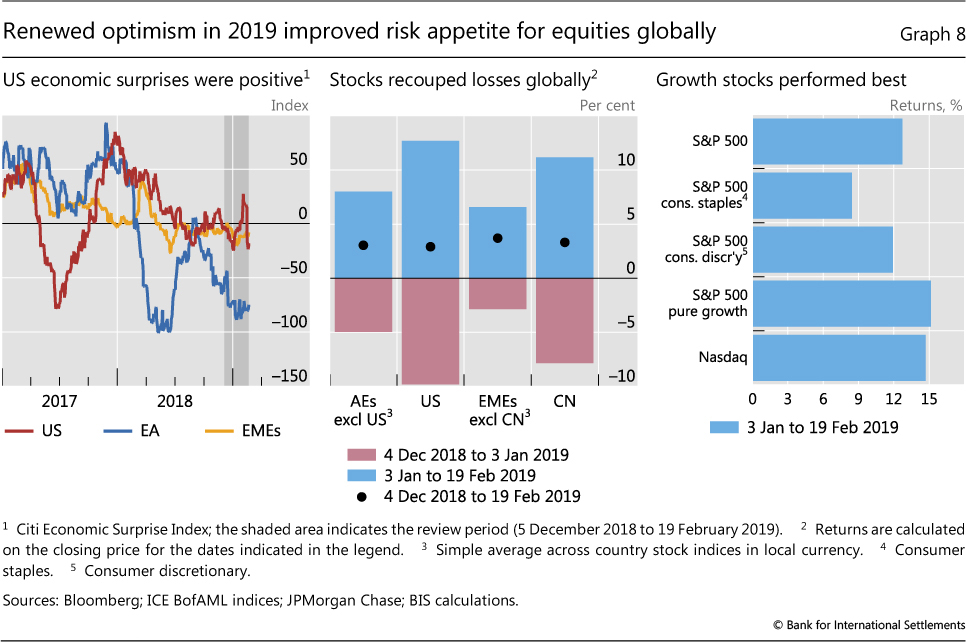
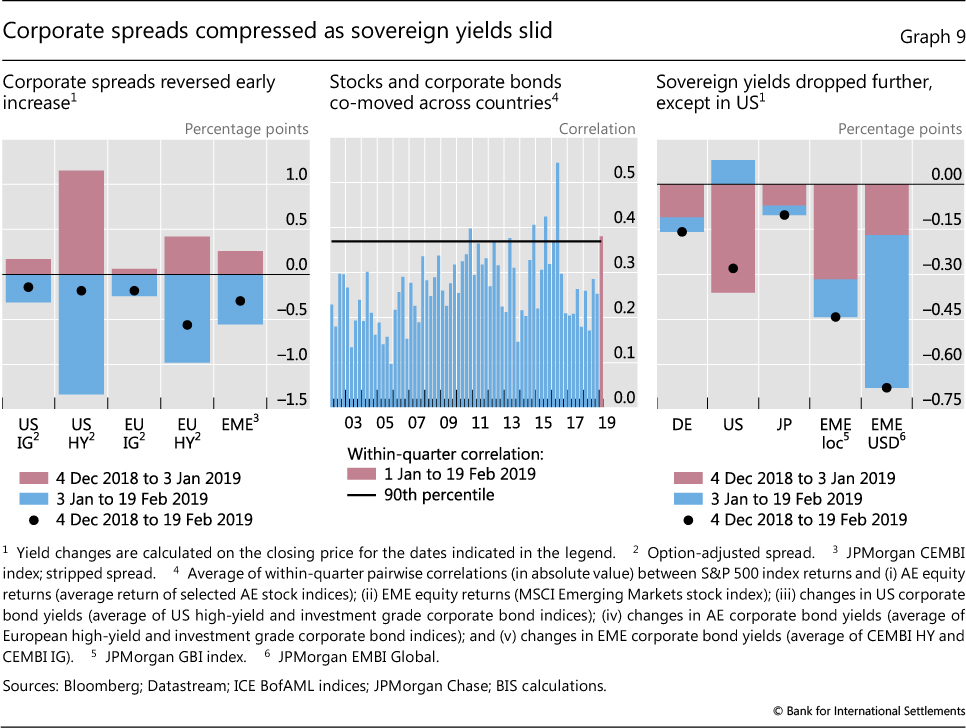
Increasingly accommodative global monetary policy and more positive than expected indicators in the United States led to renewed optimism in markets. In January, economic readings continued to weaken in Europe and remained broadly stable in EMEs, but were better than anticipated in the United States despite the prolonged government shutdown (Graph 8, left-hand panel). Stocks rallied worldwide and recouped the losses suffered in December, with growth-oriented equities performing especially well (Graph 8, centre and right-hand panels). Corporate spreads compressed globally, ending the review period lower on net (Graph 9, left-hand panel). As risky assets reacted to policy developments in unison, co-movement between US stocks and international securities - including equities and corporate bonds - jumped (Graph 9, centre panel).
Sovereign bond prices rose, except in the United States. As inflation expectations dropped, yields eased on net in Germany and Japan, but inched up in the United States (Graph 9, right-hand panel). In EMEs, sovereign yields declined, especially for US dollar-denominated bonds, which closed the review period with substantially lower yields.
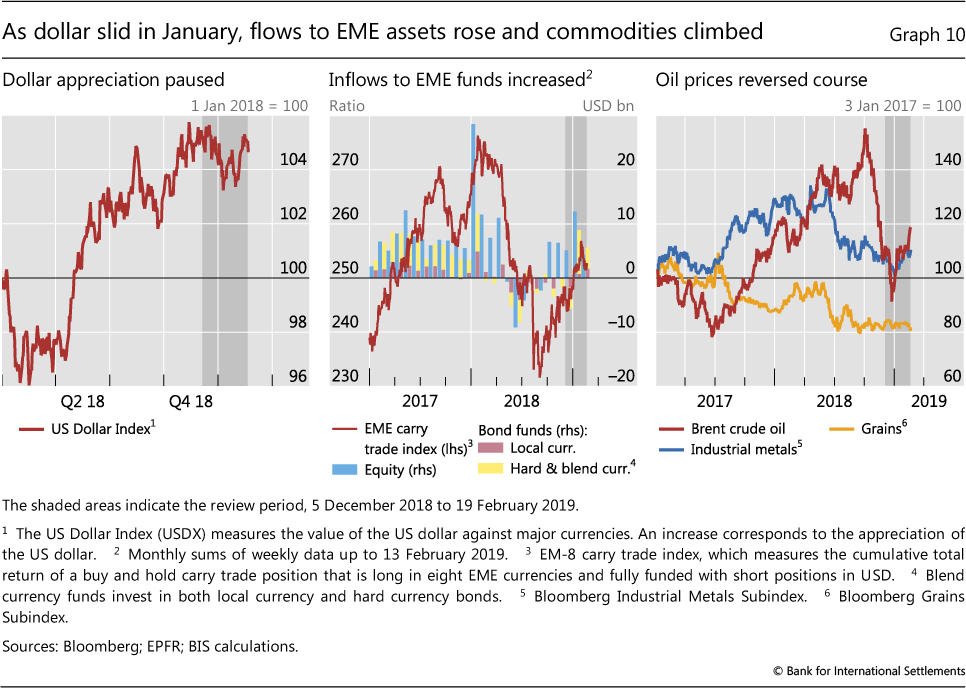
EME assets experienced large inflows, and commodity prices climbed, as the US dollar weakened in early January (Graph 10, left-hand panel). With favourable interest rate differentials and comparatively low equity valuations in light of a correction earlier in 2018, EME bond and equity funds received sustained inflows. Bond funds gathered significant assets for the first time since the beginning of 2018 (centre panel). Growth-sensitive commodities, including oil and industrial metals, also rose. Oil prices in particular, which had dropped sharply in the last quarter of the year, reversed course (right-hand panel). Later in the review period, the US dollar appreciated, with some volatility. As a result, carry trades became less profitable, and inflows to EME assets slowed down.
Box B
Investment mandates and fire sales: the case of mutual funds and BBB bonds
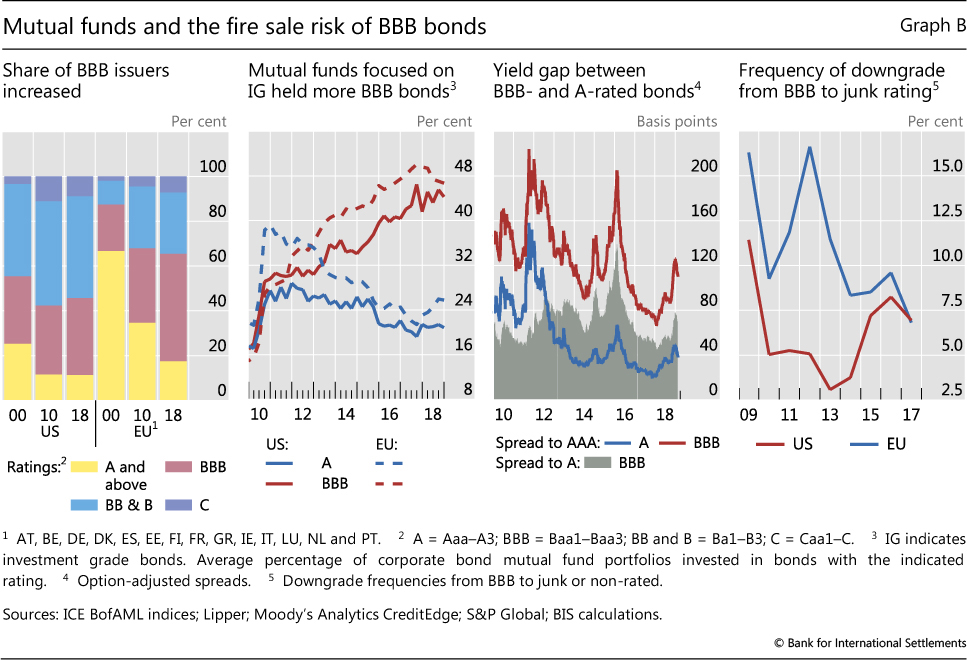
The share of corporate bond issuers with the lowest investment grade rating - BBB and equivalent - has risen in the United States and Europe since 2000 (Graph B, first panel). In the United States, the increase took place mainly prior to the Great Financial Crisis (GFC). In Europe, it continued after the GFC. As of 2018, the share of corporate bond issuers rated BBB stood at about one third in the United States and at nearly half in Europe.
Rating-based investment mandates require portfolio managers to hold assets above a minimum credit quality. Such mandates often apply to corporate bond mutual funds, and allow investors to easily choose the desired risk exposure, often focusing on the investment grade segment.
Since the GFC, investment grade corporate bond mutual funds have steadily increased the share of BBB bonds in their portfolios. In 2018, this share stood at about 45% in both the United States and Europe, up from roughly 20% in 2010 (Graph B, second panel). As interest rates remained unusually low post-GFC, portfolio managers were enticed by the significant yield offered by BBB-rated bonds, which was substantially higher than for better-rated bonds (third panel).
While attractive to investors that seek a targeted risk exposure, rating-based investment mandates can lead to fire sales. If, on the heels of economic weakness, enough issuers were abruptly downgraded from BBB to junk status, mutual funds and, more broadly, other market participants with investment grade mandates could be forced to offload large amounts of bonds quickly.
The odds of such fire sales depend on the likelihood that a sufficiently large number of companies are downgraded from BBB to junk status in short order. In 2009, when default rates reached record highs, the frequency of such downgrades was 11.4% in the United States and 16.3% in Europe (Graph B, fourth panel). By 2017, this frequency had fallen to around 7% in both regions. Under reasonable assumptions, a return to 2009 downgrade rates could force portfolio rebalancing in excess of daily turnover in corporate bond markets.
According to the Securities Industry and Financial Markets Association, about $9,100 billion of US corporate bonds were outstanding as of Q3 2018, with a daily trading volume of about $25 billion (0.27% turnover). With an 11.4% BBB-to-junk downgrade frequency, assuming 10% of the downgrades occurred around the same time and that one third of the bonds were offloaded quickly, about 0.38% of outstanding BBB bonds would be sold (compared with 0.27% daily turnover).
Sovereign risk steadies in euro area, Brexit uncertainty rises
Euro area markets witnessed an overall easing in sovereign risk indicators early in the review period. Spreads of Italian government bonds to German bunds continued to decline (Graph 11, left-hand panel). While still higher than in early 2018, Italian spreads were much lower than after the September release of the proposed government budget. Strong demand resulted in a series of significantly oversubscribed auctions for a number of countries, including Italy and Spain. In February, however, Italian spreads widened again when the European Commission slashed its 2019 GDP forecast for Italy.
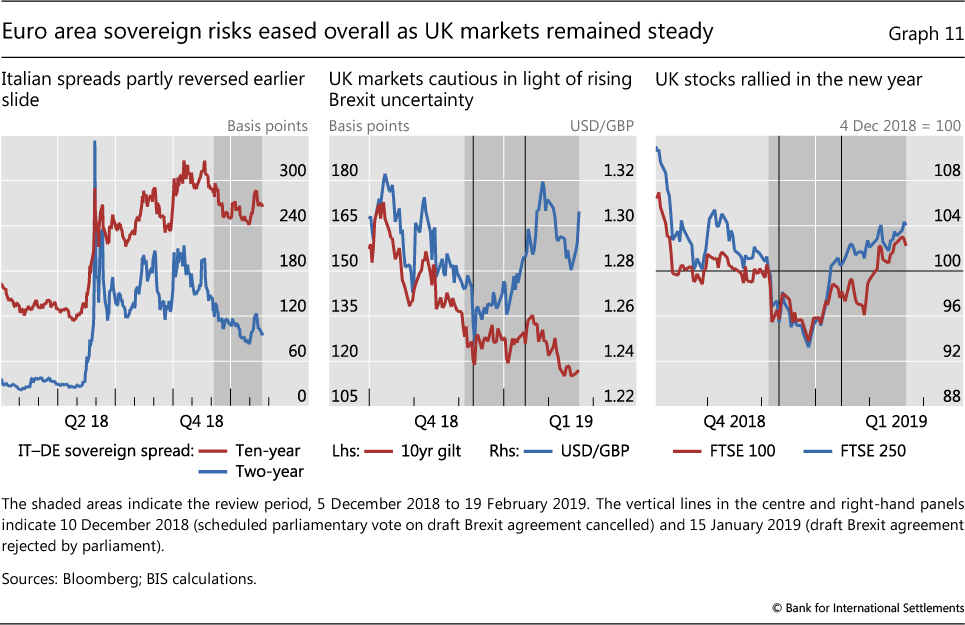
Despite growing Brexit uncertainty and the reduction of growth forecasts by the Bank of England, UK assets performed well. There were only limited signs of flight to safety on 10 December, when a scheduled parliamentary vote on the draft EU-UK agreement was cancelled. Nor was there a sustained market reaction when the agreement was rejected on 15 January. On both occasions, while sterling dropped against the dollar and 10-year gilt yields rose, the moves were not particularly pronounced and were quickly reversed (Graph 11, centre panel). UK stock indices followed their global counterparts and rallied in January and February, ending the review period with a positive return (right-hand panel).
1 5 December 2018 to 19 February 2019.
2 See "Divergences widen in markets", BIS Quarterly Review, September 2018, pp 1-16.
3 The Federal Reserve Chairman participated in a panel discussion between 10:15 and 12:15 Eastern Standard Time. At 08:30 EST, an unexpectedly positive Employment Situation report was released. Even excluding the first half-hour of trading, during which the positive macroeconomic news was reflected in prices, equities experienced a positive return.
4 Transcript of Chairman Powell's press conference, 19 December 2018, pp 1 and 4, https://www.federalreserve.gov/mediacenter/files/FOMCpresconf20181219.pdf.
5 Transcript of Chairman Powell's press conference, 30 January 2019, pp 11-12, https://www.federalreserve.gov/mediacenter/files/FOMCpresconf20190130.pdf.