Financial centres and offshore activity
Box extracted from chapter "International finance through the lens of BIS statistics: offshore activity"
Offshore financial activity concentrates in financial centres, especially those that cater predominantly to non-residents. The provision of banking, fund management, business registry and other services to non-residents varies significantly across financial centres. These services give rise to external assets and liabilities, as recorded in residence-based statistics like the international investment position. The size of external positions relative to domestic economic activity thus provides a basis for distinguishing among financial centres and identifying those focused on offshore activity (Pogliani and Wooldridge (2022)).
Financial centres that mainly serve residents are national centres. They are usually home to domestic banks and the stock exchange, and they mainly intermediate domestic funding to foreign borrowers or foreign funding to domestic borrowers. The ratio of external intermediation to domestic activity is therefore low.
At the opposite extreme are cross-border financial centres (XFCs), which mainly serve non-resident counterparties and consequently have a very high share of international business (Graph A1, red dots). XFCs channel funds between economies, often via entities with a minimal physical presence, such as booking offices, special purpose vehicles and shell companies. They are neither the ultimate source nor final destination for investments and are usually embedded in small economies, as in the case of Bermuda and the Cayman Islands. While some equate XFCs with offshore centres, the latter have come to be associated with low taxes and light financial regulation, characteristics that are neither necessary nor sufficient to attract non-resident business (Pogliani et al (2022)).
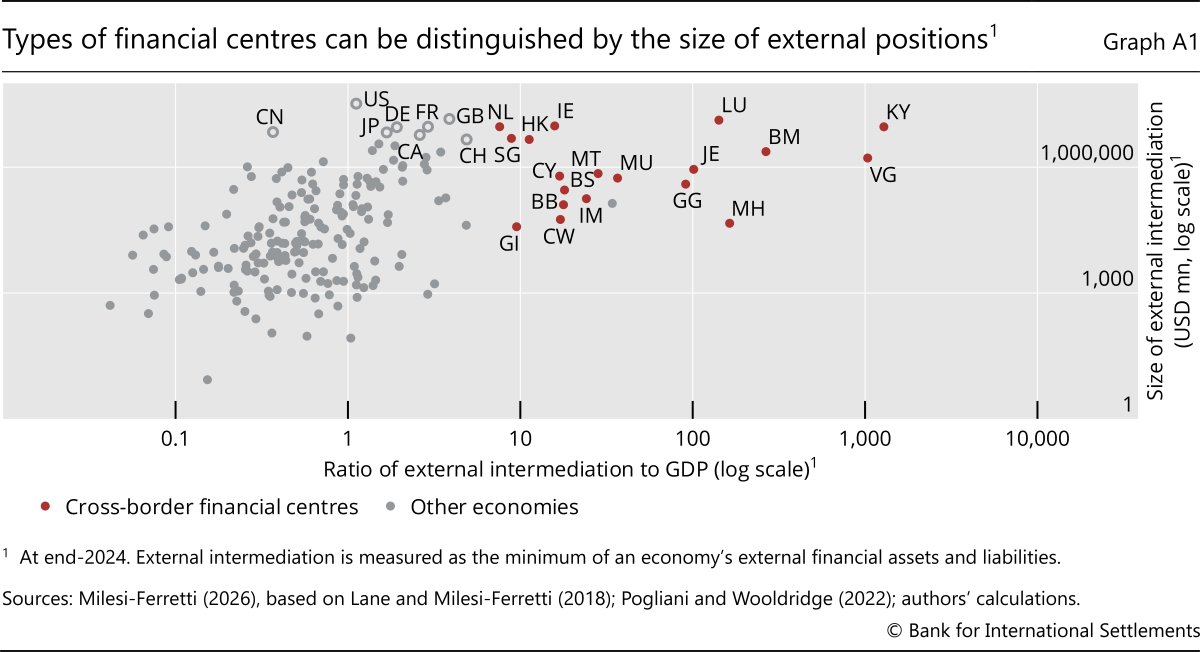
Centres that combine the functions of national and cross-border centres at scale are commonly referred to as global financial centres. They are located in major economies, typically ones that issue reserve currencies, and are home to deep, liquid markets. Their international business is very large in absolute terms – indicated by economies towards the top of the y-axis in Graph A1 – but not necessarily relative to total economic activity – thus to the left of XFCs in Graph A1. London (GB) and New York (US) are the classic examples.
Global financial centres are key hubs for decisions about the international allocation of capital, but XFCs stand out as intermediaries of capital flows. From 1980 to 2023, XFCs' external positions grew from 12% of the global total to nearly 30% (Graph A2.A). At almost $60 trillion, their external positions are now 20 times larger than their combined GDP, which accounts for just 2.8% of global economic activity.
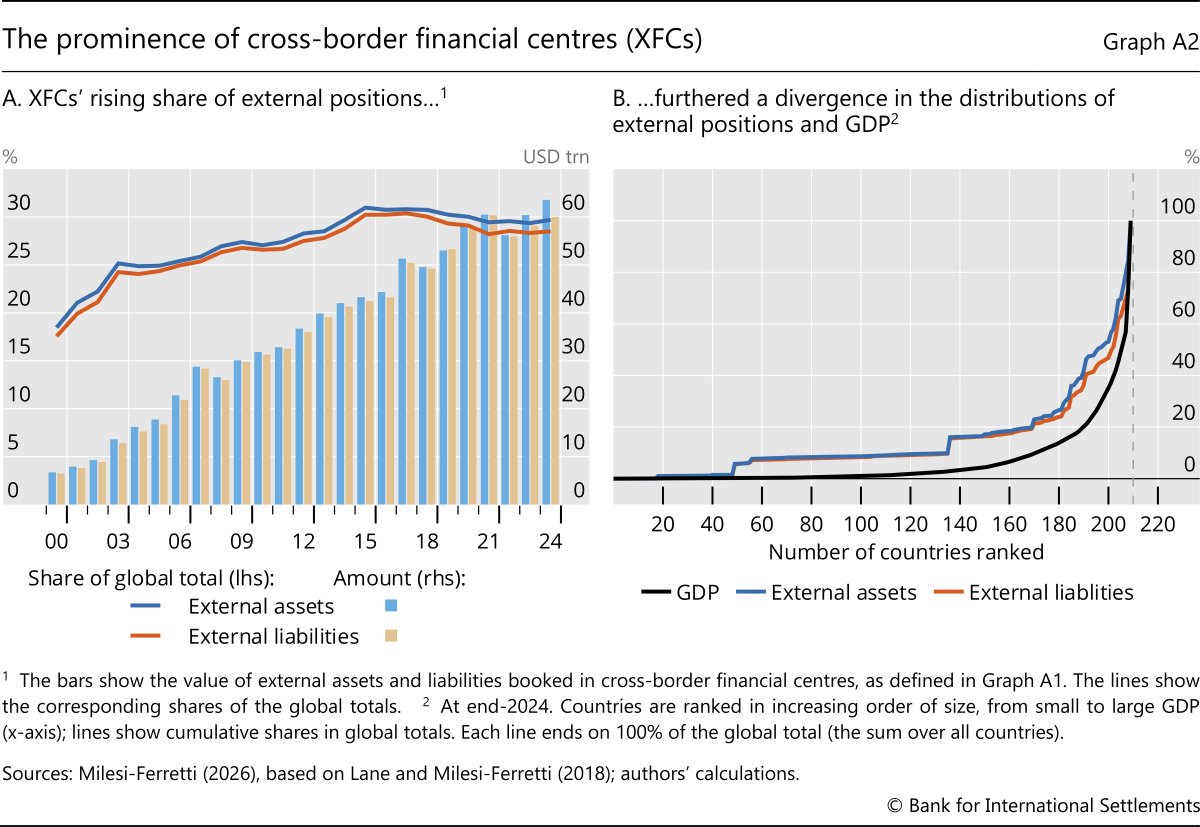
Together with the growing heft of emerging market economies, the rise of XFCs has been a key driver of measured international financial integration (Lane and Milesi-Ferretti (2018)). Consequently, the accumulation of external positions in recent decades has proceeded with little relation to economic activity. Owing to activity in XFCs, the distribution of external positions worldwide has diverged markedly from the distribution of GDP (Graph A2.B).
The views expressed here are those of the authors and not necessarily those of the BIS or its member central banks.