Evolving approaches to monetary policy communication in the face of uncertainty: fan charts, scenarios and guidance

The elevated and rapidly shifting nature of uncertainty in recent years has posed challenges for central bank communication. In particular, central banks have had to reconsider how to communicate the economic outlook and the monetary policy response. They have expanded their communications toolkit to explain uncertainty about the outlook and are increasingly using scenario analysis to complement traditional tools like fan charts and qualitative risk discussions. Fewer central banks are providing descriptive policy guidance; instead more are publishing their own policy rate projections, often in the context of alternative scenarios.1
JEL classification: D81, E17, E58
Communication has played a more central role in monetary policy in recent decades. Explicit price stability objectives, often in the form of inflation targets, combined with central bank independence, have been accompanied by greater expectations of transparency and accountability. Communicating the central bank's views about the economic outlook and the reasoning behind its policy decisions helps to address these expectations. At the same time, communication can enhance monetary policy effectiveness. It can help anchor inflation expectations at the inflation target, supporting economic stability more broadly. And it can help align interest rate expectations with the central bank's envisaged policy rate path, reinforcing monetary policy transmission.2
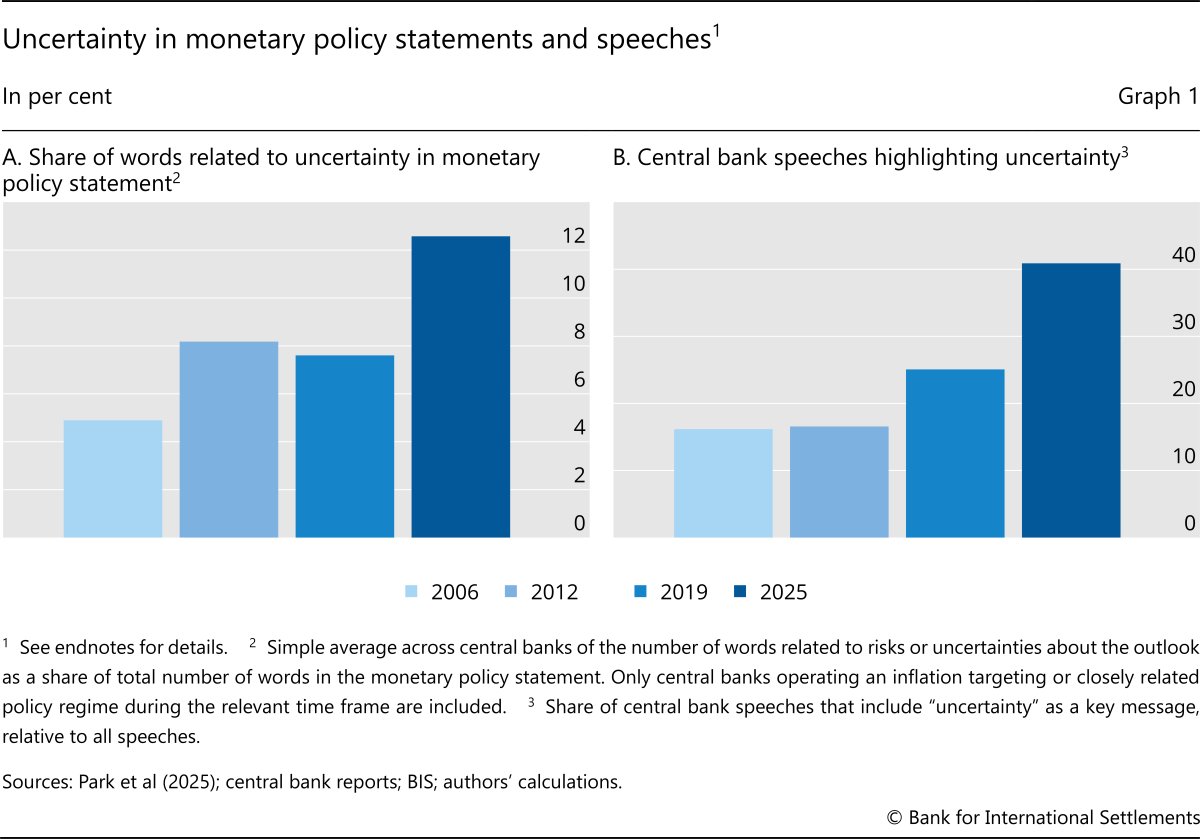
Monetary policy communication has become more challenging in recent years in the wake of unprecedented shocks (eg the Covid-19 pandemic) and increasing geopolitical tensions. As a result, central banks have been placing greater emphasis on uncertainty in their public communications. While in 2006 most monetary policy statements did not mention uncertainty, in 2025 the share of words related to uncertainty in these statements rose to up to about 15% (Graph 1.A). Similarly, the share of speeches by central bank officials that mentioned uncertainty as a key theme rose to around 40% (Graph 1.B). At the same time, a growing body of literature has examined the implications of uncertainty for the communication strategies of individual central banks.3
Key takeaways
- The elevated and rapidly shifting nature of uncertainty in recent years has affected the way central banks communicate uncertainty around the economic outlook and the monetary policy response.
- More central banks are using scenarios to illustrate the implications of specific risks, in addition to traditional tools like fan charts and qualitative risk discussions.
- Central banks are providing less descriptive policy guidance, and more are publishing their own policy rate projections, often in the context of alternative scenarios.
In particular, central bank communication about the future is becoming more complex in a context of heightened uncertainty, especially where the implications of possible developments are hard to quantify. Definitive statements about the economy's evolution will often be wrong. Yet overemphasising uncertainty can obscure the public's understanding of policymakers' views about the economic outlook. High uncertainty can contribute to large forecast errors and increases the likelihood that policy guidance will need to be revised as conditions change, with costs to the central bank's reputation and credibility. Conversely, high uncertainty may increase the value of clarifying the central bank's reaction function, thereby reducing uncertainty about how the central bank will respond to economic developments.
Against this background, this article explores how central banks address uncertainty in their public communication. Specifically, we examine the tools central banks use to discuss uncertainty around the economic outlook and those they use to convey the policy outlook, as well as how their use of these tools has changed over time. To this end, we document the evolution of central bank communication approaches over the past 20 years based on new hand-collected data from 25 central banks operating under inflation targeting or similar policy regimes.4 Drawing on published monetary policy statements and monetary policy reports, we identify the main tools used to address uncertainty around the economic outlook and influence uncertainty about the policy outlook.5 We then document how the use of these tools has evolved across central banks based on the frequency of use in four specific years – 2006, 2012, 2019 and 2025. In addition, we use a standard New Keynesian model to illustrate some of the challenges that different communication tools pose under uncertainty.
The article first lays out a conceptual framework, mapping different types of uncertainty into monetary policy communication tools. It then assesses changes in central banks' approaches to address uncertainty about the economic outlook, as well as changes in the communication of the monetary policy response. We end with a brief discussion of the implications of our analysis for the future of central bank communication.
Communicating under uncertainty: a simple taxonomy
Several taxonomies of uncertainty and risks have been proposed in the academic literature, but none relate specifically to communication. Bernanke (2007) proposes three main categories of uncertainty referring to the state of the economy, the structure of the economy and private sector expectations. Knight (1921) distinguishes between measurable uncertainty (risk) and unmeasurable (true) uncertainty, with the latter referred to in the literature as Knightian uncertainty.6
For assessing the implications of uncertainty for central bank communication tools, an alternative taxonomy focusing on its form is useful. In this article, we distinguish between two forms of uncertainty. The first is general, arising from the inherent unpredictability of the future, as the economy rarely evolves in line with the baseline forecast.7 While general uncertainty is always present, at different times it may be perceived as higher or lower. The second form of uncertainty is specific, stemming from identifiable risks or developments that can affect the economy, and hence the monetary policy stance, such as the introduction of trade tariffs.
Central bank communication addresses these two uncertainties in distinct ways. Central banks typically seek to convey the uncertainty around the economic outlook by illustrating the ways in which their forecasts could be wrong and explaining the implications of possible deviations. In contrast, central bank communication often aims to reduce policy response uncertainty by describing how monetary policy is likely to react to evolving economic conditions.
Central banks have deployed a range of communication tools to address these different aspects of uncertainty. The tools have distinct benefits and drawbacks, because each is generally best suited to address certain forms of uncertainty (Table 1).
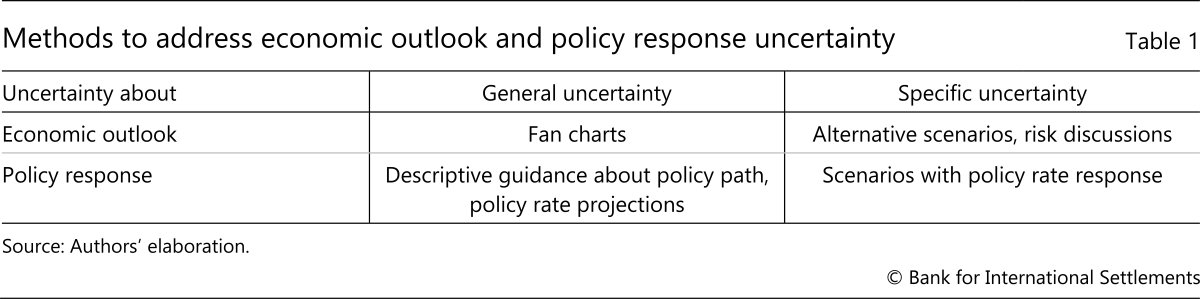
To describe uncertainty about the economic outlook, central banks have used three main tools:
- Fan charts provide a graphical representation of the general uncertainty around the forecast for inflation (and sometimes GDP growth and other variables). They depict confidence intervals for certain deviations from the central forecast, typically estimated from past forecast errors.
- Alternative scenarios provide quantitative assessments of the macroeconomic implications of specific sources of risk. These can include, for instance, the economic impact of hypothetical exogenous shocks, alternative paths of key conditioning variables or structural change in the economy.
- Risk discussions qualitatively highlight specific sources of uncertainty. The amount of detail they contain can vary from a brief list of key risks to an extensive discussion of the triggers for each specific risk and their expected economic impact.8
Some central banks provide information about future policy to reduce uncertainty about their expected future decisions and improve understanding of their reaction function. Here too three tools are prevalent:
- Descriptive guidance provides an explanation of the expected monetary policy stance, influencing the degree of general uncertainty among the public about policy and the reaction function. This guidance can indicate the central bank's assessment of the most likely future policy stance (Delphic guidance) or involve a commitment to adhere to a specific path, either for a set period or as long as certain conditions are met (Odyssean guidance).9
- Policy rate projections provide a quantitative indication of the expected policy path, typically in the form of a chart in the central bank's monetary policy report.10 These projections can also influence the extent of general policy uncertainty, although relative to descriptive guidance they are more tightly linked to the central forecast, which in turn provides greater clarity about the central bank's reaction function.
- Scenarios with a policy response illustrate the central bank's expected reaction in the specific context of the scenario. Such scenarios hence influence uncertainty about the policy response in specific situations and can, more broadly, further clarify the reaction function.
The mapping in Table 1 suggests that central banks use tools to address both general and specific forms of uncertainty in communication about the economic outlook and policy response. The table also shows how the specific mix of tools used may be adjusted based on the form of perceived uncertainty confronting central banks.
Communicating uncertainty around the economic outlook
The tools used to communicate uncertainty around the economic outlook vary across central banks (Graph 2). Fan charts are the most common tool, published by almost 75% of the 25 central banks in our sample in 2025. Qualitative risk discussions accompanying the publication of the forecast are also a popular tool to convey risks around the outlook, used by almost 70% of the assessed institutions. Fewer central banks, around 45%, employ scenario analysis to quantitatively illustrate risks around the baseline forecast.11
The tools used have also evolved over time (Graph 2). The most noteworthy change concerns scenario analysis. Published by only about 25% of assessed central banks before the Covid-19 pandemic, its use has risen substantially since then. Qualitative risk discussions, already presented by about half of the assessed central banks in 2006, became even more common after the Great Financial Crisis. Their use has remained broadly stable since. Fan charts, pioneered in 1993 by the Bank of England in its inaugural Inflation Report, saw steady adoption from the start of our sample and were presented by around 75% of assessed central banks in 2019. Unlike other recent surveys of central bank communication approaches (eg Bauer et al (2025)), ours – which includes a larger sample of central banks – indicates that the use of fan charts has dipped only marginally in recent years. However, their prominence within central bank reports has diminished in some cases.12
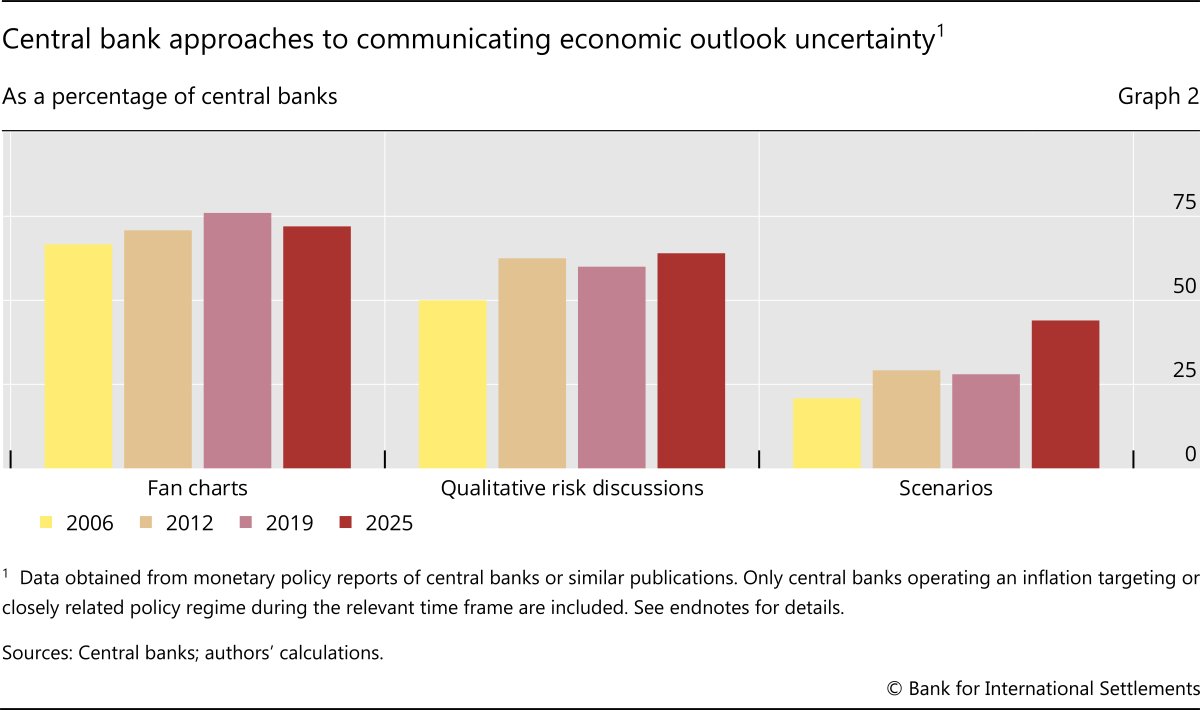
The greater prevalence of scenario analysis and relative de-emphasis of fan charts by some central banks between 2019 and 2025 partly reflect the strengths and weaknesses of the two tools in addressing the perceived uncertainties prevailing since the outbreak of the Covid-19 pandemic.
Fan charts highlight the general uncertainty in central banks' economic forecasts. They provide a concise way to communicate the central bank's assessment of the likelihood of key economic outcomes, such as overshooting the inflation target or entering a recession, without the need to detail every contributing factor. They can also help to manage expectations about the central bank's knowledge of the future.
Further reading
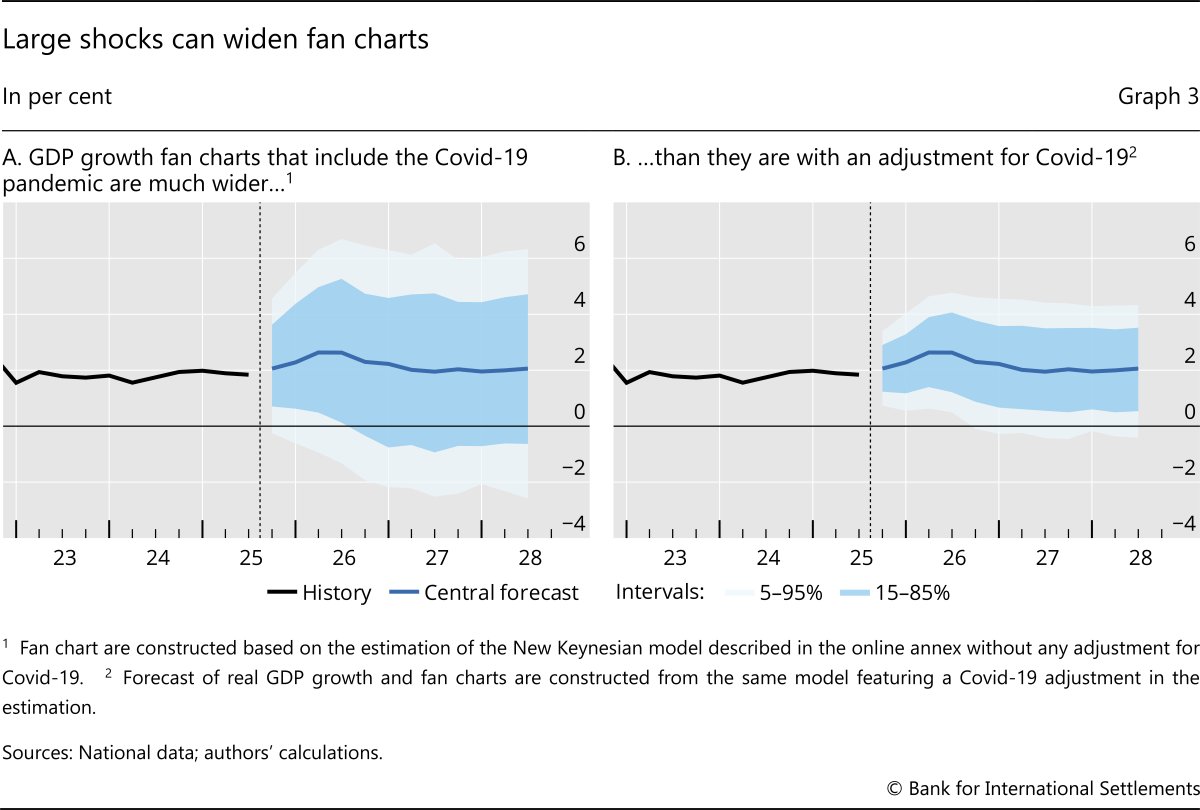
However, if too wide, fan charts risk diluting the central bank's messages about the outlook and raising questions about its forecasting ability. This problem can become acute if large shocks give rise to large forecast errors, as past errors typically form the basis for determining the width of the fan chart. Graph 3 illustrates this with fan charts constructed based on a standard New Keynesian model estimated on aggregate G7 country data (see the online annex for details). The graph shows how the fan chart for GDP growth inflates when the Covid-19 pandemic observations are included (Graph 3.A) compared with when the model features an adjustment for these large shocks (Graph 3.B).
Another drawback with fan charts is their inability to highlight specific risks facing the economy or to capture bi- or multi-modal distributions of possible future outcomes. This limitation has become particularly relevant in recent years due to the presence of large perceived uncertainties in the form of distinct, plausible paths for the economy. A prominent example occurred in 2020, when uncertainty arose about whether there would be a timely vaccine for Covid-19. Another was the inflation surge of 2021–22, when there was the question about whether the inflation shock would prove transitory, persistent or potentially even trigger a wage-price spiral. In these cases, a fan chart centred on a baseline forecast that averaged out the alternatives may provide a poor guide to the uncertainty around the economic outlook. Instead, central banks often find it useful to rely on tools that can draw attention to specific risks and describe their economic consequences.
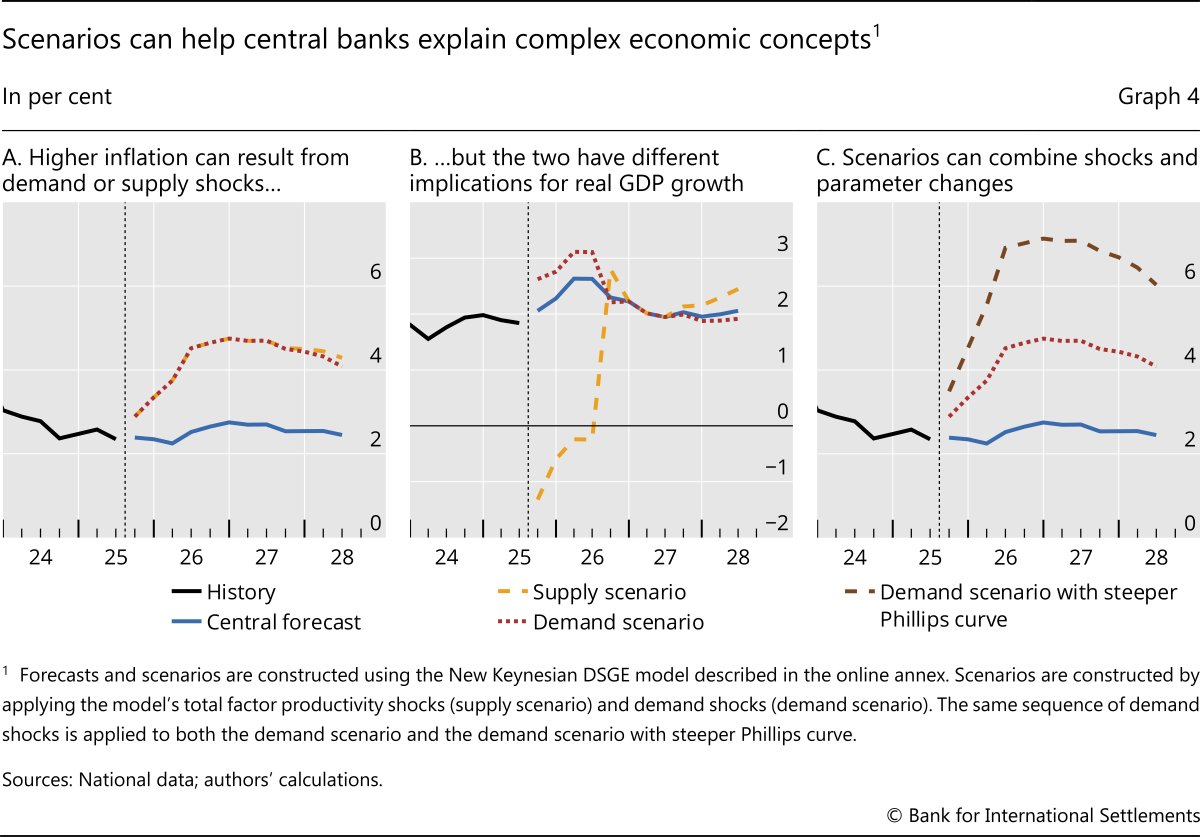
Scenario analysis is one such tool. It is particularly useful for crafting narratives around complex economic dynamics to help clarify how specific risks may play out. A useful example is to show the trade-offs associated with responding to higher inflation and how these depend on the underlying causes. A central bank could illustrate this by presenting two scenarios, one in which households save less of their income than expected (a positive "aggregate demand shock") and one where productivity grows more slowly than usual (a negative "aggregate supply shock"). Although both scenarios raise inflation (Graph 4.A), the path of GDP differs sharply (Graph 4.B). This exercise presents a concise visual illustration of how a given inflation path can have different growth and policy implications.
Central banks also commonly use scenario analysis to explain how structural shifts can affect the economic outlook. A typical example would be to compare the standard effects of a positive aggregate demand shock with an alternative where higher inflation leads firms to adjust their prices more often. More frequent price changes can strengthen the relationship between economic slack and inflation. Such a scenario can be constructed by applying the same sequence of aggregate demand shocks as in Graph 4.A to a model with a steeper Phillips curve (Graph 4.C).
The examples in Graph 4 also illustrate two key challenges central banks face when presenting scenarios: selecting and scaling them. When the economy faces large, discrete and identifiable sources of uncertainty, the choice of scenarios can be straightforward. For example, in early 2025 many central banks presented scenarios illustrating the effects of trade tariffs. At other times, the central bank must decide which of the many sources of uncertainty to highlight. Because central banks rarely present more than one or two scenarios at a given time, this choice can raise the profile of particular risks, possibly at the expense of other, equally impactful ones. Indeed, this may explain why some central banks publish scenarios on an ad hoc basis rather than releasing them routinely.
The scaling – or calibrated severity – of a given scenario is typically at the discretion of the central bank. In making this choice, central banks must balance assessments about the likelihood of the scenario with the information it provides. Scenarios that are scaled so that they cluster around the central forecast are arguably more likely to occur but may provide relatively little information value. Still, these scenarios can be useful for central banks, as they show the most likely ways in which economic outcomes – and hence policy settings – could differ from the central forecasts.
Scenarios scaled to present more meaningful departures from the central forecasts may allow the central bank to provide more information about material risks to the outlook. The drawback is that such scenarios may seem too unlikely to matter in practice. The lower aggregate supply scenario in Graph 4.A requires an unusually large sequence of shocks, while the increase in the steepness of the Phillips curve in Graph 4.C far exceeds typical empirical estimates of this parameter. Calibrating shock sequences or changes in Phillips curve parameters to historical estimates would yield much smaller departures from the central forecast.13
Communicating the policy response
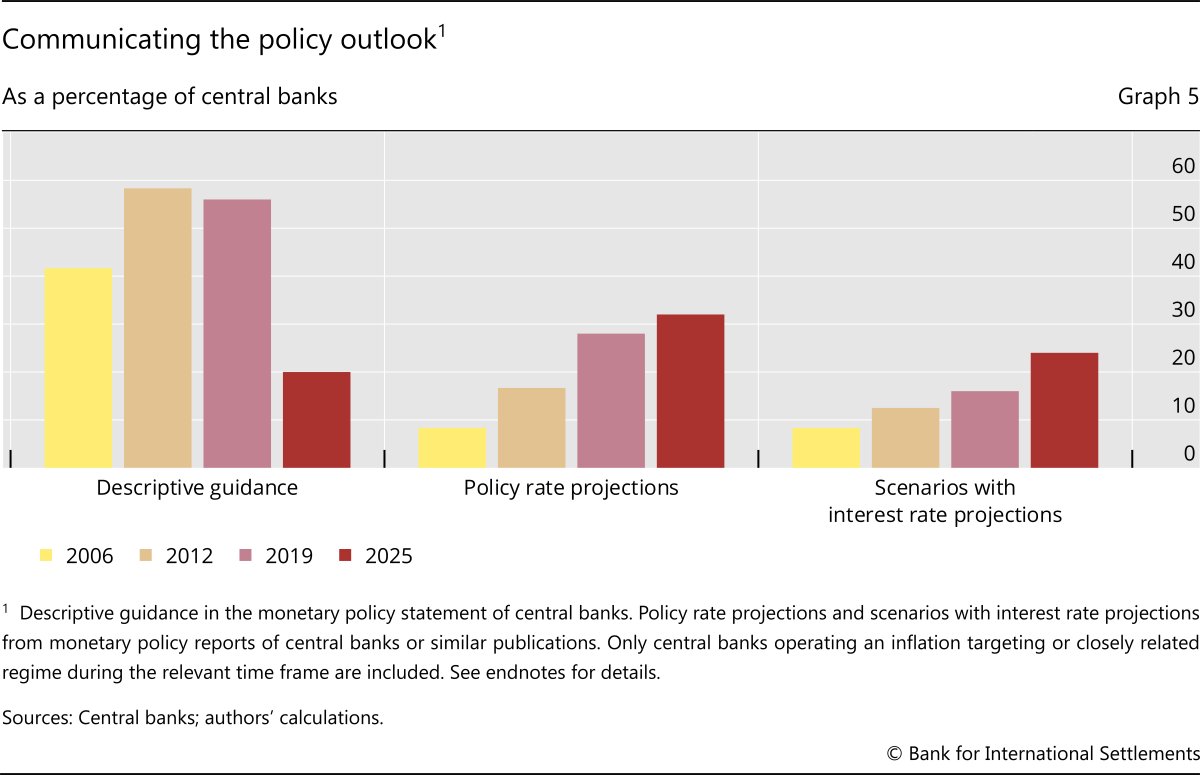
In 2025, providing explicit guidance about future policy rates in any form was relatively uncommon (Graph 5, red bars). Around half of the central banks in our sample did not provide descriptive guidance or publish a policy rate path. And no individual form of guidance was used by more than a third of them.
Communication practices about the policy response have shifted notably over time. Until recently, many central banks provided descriptive policy rate guidance.14 This was particularly widespread in the 2010s, when more than 55% of central banks in our sample provided guidance, compared with only 20% in 2025 (Graph 5). Meanwhile, the share of central banks publishing a forecast path for their own policy rate or presenting scenarios with an accompanying policy rate path has risen steadily. That said, these tools are still employed by only a minority of our sample of central banks.
Changes in communication practices about the policy outlook also reflect, in part, perceived shifts in the nature of uncertainty. The widespread use of descriptive guidance in the 2010s was closely tied to the post-GFC low interest rate environment, when such communication helped to lower the public's interest rate expectations and hence longer-term yields. At that time, perceived risks were skewed to the downside. Developments calling for rapid tightening were seen as unlikely, while the effective lower bound on policy rates raised concerns that central banks could respond less forcefully to negative inflation surprises than to positive ones. In this environment, the perceived costs – chiefly reduced policy flexibility – of lowering general uncertainty about future policy by signalling that interest rates would remain low (potentially subject to certain conditions) were judged small relative to the benefits of additional stimulus.15
The post-Covid inflation surge revealed the drawbacks of descriptive guidance. Even when such guidance is explicitly tied to specific economic developments, the public often views it as an unconditional commitment to a certain policy path. This may constrain the central bank's perceived room for manoeuvre when economic conditions suddenly change, or it may erode the central bank's credibility if the public feels it has reneged on its policy commitments.16
In place of descriptive guidance, many central banks have recently emphasised the "data dependent" nature of their decisions. In doing so, they have underscored that the general uncertainty about the economic outlook implies a degree of uncertainty about future policy. The more widespread publication of the central bank's policy rate projections as well as variations of the path under different scenarios is consistent with this greater emphasis on the conditionality, or data dependence, of the policy rate outlook.
Publishing the central bank's own policy rate projection also provides a degree of quantitative forward guidance, which may help to shape financial market expectations (Rudebusch and Williams (2008)). Unlike some forms of descriptive guidance, however, policy rate projections are explicitly tied to the central forecast, underscoring their conditionality. Indeed, one possible use of policy rate projections is to present an empirically testable link between the policy rate forecast and the forecast for inflation and real economic activity (Hofmann and Xia (2022)). In this way, interest rate paths may help reduce uncertainty about the central bank's reaction function and its assessment of monetary policy transmission.17
However, there are also potential drawbacks associated with publishing the central bank's own policy rate projection. Financial market participants may focus on it excessively, reducing the information content of market prices and making it hard for the central bank to deviate. Conversely, the central bank may face reputational risks if deviations from the projected interest rate path create the perception that it is unable to forecast its own policy rate accurately. This may explain why, despite an uptrend in the use of the tool, the number of central banks that publish a policy rate projection is still relatively small.18
Scenarios with variations in the policy rate path may also help to highlight the conditionality of the baseline path and further clarify the central bank's reaction function. By linking the policy response to a particular scenario, this approach can reinforce the message that future policy depends on economic developments.19 Such scenarios can further help markets and the public to anticipate how potential developments would be factored into policy decisions. It can also underscore the central bank's willingness to take necessary measures to achieve its objectives, helping to anchor inflation expectations.
However, this communication tool also poses challenges. A fundamental one is that it may be hard for the central bank to predict how policy would evolve in a hypothetical situation. A common approach is to apply a "policy rule" that maps the policy stance to macroeconomic variables, such as inflation or GDP growth. Often, these rules are estimated based on the central bank's past behaviour. While simple and transparent, it can be difficult to capture succinctly the full range of considerations that policymakers take into account, such as financial conditions. Hence, estimated policy rules may provide a poor guide to the central bank's actual actions if faced with a given scenario.
A second issue with presenting scenarios with a policy response is that policy rates both affect other economic variables and are affected by them. This circular relationship means that the choice of policy rule can fundamentally shape the nature of the scenario that is communicated. For example, Graph 6 shows a scenario featuring a demand shock that, holding other factors equal, would raise inflation by 2 percentage points across the next two years. Higher inflation, however, naturally prompts a higher policy rate, which reduces the rise in inflation by half. Instead of representing a surge in inflation and GDP growth that poses a material risk to the forecast (Graph 6, orange lines), the scenario displays a relatively modest forecast miss (green lines). While presenting the scenario in this way can help the central bank reinforce its commitment to do what is required to meet its inflation objective, showing an inflation path that is close to the central scenario might lead some observers to question why tighter policy is necessary.
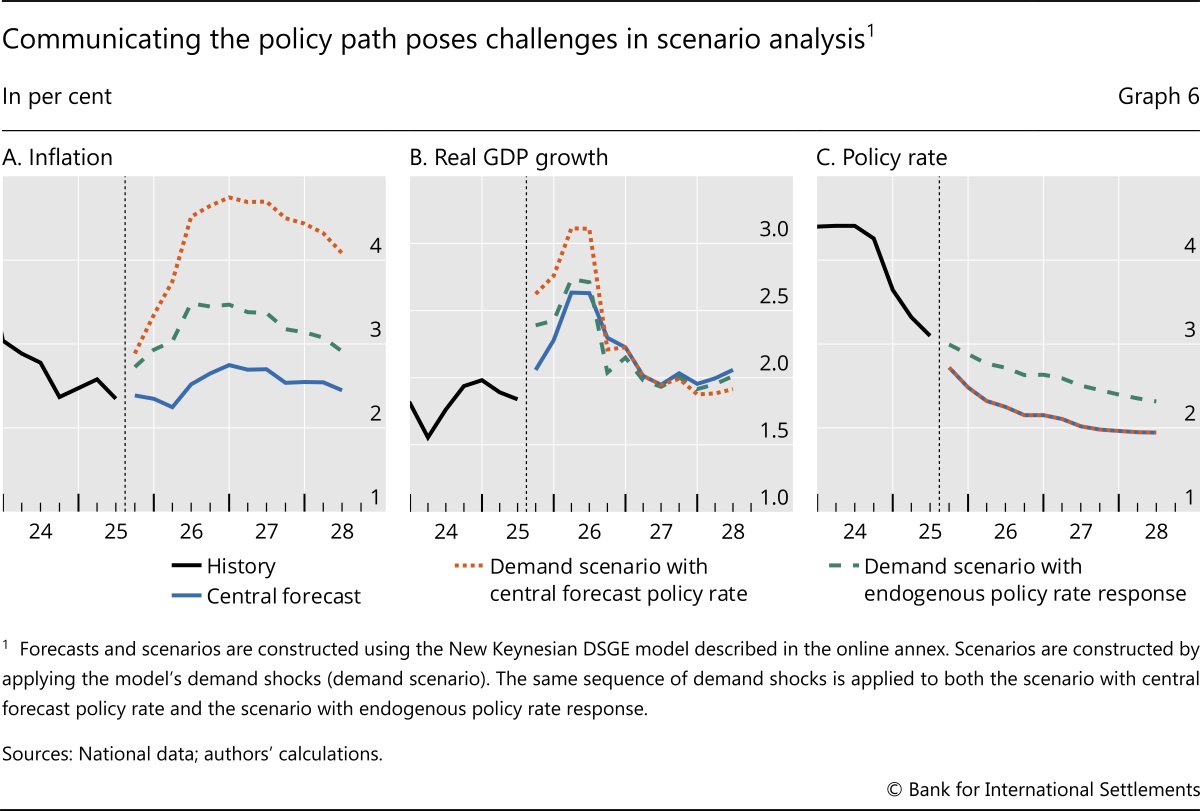
These challenges may explain why many central banks that present scenarios assume that policy follows the same path as the central forecast. While scenarios that do not present an endogenous policy rate path cannot provide concrete guidance about the central bank's reaction function, they can highlight the costs of not adjusting policy as conditions change, creating a rationale for action if the scenario actually arises. That said, there is a risk of suggesting that the central bank would be unable or unwilling to meet its inflation objectives if the scenario occurred, potentially weakening inflation expectations. To mitigate this, the central bank could present the scenario with both a policy reaction function and a rate path that matches the central forecast.
Conclusion
Central banks' approaches to addressing uncertainty about the economic outlook and the policy response in their public communication have evolved over time. This article documents this evolution and links it to the characteristics of different communication tools and the changing nature of uncertainty. A key conclusion is that no single tool is right for all situations. Each has distinct strengths and weaknesses that vary with the context, and none can address all forms of uncertainty. Nonetheless, understanding these characteristics can help central banks use the most appropriate tool, or combination of tools, for communicating the perceived uncertainty they face at a given time.
Looking ahead, central banks will likely need to continue adapting their communication approaches to address uncertainty as it evolves. In doing so, three tasks will be central: (i) identifying clear objectives and measures of successful communication; (ii) assessing the effectiveness of existing approaches, and potentially innovative new tools, against these objectives; and (iii) deploying communication approaches to support desired policy outcomes.
Endnotes
Graph 1.A: Sample includes AU, BR, CA, CH, CL, CO, CZ, EA, GB, HU, IL, IN, IS, JP, KR, MX, NO, NZ, PE, PL, RO, SE, TH, US and ZA.
Graph 1.B: Sample includes AU, CA, CH, DE, EA, ES, FR, GB, HK, IE, IN, IT, JP, MY, NO, PH, SE, SG, US and ZA.
Graph 2: Sample includes AU, BR, CA, CH, CL, CO, CZ, EA, GB, HU, IL, IN, IS, JP, KR, MX, NO, NZ, PE, PL, RO, SE, TH, US and ZA.
Graph 5: Sample includes AU, BR, CA, CH, CL, CO, CZ, EA, GB, HU, IL, IN, IS, JP, KR, MX, NO, NZ, PE, PL, RO, SE, TH, US and ZA.
References
Amaral, E, F Avalos and I Shim (eds) (2025): "Monetary policy decision-making and communication under uncertainty", BIS Papers, no 163, December.
Bauer, M, T Berge, G Fiori, F Loria and M Zhong (2025): "Accounting for uncertainty and risks in monetary policy", Finance and Economics Discussion Series, no 2025-73.
Bernanke, B (2007): "Monetary policy under uncertainty," speech delivered at the 32nd Annual Economic Policy Conference, Federal Reserve Bank of St. Louis, 19 October.
----- (2024): Forecasting for monetary policy making and communication at the Bank of England: a review, Independent Evaluation Office, Bank of England, April.
----- (2025): Improving Fed communications: a proposal from Ben Bernanke, Brookings, May.
Blinder, A, M Ehrmann, M Fratzscher, J De Haan and D-J Jansen (2008): "Central bank communication and monetary policy: a survey of theory and evidence", Journal of Economic Literature, vol 46, no4.
Blinder, A, C Goodhart, P Hildebrand, D Lipton and C Wyplosz (2001): "How do central banks talk?", Geneva Reports on the World Economy, no 3, Centre for Economic Policy Research.
Campbell, J, C Evans, J Fisher and A Justiniano (2012): "Macroeconomic effects of Federal Reserve forward guidance", Brookings Papers on Economic Activity, Spring.
Committee on the Global Financial System (2019): "Unconventional monetary policy tools: a cross-country analysis", CGFS Papers, no 63, October.
Filardo, A and B Hofmann (2014): "Forward guidance at the zero lower bound", BIS Quarterly Review, March.
Hernández de Cos, P (2025): "Delivering on central bank mandates in a changing world", speech at the Bank of Mexico 100th Anniversary Conference, Mexico City, 26 August.
Hofmann, B and D Xia (2022): "Quantitative forward guidance through interest rate projections", BIS Working Papers, no 1009, March.
Hunter, S (2024): "Shedding light on uncertainty: using scenarios in forecasting and policy", speech at the University of Adelaide South Australian Centre for Economics Studies Lunch, Adelaide, 13 December.
Kase, H, L Melosi and M Rottner (2025): "Estimating nonlinear heterogeneous agent models with neural networks", BIS Working Papers, no 1241, January.
Knight, F (1921): Risk, uncertainty and profit, Hart, Schaffner & Marx; Houghton Mifflin Co.
Koyuncu, B, B Kwon, M Lombardi, F Perez-Cruz, and H Shin (2026): "BISTRO: a general purpose oracle for macroeconomic time series", BIS Quarterly Review, March.
Kozicki, S and J Vardy (2017): "Communicating uncertainty in monetary policy", Bank of Canada Staff Discussion Papers, no 2017-14, November.
Lane, P (2024): "Monetary policy under uncertainty", keynote speech at the Bank of England Watchers' Conference, London, 25 November.
Lombardelli, C (2025): "What if things are different?" speech at the Bank of England Watchers' Conference, London, 25 November.
Park, T, F Perez-Cruz and H Shin (2025): "Mapping the space of central bankers' ideas", BIS Working Papers, no 1299, October.
Reserve Bank of Australia (2022): Review of the RBA's approach to forward guidance.
Rudebusch, G and J Williams (2008): "Revealing the secrets of the temple: the value of publishing central bank interest rate projections", in Campbell (ed), Asset prices and monetary policy, National Bureau of Economic Research.
Footnotes
1 The views expressed in this publication are those of the authors and not necessarily those of the BIS or its member central banks. We thank Anamaria Illes for excellent research support. For insightful comments, we thank Eduardo Amaral, Claudio Borio, Gaston Gelos, Emmanuel Kohlscheen, Marco Lombardi, Benoît Mojon, Alejandrina Salcedo, Andreas Schrimpf, Frank Smets, Ilhyock Shim and Hyun Song Shin. All remaining errors are our own.
2 See Blinder et al (2008) for a more detailed discussion.
3 See eg Bernanke (2024, 2025), Hunter (2024), Lombardelli (2025), Hernández de Cos (2025), Bauer et al (2025), Amaral et al (2025) and Lane (2024).
4 We include the central banks of Australia, Brazil, Canada, Chile, Colombia, Czechia, euro area, Hungary, Iceland, India, Israel, Japan, Korea, Mexico, New Zealand, Norway, Peru, Poland, Romania, South Africa, Sweden, Switzerland, Thailand, the United Kingdom and the United States.
5 Central banks also use other important communication vehicles to convey their views and the rationale behind their decisions, notably press conferences, publication of minutes of monetary policy meetings, and speeches. However, the monetary policy report and monetary policy statements are the primary vehicles for communicating the central bank's views on uncertainty about the economic outlook and the outlook for monetary policy.
6 See eg Kozicki and Vardy (2017) for a more detailed discussion.
7 These forecast errors can occur because the central bank (and the private sector) has incomplete information about the model of the economy or because of unanticipated developments.
8 For example, the "Key risks to the outlook" section of the latest Reserve Bank of Australia monetary policy report highlights issues such as the strength of household demand, labour market tightness and global growth prospects. The Brazilian central bank's report distinguishes between upside and downside inflation risks (eg due to a prolonged de-anchoring of inflation expectations or a steeper global slowdown).
9 See Campbell et al (2012).
10 We consider here only projections of the policy rate (or closely related short-term interest rate) made by the central bank itself and not technical assumptions (eg a constant interest rate assumption) or projections based on an external source (eg financial market pricing).
11 Some central banks present scenarios irregularly. For example, in recent years the Reserve Bank of Australia has presented them only in its May and November monetary policy reports, while the Bank of Canada presented scenarios in April 2025 to illustrate the effects of trade tariffs.
12 The Central Bank of Norway, for instance, presents its main economic forecasts at the beginning of its monetary policy report as point forecasts and shows fan charts towards the end of the report as part of a discussion of historical forecast errors. Until recently it had suspended fan charts in the wake of the Covid-19 pandemic.
13 A further challenge with more extreme scenarios is that they can be hard to implement with standard analytical tools and models and may call for the development of more advanced techniques. See eg Kase et al (2025) and Koyuncu et al (2026) for recent advances in structural and time series modelling.
14 Defined as a qualitative indication of the likely direction for future policy in the monetary policy statement.
15 See Committee on the Global Financial System (2019).
16 Filardo and Hofmann (2014) provide an early assessment of different forms of forward guidance at the zero lower bound. See also Reserve Bank of Australia (2022) for a detailed discussion of the RBA's experience with forward guidance.
17 Inferring the central bank's reaction function from projections of the policy rate and relevant macro variables may still be complicated if the public is unsure of the central bank's estimate of the long-run natural interest rate.
18 For a more detailed discussion of these issues, see Hofmann and Xia (2022) and the references therein.
19 Such information may be particularly useful for extreme scenarios that may prompt the central bank to depart from its usual policy reaction function to limit the likelihood of particularly adverse outcomes.