Volatility challenges risk-taking
The risk-on mood that prevailed for much of the review period1 in global financial markets faced mounting challenges from spells of market volatility. These coincided with broader policy uncertainty amid growing concerns about an economic slowdown and unease around stretched equity valuations. Yet despite some retrenchment, valuations of risk assets remained at historically elevated levels, prompting questions about the consequences of any swing in investor sentiment.
The artificial intelligence (AI)-related boom in equity prices continued to shape financial market developments. Large cap technology stocks continued to outperform for much of the review period, buoyed by strong earnings. However, they showed signs of retrenchment towards the end of the period due to greater investor wariness about stretched valuations. Japanese stocks rallied following political changes, which raised expectations of an expansionary fiscal stance. European stocks similarly benefited from positive sentiment. Equity prices in emerging market economies (EMEs) rallied and in many cases posted larger gains than in advanced economies. Nevertheless, the positive tone was punctuated by episodes of volatility.
Credit markets were mostly unswayed by equity market volatility. Credit spreads remained compressed, even if some cracks started appearing in the weakest segments of credit markets. Following highly publicised defaults in October, leveraged loan spreads edged up, with some spillovers to investment vehicles providing credit via private markets. Yet these tremors proved short-lived and did not lead to any impairment of primary corporate credit markets.
Expectations of future monetary policy easing helped to keep long-term rates in check and provided a cushion to risk asset valuations. While the Federal Reserve cut rates twice, a lack of hard data due to the US government shutdown injected some uncertainty over the policy path ahead. Nevertheless, weakening labour markets and a restrained outlook for inflation led market participants to anticipate further cuts in the medium run. Amid upward pressure on repo rates and volatility in money markets, the Federal Open Market Committee (FOMC) announced that it planned to halt its balance sheet reduction in December. After having cut their policy rates at an earlier stage, other major central banks stayed on hold, but signalled readiness to provide support should economic conditions deteriorate. These developments were reflected in largely stable longer-term bond yields across many jurisdictions, despite growing strains on fiscal balances.
In the early part of the review period, gold prices surged in parallel with other risk assets. This is at odds with the historical pattern of lacklustre gold performance during risk-on phases. Appetite for precious metals may underscore market participants seeking at least some safe asset exposure in the event that things turn sour. But part of the surge can also be traced to investors trying to take advantage of the momentum in search of price appreciation, consistent with elevated risk-taking.
The US dollar halted the downward path it had entered in April and recovered some ground. It appreciated vis-à-vis major advanced economy currencies – and especially so against the Japanese yen and other Asian currencies, while depreciating against Latin American ones.
Key takeaways
- Strong risk sentiment and expectations of policy easing supported risk assets, but growing wariness and higher volatility increasingly challenged the risk-on mood.
- Despite some tensions in US money markets and lingering fiscal concerns in some countries, bond yields moved sideways amid expected monetary easing.
- Emerging market economy assets weathered the trade tensions and benefited from benign investor risk sentiment.
Risk assets held ground despite growing concerns
Over the review period, investors' risk appetite was challenged by bouts of volatility ignited by renewed trade conflicts, mounting concerns about stretched valuations in parts of the equity market and fiscal woes in certain jurisdictions. That said, the risk-on mood proved resilient, hence risk asset valuations remained elevated, and tech stocks even posted additional gains.
The buoyancy in equity markets that characterised the last review period broadly carried over, even as concerns about a potential overvaluation of US tech stocks grew and resulted in higher volatility. Strong risk appetite, aided by solid earnings, propelled US equity markets to new all-time highs (Graph 1.A, red line). European equities also rallied, in lockstep with their US counterparts, despite weaker earnings growth (blue line). Japanese equities saw a particularly strong rise (purple line), boosted by political developments and their overall attractiveness to international investors. Towards the end of the review period, global equity prices underwent a correction amid spells of volatility, but nevertheless posted gains compared with the beginning of the review period. Most major EME equity indices also gained ground during the review period. Asian equity markets weathered the US-China trade tensions well and gained momentum as they waned. Korean equity markets, in particular, posted double-digit returns on the back of the strong performance of semiconductor stocks. In Latin America, the Argentine and Brazilian stock markets had a sustained rally.
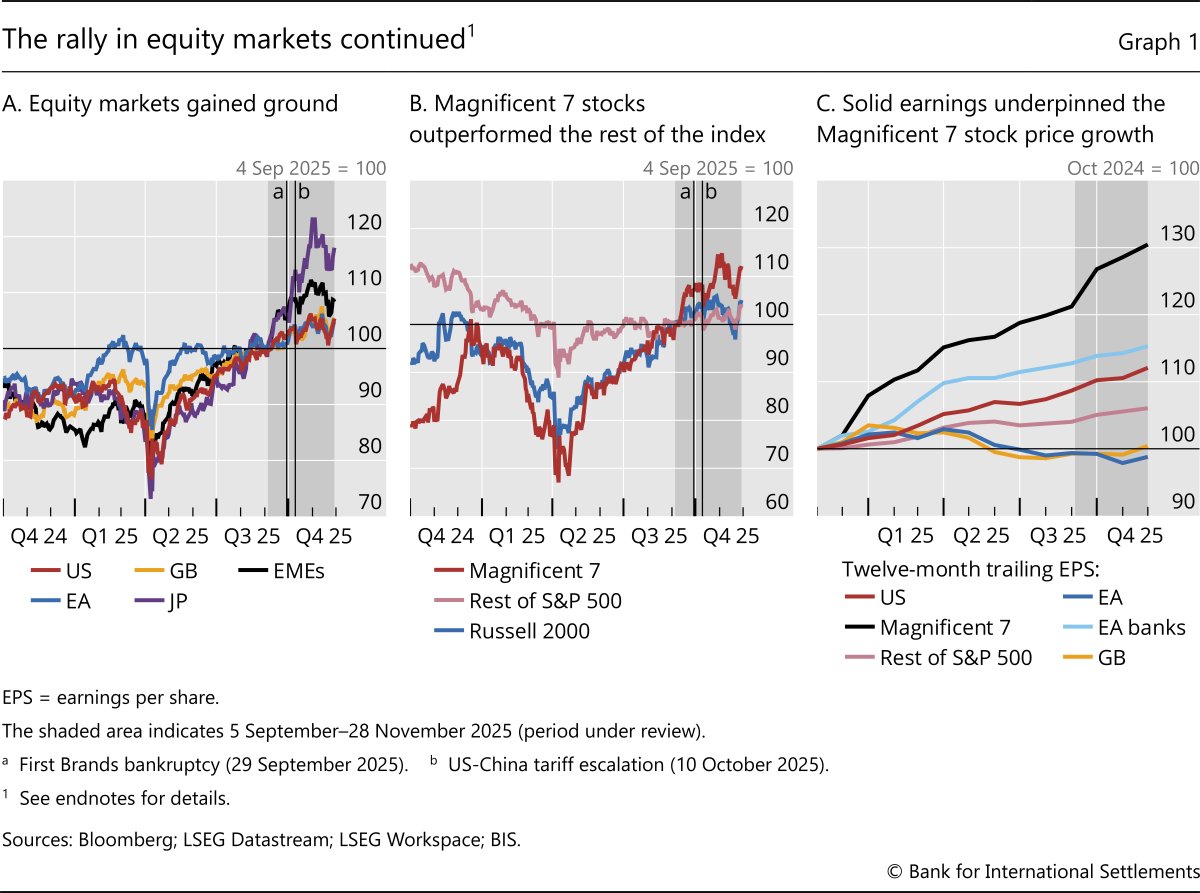
The "Magnificent 7" (M7) stocks continued to outperform the rest of the index (Graph 1.B). The recent rally in M7 stock prices was fuelled by both optimistic expectations about the future profitability of AI and data centre investment and solid earnings growth (Graph 1.C). This is dissimilar to the dotcom bubble of the late 1990s, which was largely fuelled by over-optimistic expectations that were not underpinned by realised earnings growth. Nevertheless, the rally of M7 stocks has raised concerns about stretched valuations and the risks a price correction would entail for the broader stock markets and the economy.
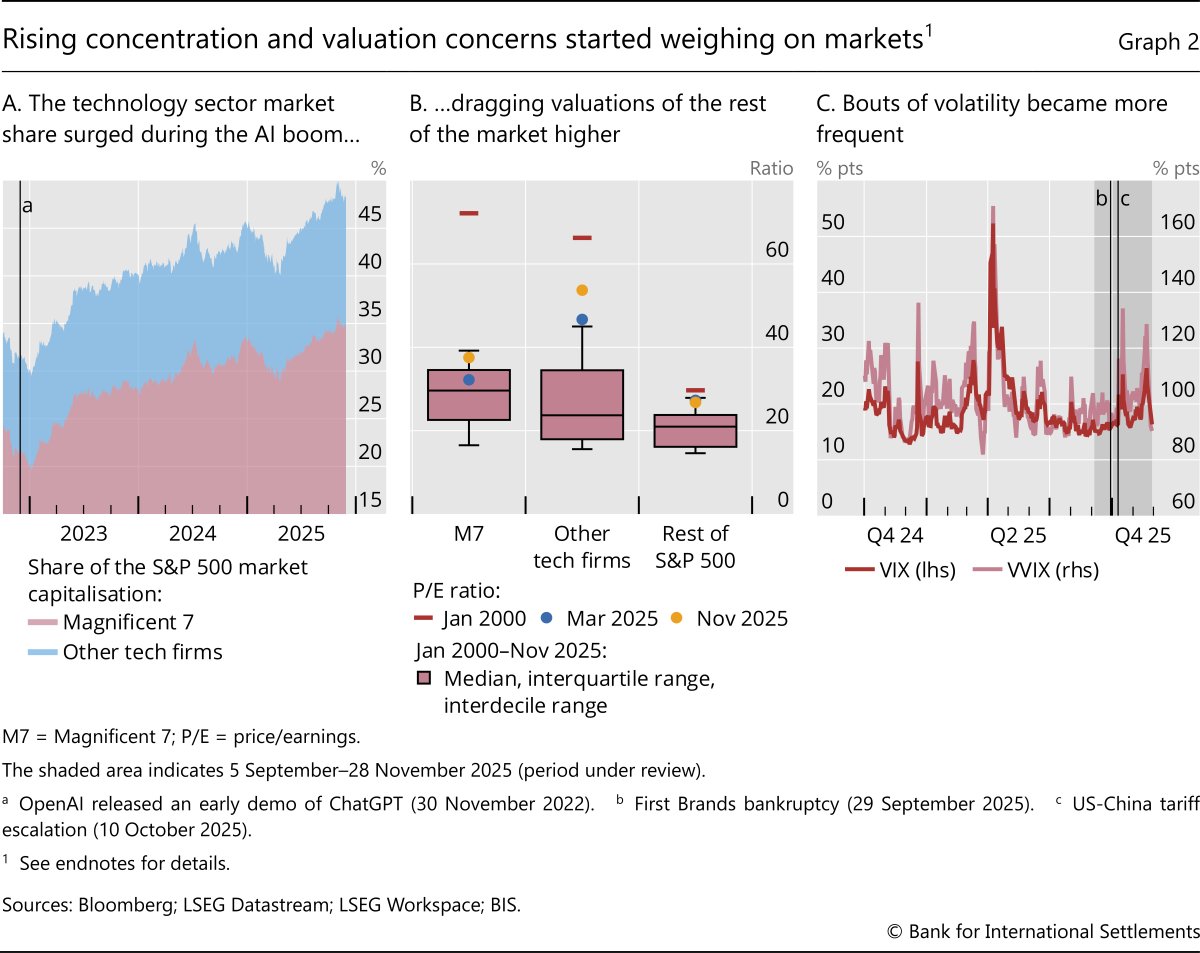
As a consequence of their price surge, the weight of M7 stocks in the broad S&P 500 index has become sizeable. Since the first breakthroughs in mainstream use of AI, the M7 share in the total index market capitalisation has grown to nearly 35%, from about 20% in November 2022 (Graph 2.A, red area). M7 stocks became a linchpin for other tech stocks, whose share in market capitalisation also grew by 5 percentage points, from 10% to about 15% (blue area).
The tech industry's increasing share in the overall market capitalisation magnifies risks of spillovers to risk assets more generally, should investors reassess their expectations about their profitability. While so far isolated disappointing news on the earnings of certain firms did not spill over to the broader M7 or tech sector, some of the recent bouts of volatility can be traced to mounting concerns over the profitability of massive investments in data centres and AI-related technologies.
The attractiveness of the returns on tech stocks, as well as on US equities more generally, fuelled portfolio inflows. Flows into US equities rebounded strongly in mid-September 2025, particularly within the exchange-traded fund (ETF) segment, and outpaced those into European markets. Yet these recent inflows into equities were characterised by some divergence across investor types: retail investors continued to pour money into US equity funds, even as institutional investors gradually withdrew.
Driven by the rally, valuations of tech firms have become hefty by historical standards. While still well below the levels reached at the peak of the dotcom bubble, price/earnings multiples have been approaching the top 10% of the historical distribution for the M7 (Graph 2.B, yellow dots), significantly above the levels before the tariff turbulence (blue dots). What is more, the valuations of other tech firms, with a less established earnings track record than the M7, have been dragged even higher, approaching the levels reached at the peak of the dotcom bubble (red dash). Although the rest of the S&P 500 index posted smaller gains, aggregate valuations also appear elevated by historical norms, arguably because of more lacklustre growth in the earnings of non-tech sectors in the index. The M7's performance also stands out from a cross-country perspective, as these firms have exhibited notably different performance over time compared with, for instance, their Chinese peers (Box A).
As is commonplace in a late-cycle risk-taking environment, volatility ticked up amid more frequent flare-ups. The VIX experienced several notable spikes, and touched a seven-month high, driven by renewed US-China trade tensions, as well as concerns about frothy equity valuations (Graph 2.C, red line). The bankruptcies of First Brands and Tricolor affected financial institutions with direct exposure to these businesses but did not lead to broader contagion. The disclosure of borrower fraud at two US regional banks, sparked a wider sell-off, fuelled by concerns over the health of regional lenders. However, neither of these episodes led to major spillovers beyond the sector, even though they might herald the possibility of further credit market strains. While all these bouts of volatility were short-lived, volatility overall settled at a somewhat higher level. Forward-looking measures of VIX volatility (pink line) witnessed similar upsurges, reflecting shifting market expectations of such spikes being more frequent in the future.
Corporate credit markets in advanced economies appeared rather insulated from equity market volatility and generally retained a risk-on mood, while in EMEs risk-appetite was more fragile. Investment grade credit spreads hovered well below the historical norms in both the United States and the euro area (Graph 3.A). Consistently with this, common gauges of expected default probabilities actually fell in both the United States and Europe, reflecting the overall risk-on sentiment (Graph 3.B). In EMEs, corporate credit spreads edged higher on renewed trade tensions between the United States and China and remained elevated, particularly in Latin America, underpinning the fragility of the risk-on mood (Graph 3.C).
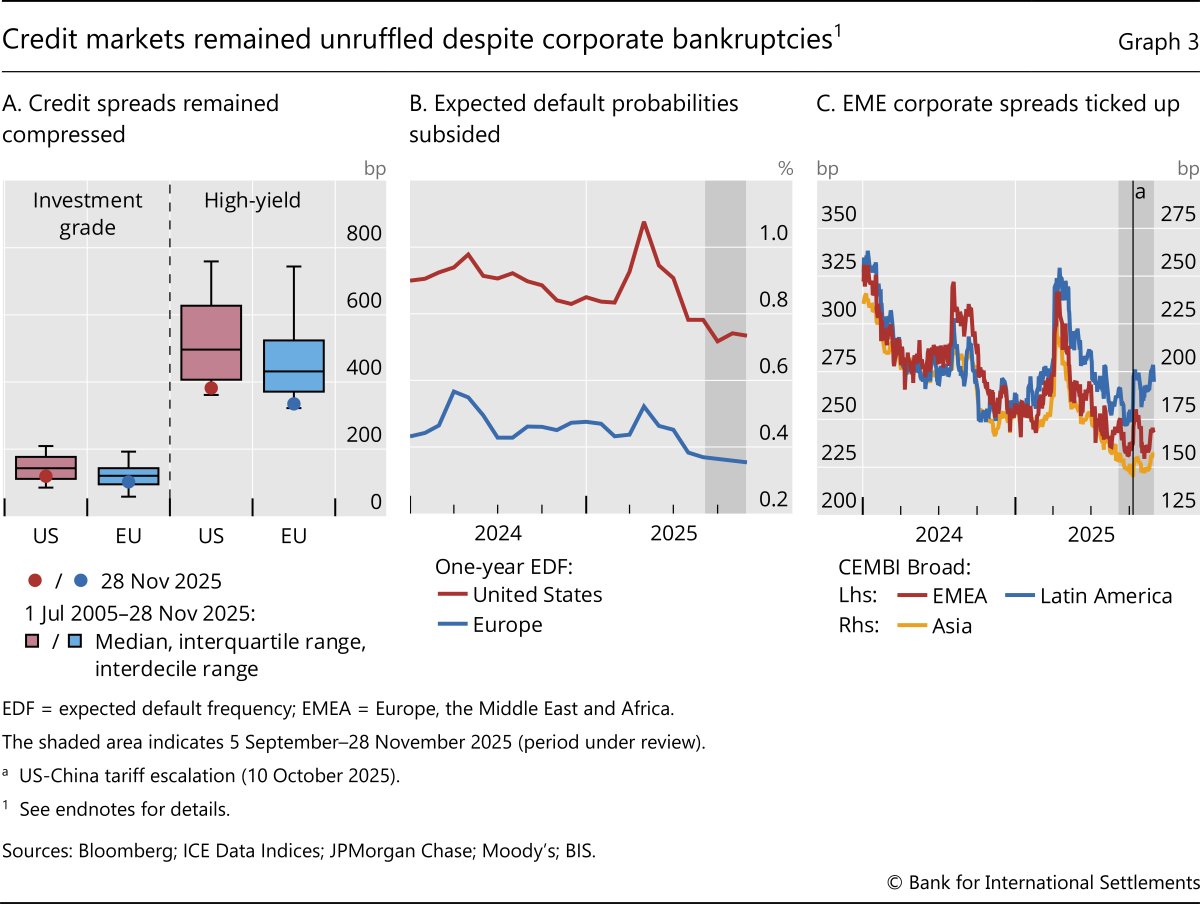
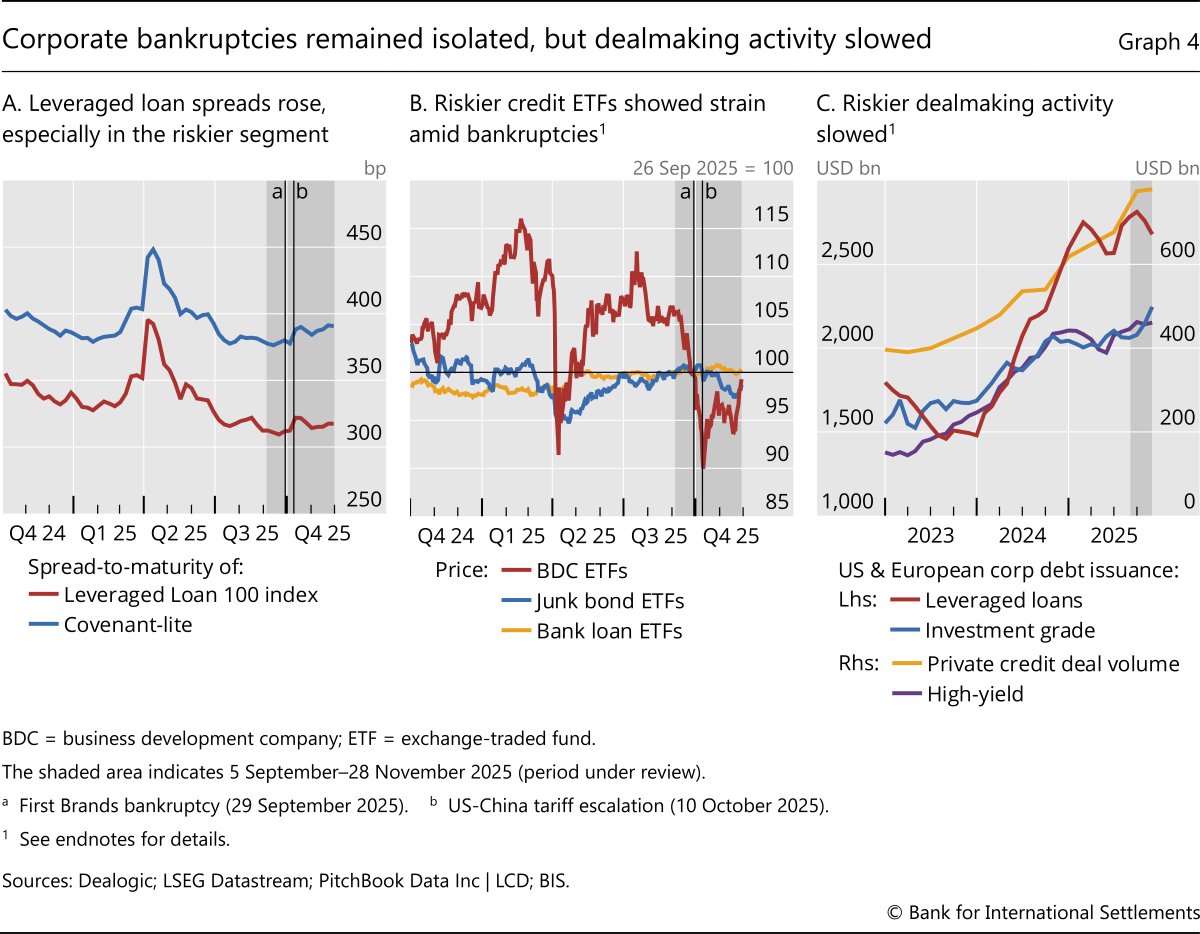
The isolated corporate bankruptcies had a stronger effect on riskier segments of credit markets. High-yield corporate credit spreads edged higher amid concerns about US regional banks, although they later retraced and remained close to historical lows (Graph 3.A). Leveraged loan spreads ticked up by 10 basis points in the weeks following the First Brands bankruptcy filing, while spreads on covenant-lite loans, the riskier subsegment, increased by nearly 15 basis points and settled at this higher level (Graph 4.A). ETFs tracking business development companies – investment vehicles providing credit in private markets – also showed signs of investors' unease regarding a possible deterioration in asset quality, while the asset price reactions in junk bonds and bank loan ETFs were more subdued. All these pressures in credit markets, while indicating increased wariness, were mostly short-lived (Graph 4.B), as risk-taking reasserted itself.
Against the backdrop of a somewhat higher pricing of risk, activity in primary markets for riskier credit instruments slowed. Mounting concerns about credit market quality were reflected in a slowdown in high-yield bond and leveraged loan issuance (Graph 4.C, purple and red lines). Private credit deal-making also cooled (yellow lines) amid concerns over a potential erosion in the lending standards in these transactions and growing awareness that the two recent bankruptcies may not have been isolated episodes. Moreover, recent issuances of corporate bonds by large tech firms to fund investment in data centres were not received favourably by markets, with spreads to government bonds ticking higher. While a swing in the risk-on mood might have far-fetched consequences for credit markets and broader financial conditions, the relatively subdued pace of credit growth compared with the run-up to the Great Financial Crisis could allay some concerns.
Sovereign yields moderate with monetary easing
US money markets also saw a pickup in volatility since September, with repo rates spiking. The SOFR spread – the difference between secured overnight financing rate and the effective federal funds rate – rose to levels not seen since March 2020 (Graph 5.A, red line). Such money market pressures reflected the interplay of demand and supply factors.
Tremors in dollar money markets occurred amid heightened demand for leverage via repo by the hedge fund sector. One highly leveraged strategy reliant on repo is the cash-futures basis trade. It involves purchasing a government bond while simultaneously selling the corresponding futures contract to pocket the small difference between the two prices.2 To fund the purchase of the security and lever up the trade, the hedge fund typically turns to borrowing via the repo market.3 This strategy has grown particularly rapidly during the quantitative tightening of the past two years (Graph 5.B). Pressures on Treasuries at longer maturities and bond markets more generally could occur should these trades be suddenly unwound due to a spike in derivatives margins or difficulties in rolling over repo borrowing.
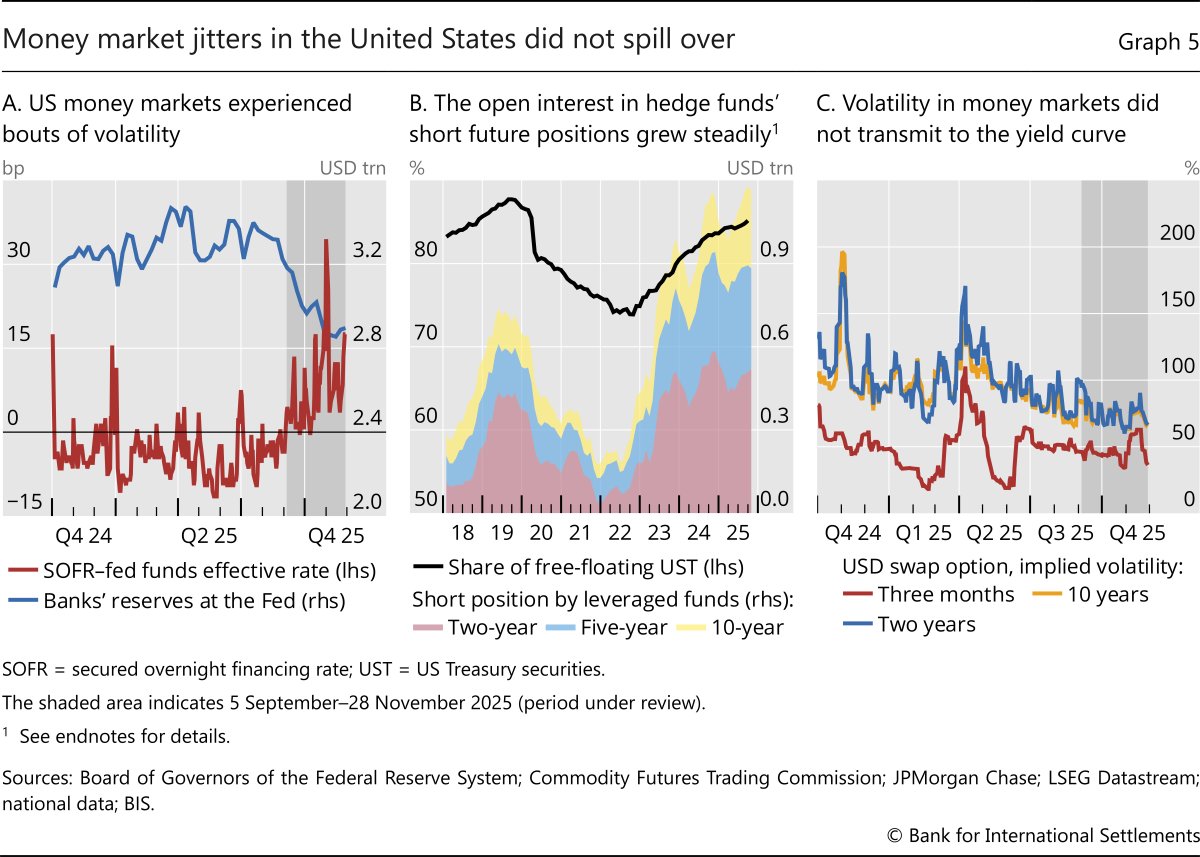
Against this backdrop of buoyant demand, shortfalls in funding supply appear to have further contributed to the repo pressures. Reserve balances held by the banking system were shrinking amid the Fed's quantitative tightening (Graph 5.A, blue line), with settlements of large issuances of shorter-term government paper being a further drain. Technical factors, such as the increases in the Treasury General Account due to the shutdown, as well as the end of the fiscal year for Canadian banks, further contributed to a relative shortage in liquidity versus collateral. In this context, the Fed decided to halt its balance sheet reduction operations as early as December.
So far, such money market pressures have not spilled over to other parts of the yield curve. Indeed, volatility in fixed income markets has remained subdued, underscoring investors' confidence in a benign outlook. Only the volatility at the very short end of the US Treasury yield curve appears to have increased visibly as money market volatility surged (Graph 5.C, red line), while that at longer maturities remained subdued by historical standards (blue and yellow lines).
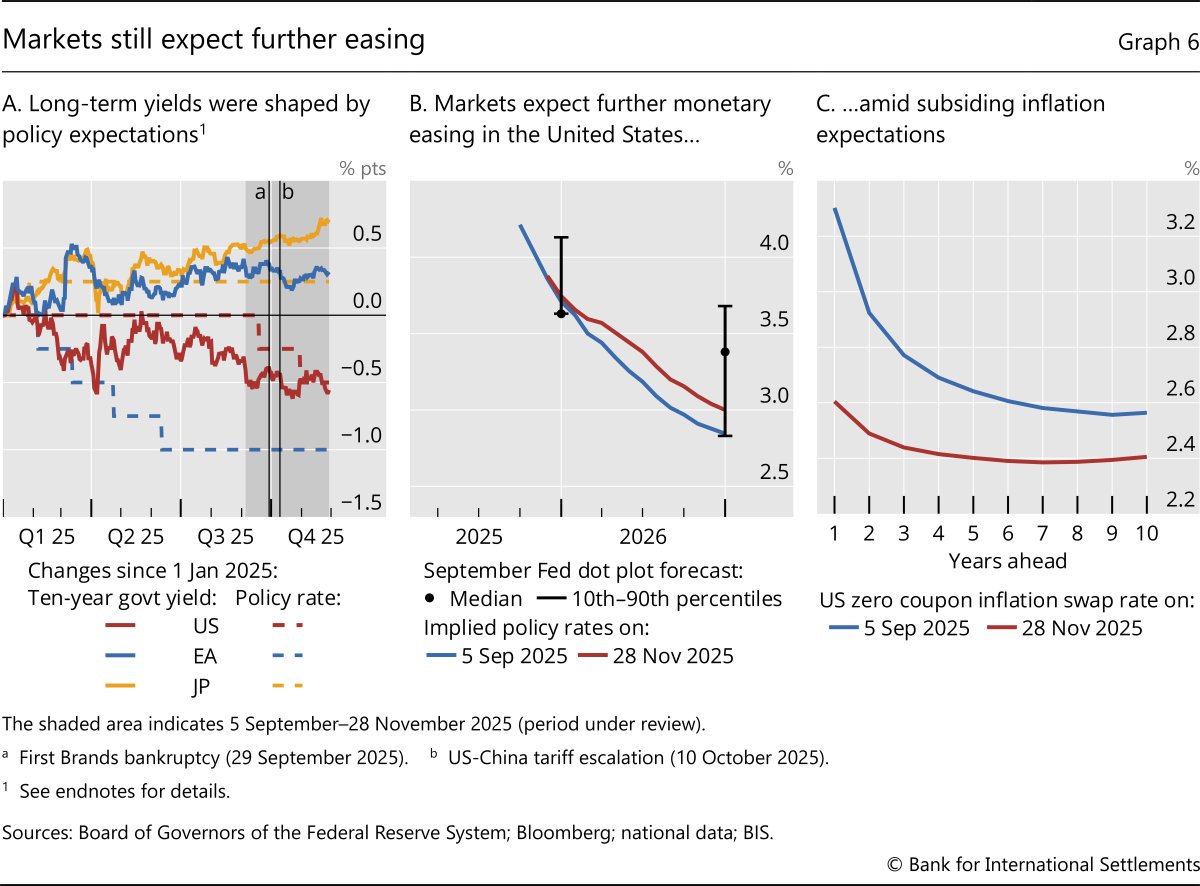
US and euro area government bond yields moved sideways in the review period (Graph 6.A, red and blue solid lines) as market participants weighed the monetary policy outlook in the short run. In the United States, the uncertainty was compounded by the lack of hard data releases due to the government shutdown. Expectations of further policy rate cuts waxed and waned amid a perceived hawkish tone in the October FOMC press conference and signs of a weakening labour market from alternative indicators. As a consequence, market expectations for policy rates in the year ahead rose and then partially subsided, but still lay well below the median of FOMC participants' forecasts made in September (Graph 6.B). Markets' optimism about the prospects for further policy easing was also underpinned by their implicit inflation outlook. The term structure of market-based inflation expectations for the United States substantially shifted downwards since September, especially in the short to medium run (Graph 6.C). Other major central banks kept policy on hold after many had eased their stance in the previous review period, but stood ready to deliver further easing should economic conditions deteriorate. One exception was Japan, where the central bank has adopted a cautious approach to policy tightening, and fiscal developments contributed to the rise in long-term yields (Graph 6.A, solid yellow line).
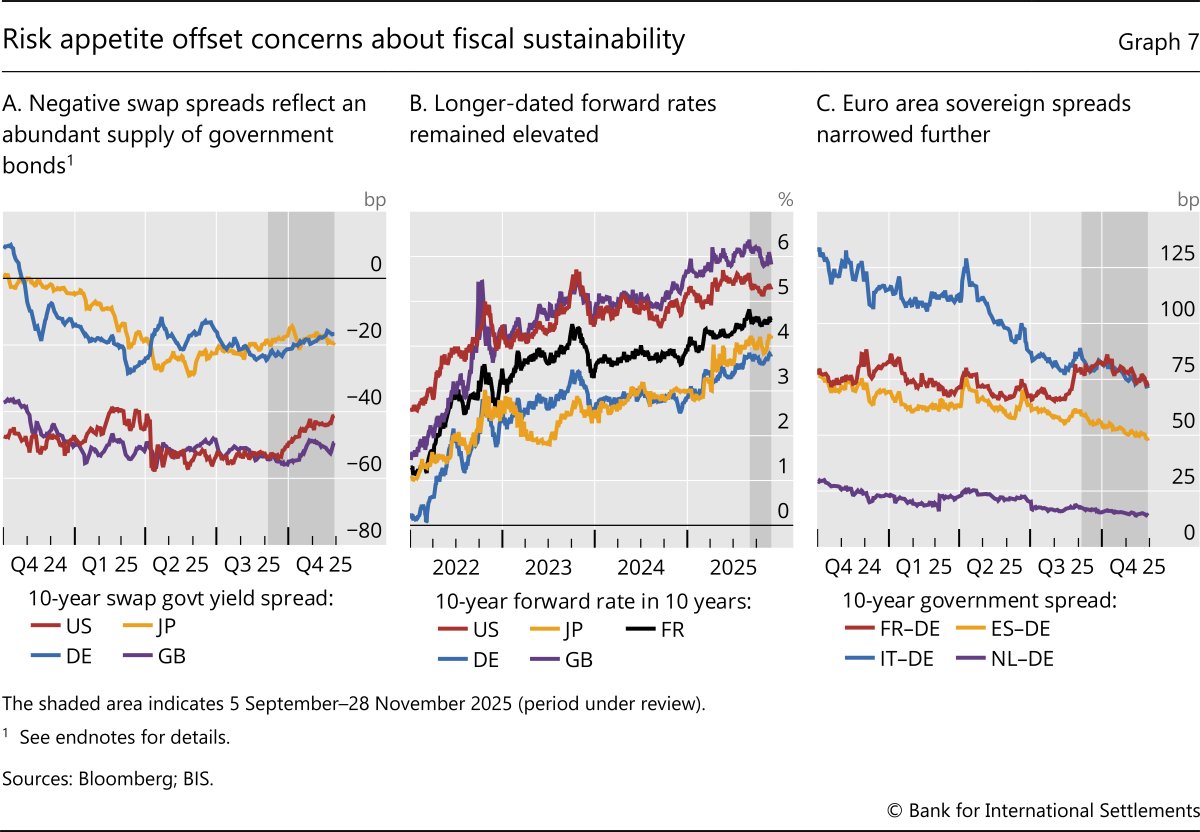
A relatively loose fiscal stance in several advanced economies was reflected in hefty issuance of public debt, particularly at short tenors. This, coupled with major central banks' unwinding of their balance sheets, led to a large supply of government bonds for markets to absorb. Reflecting such pressure, swap spreads remained persistently negative (Graph 7.A), indicating a negative convenience yield of holding government bonds (Box B). The resulting spread encourages hedge funds to engage in relative value trades using government bonds and interest rate swaps; the recent contraction in the US dollar swap spread hints indeed at greater hedge fund activity.4
Nevertheless, markets largely tuned out lingering concerns over the longer-term fiscal outlook. Ten-year average yields in 10 years, a gauge of longer-dated risk compensation, had been trending upwards for at least the last four years, reflecting growing investor concerns about fiscal sustainability (Graph 7.B). However, with the exception of Japan and Germany, this upward trend paused in the review period, possibly due more to limited issuance of long-term bonds than a waning of the underlying fiscal strains. Sovereign spreads in the euro area continued to narrow, partly because of the rise in German market-expected long-term rates (Graph 7.C). This includes France's sovereign spread against German bunds, which marginally declined over the review period, partly eroding the previous increases.
Precious metals and the US dollar appreciated
Precious metals saw an impressive rally in the early part of the review period, followed by a correction amid high volatility. Gold resumed its upward trajectory (Graph 8.A, red line), while other precious metals, such as silver, palladium and platinum, were also buoyant (yellow line).
Such strong performance sits oddly with precious metals' traditional role as safe haven assets. This should make them unattractive in a risk-on environment, in which other assets promise much higher returns. The appetite for precious metals may well reflect market participants seeking some safe asset exposure amid persistent fiscal strains and long-run inflation concerns. Another (non-mutually exclusive) explanation is that trend-chasing investors – notably retail – might have sought to capitalise on gold's momentum by engaging in speculative behaviour. Indeed, portfolio flow data show that inflows into retail ETFs and mutual funds tracking gold strongly rebounded in June and further accelerated in September, with some evidence for price pressure effects (Box C). Cryptocurrencies slumped towards the end of the review period: bitcoin, for example, shed about 20% (Graph 8.A, blue line). This might also be a sign of the growing fragility of the risk-on environment, and increased investor wariness over speculative assets.
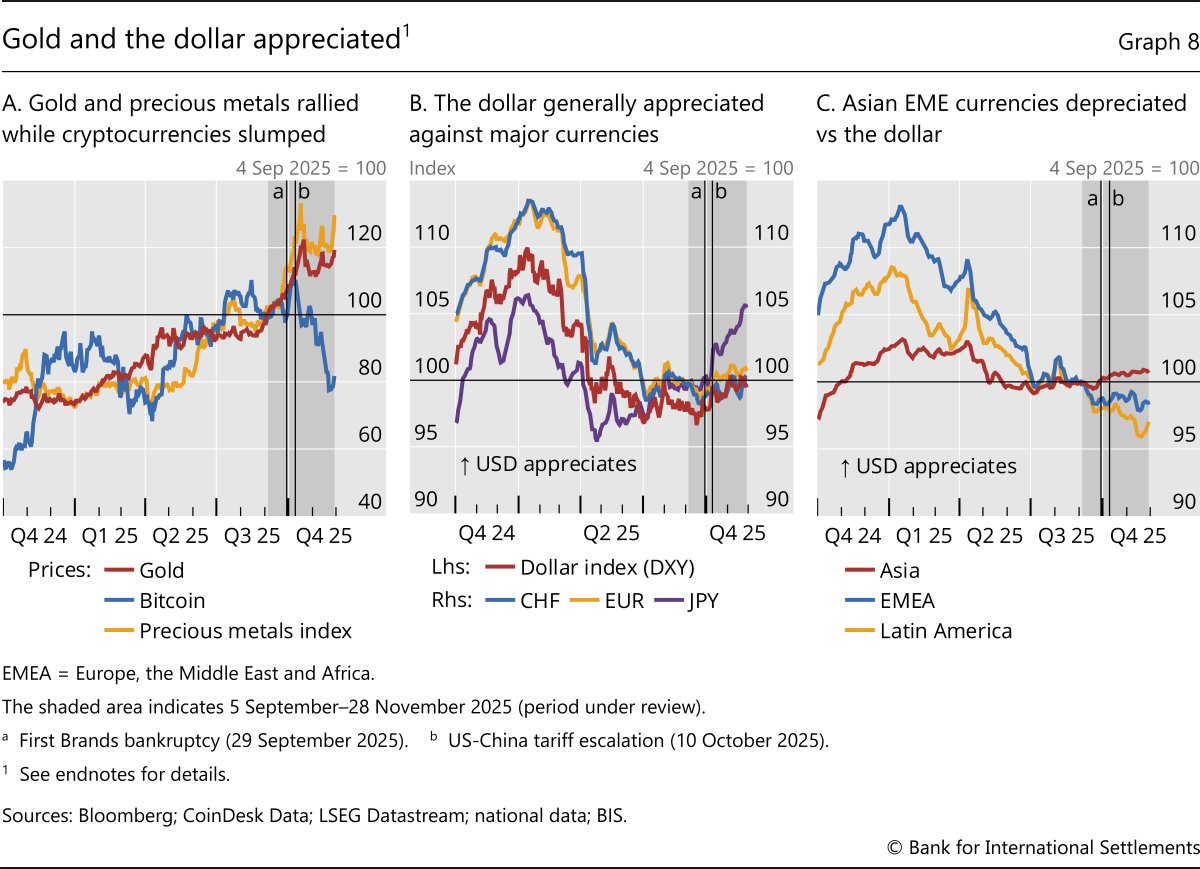
The US dollar halted the depreciation path it had entered in April and posted gains against other major currencies (Graph 8.B, red line). It appreciated markedly against the Japanese yen (purple line) due to Japan's fiscal woes weighing on the currency and the Bank of Japan proceeding cautiously with rate hikes. Other Asian currencies also lost some ground against the dollar (Graph 8.C, red line), while EMEA and Latin American currencies continued to appreciate (blue and yellow lines, respectively). Overall, the dollar appreciation follows the trend observed in the previous review period. At first glance, this seems somewhat at odds with the typical pattern observed in a heightened risk-taking environment. Yet it could also reflect the relative outperformance of the US economy and the greater optimism on the profit prospects of its tech sector. In the jargon of currency traders, this would signify that we are on the right side of the US dollar "smile", as opposed to its bottom, where risk appetite prompts investors to seek heftier yields abroad, leading to a dollar depreciation.
Endnotes
Graph 1.A: EA = STOXX Europe 600; EMEs = MSCI EM; GB = FTSE 100; JP = Nikkei 225; US = S&P 500.
Graph 1.B: Magnificent 7 =Alphabet, Amazon, Apple, Meta, Microsoft, Nvidia and Tesla. For the Magnificent 7 and the rest of the S&P 500, market capitalisation-weighted average. The composition of the S&P 500 is fixed on 28 November 2025.
Graph 1.C: For November 2025, data as of 28 November. EA = EURO STOXX 50; EA banks = EURO STOXX Banks; GB = FTSE 100; Magnificent 7 =Alphabet, Amazon, Apple, Meta, Microsoft, Nvidia and Tesla; US = S&P 500. For the Magnificent 7 and the rest of the S&P 500, simple average. The composition of the S&P 500 is fixed on 28 November 2025.
Graphs 2.A and 2.B: Magnificent 7= Alphabet, Amazon, Apple, Meta, Microsoft, Nvidia and Tesla. Other tech firms include companies classified as belonging to the "information technology" sector. The composition of the S&P 500 is fixed on 28 November 2025.
Graph 2.B: Market capitalisation-weighted average. For November 2025, data as of 28 November.
Graph 2.C: VIX = Cboe Volatility Index; VVIX = Cboe VIX Volatility Index.
Graph 3.A: Spreads of ICE BofAML index yields to OIS rates with matched maturities. Ten-year OIS for US investment grade, five-year for the rest. The USD OIS rate is based on SOFR starting on 11 December 2018. The EUR OIS rate is based on ESTR starting on 11 October 2019. For US investment grade, the box plot shows data between 31 July 2008 and 26 November 2025, due to data availability of USD 10-year OIS.
Graph 3.B: For non-financial firms. Weighted average by assets. Europe = AT, BE, CH, DE, DK, ES, FI, FR, GB, GR, IE, IS, IT, LU, MC, NL, NO, PT and SE.
Graph 3.C: Simple average of sub-indices. Asia = CN, HK, ID, IN, KR, MY, SG and TH; EMEA = CZ, HU, IL and ZA; Latin America = BR, CL, CO, MX and PE.
Graph 4.B: Market capitalisation-weighted average of four BDC ETFs, the top 10 junk bond ETFs by asset under management and seven bank loan ETFs as of 28 November 2025.
Graph 4.C: Twelve-month moving sum.
Graph 5.B: Share of free-floating UST is the share of marketable US Treasury debt not held by the Fed. Data on marketable US Treasury debt available until 30 September 2025, and until 13 October 2025 for short positions of leveraged funds due to US government shutdown.
Graph 6.A: EA 10-year government bond yield refers to the German 10-year government bond yield.
Graph 7.A: Five-day moving average.
Graph 8.A: Precious metals index = simple average across the spot prices of palladium, platinum and silver.
Graph 8.B: For CHF, EUR and JPY, five-day moving average.
Graph 8.C: Simple average. Asia = CN, HK, ID, IN, KR, MY, SG and TH; EMEA = CZ, HU, IL, PL and ZA; Latin America = BR, CL, CO, MX and PE. Five-day moving average.
Footnotes
1 The review period covers 5 September to 28 November.
2 T Ehlers and K Todorov, "Goodbye Libor, hello basis traders: unpacking the surge in global interest rate derivatives turnover", BIS Quarterly Review, in this issue.
3 F Hermes, M Schmeling and A Schrimpf, "Unpacking repo haircuts and its implications for leverage", BIS Bulletin, No 117.
4 See V Sushko and K Todorov, "Sizing up hedge funds' relative value trades in US Treasuries and interest rate swaps", BIS Quarterly Review, in this issue.