Sizing up hedge funds' relative value trades in US Treasuries and interest rate swaps
Box extracted from chapter "Goodbye Libor, hello basis traders: unpacking the surge in global interest rate derivatives turnover"
The start of quantitative tightening in 2022 and continued rapid government debt issuance has been a fertile environment for hedge funds to expand their footprint in the market for US Treasury securities (USTs) and other government bonds. Hedge funds have employed various relative value trading strategies that exploit small price differences between closely related financial instruments. To make these trades sufficiently profitable, hedge funds employ leverage, mainly relying on repo borrowing to finance their bond holdings. While the best known and well documented strategy has been the cash-futures basis trade,
 another strategy, the interest rate swap (IRS) spread trade ("the swap trade" for short), has grown rapidly over the past year. This trade combines a long position in USTs together with a "pay fixed" position in an IRS, mimicking a short position in a fixed rate bond, to earn a higher yield on the UST than the fixed rate paid in the swap. The swap trade drove most of the growth in hedge fund repo leverage in the United States over the past year, whereas the cash-futures basis trade, while still the largest, has not expanded further since early 2024. The swap trade was fuelled further by beliefs about regulatory relief in the United States since January 2025, and was also the source of hedge fund deleveraging pressures in Treasury markets during the April 2025 turbulence.
Data on hedge funds' long and short UST exposures are published by the US Office of Financial Research (OFR), which aggregates information from confidential SEC Form PF quarterly filings. The long UST exposures consist of cash bond holdings (often financed via repos), as well as long positions in UST futures, forwards and options. In turn, short UST exposures include bonds borrowed via reverse repos and sold, along with short positions in UST futures, as well as forwards and options. It is crucial to note that unlike Treasury futures, an IRS contract does not reference USTs as an underlying in the reporting. Instead, in an IRS counterparties exchange a series of interest rate payments, where a floating rate benchmark and the dollar notional amount are specified in the contract. For example, a short IRS position refers to making (pre-determined) fixed rate payments and receiving floating rate payments based on the contract's notional amount. Hence, the OFR does not classify IRS as UST exposures. This feature of the data allows us to estimate the size of the swap trade from information on hedge funds' long and short UST exposures.
In the swap trade, hedge funds hold cash USTs (long UST exposure) and enter IRS as fixed rate payers (short IRS exposures). Like the cash-futures basis trade, the swap trade exploits pricing discrepancies – specifically, the discount at which cash USTs trade relative to comparable derivatives (in this case an IRS) due to the "inconvenience" yield on USTs.
Since 2022, hedge funds' total UST exposures have more than doubled. As of Q2 2025, long UST exposures totalled $2,379 billion (Graph B1.A, blue line), or approximately 10% of USTs held by the private sector, while short UST exposures totalled $1,748 billion (red line). Most of the short UST exposures, $1,060 billion, were in short UST futures associated with the cash-futures basis trade (see main text). In that trade, as mentioned above, the short futures positions are matched with an equal sized $1,060 billion in cash UST holdings. The remaining $688 billion in short UST exposures can be linked to various other relative value trades with offsetting short and long UST exposures (eg on-the-run vs off-the-run arbitrage or yield curve arbitrage).
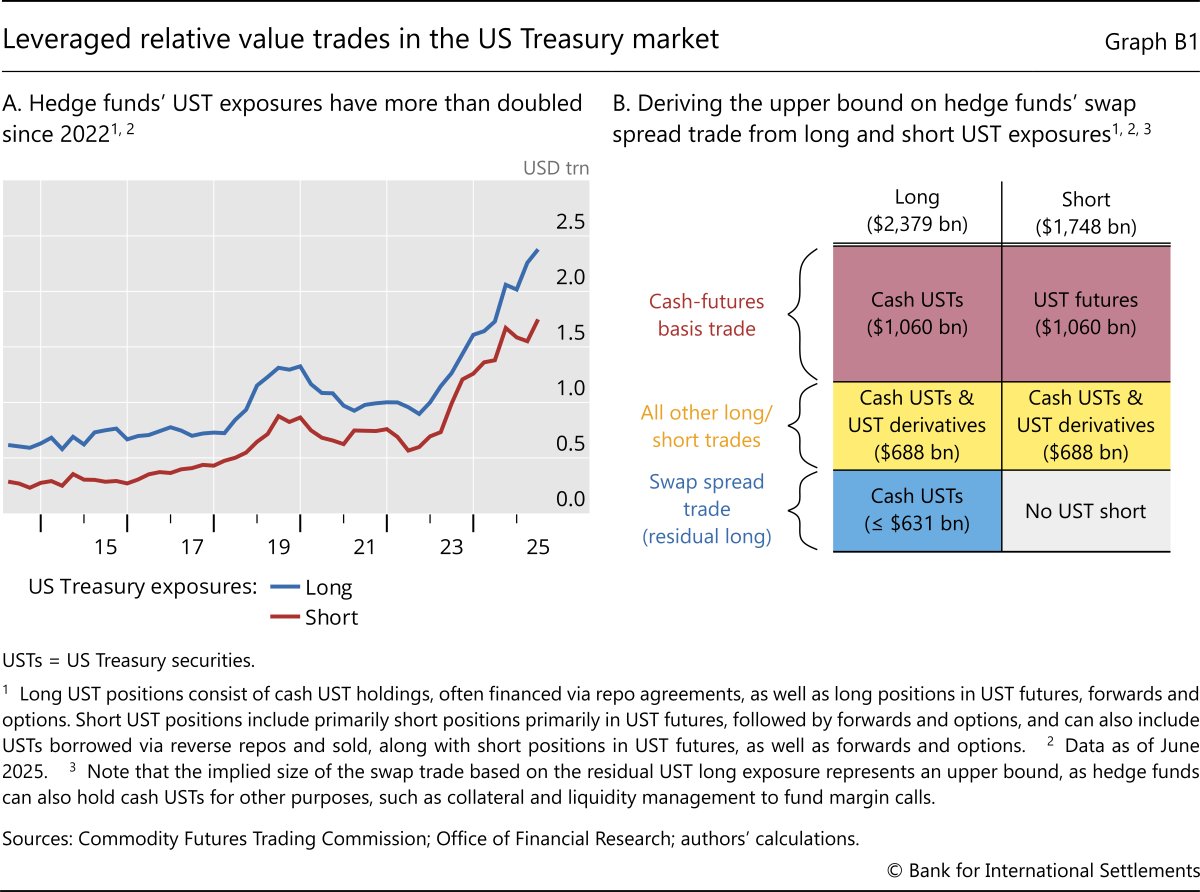
The upper bound on the size of the swap trade can be approximated from aggregate data because the UST holdings (long US positions) in this trade are not matched by short UST positions reported in the OFR data. Unlike the cash-futures basis trade, where a long cash UST position is paired one for one with a short UST futures position, the swap trade pairs a long cash UST position with a short (ie fixed rate payer) position in an IRS, which is not classified as a short UST position by the OFR, as explained above. Hence, one can infer the upper bound on the size of the swap trade as the residual of long UST exposures of hedge funds after all their short UST exposures have been accounted for. This residual represents an upper bound, since hedge funds may also hold USTs for collateral and liquidity management, eg to make payments on margin and collateral calls on their outstanding derivatives positions. Applying this approximation, a T-account-type diagram illustrates that the residual long UST exposures, not matched by short exposures, amounted to $631 billion in Q2 2025 (Graph B1.B, blue block). This residual is the implied upper bound on the size of the swap trade.
The swap trade has expanded rapidly since early 2022. Since Q1 2022, the size of the swap trade has more than doubled, from $281 billion in Q1 2024 to $631 billion in Q2 2025 (Graph B2.A, blue bars). In fact, since Q2 2024, the growth of hedge funds' UST exposures has been primarily driven by the swap trade, whereas the cash-futures basis trade, while remaining the largest, has largely stagnated (red bars). Hence, the increase in hedge funds' repo leverage appears to be primarily driven by the swap trade, and to a lesser extent by other long/short relative value trades (Graph B2.B).
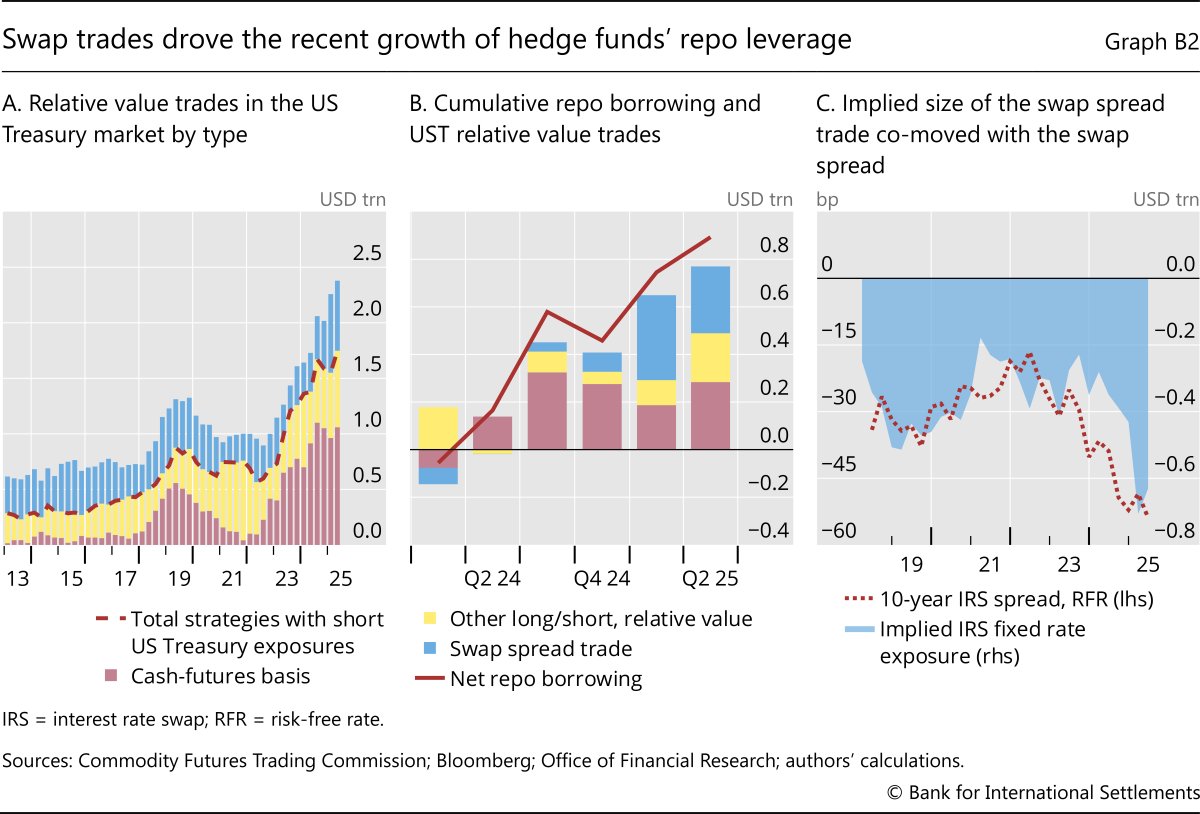
The inferred size of the swap trade exhibits the expected co-movement with the IRS spread. For expositional purposes, we plot the estimate of the swap trade as a negative value, which can be interpreted as the resulting short IRS exposure, where hedge funds position themselves as payers of the swap rate (the fixed rate in an IRS). The size of the implied short IRS exposures tends to expand and contract with the IRS spread (the 10-year swap rate minus the 10-year UST yield) (Graph B2.C), where the spread approximates the incentives to enter the swap trade. This suggests that, despite being an upper bound, the inferred size of the swap trade may be a fairly good estimate of the size of the actual trade, at least over the past few years.
The swap trade has become the source of the growth of hedge funds' Treasury exposure over the past year, largely driven by bets on regulatory easing, but was also vulnerable to rate shocks. Specifically, hedge funds have bet on the possible easing of the supplementary leverage ratio for banks, which is expected to free up balance sheet space to hold more USTs, thus allowing for the trades to be unwound with a profit from higher UST prices. However, during the April 2025 market turbulence, traders were caught wrong-footed, as UST yields spiked and bond prices fell. The partial unwinding of the swap trade was reflected in an 11% contraction of the implied size of the trade, from $707 billion in March 2025 to $631 billion in June (Graph B2.A, blue bars), underscoring its sensitivity to periods of strains in fixed income markets. Most recently, the swap spread has compressed somewhat, suggesting that hedge funds may have renewed their bets on potential supplementary leverage ratio relief. Moreover, the continued erosion of the UST convenience yield due to expansive fiscal policy could give further impetus to the growth of the swap trade. There is also an international dimension, as incentives for the IRS trade have been rising in other jurisdictions, such as the euro area and Japan.
 The associated cross-border interconnections and potential international spillovers from the swap trade could be just as significant as those of the cash-futures basis trade, if not more so.
The views expressed in this publication are those of the authors and do not necessarily reflect the views of the BIS or its member central banks. Main types of trades are cash-futures basis trades, IRS spread trades, on-the-run versus off-the-run arbitrage, auction cycle arbitrage and yield curve arbitrage. D Barth and J Kahn, "Hedge funds and the Treasury cash-futures basis trade", Journal of Monetary Economics, volume 155, 103823, 2025. Traditionally, bank dealers have been the main sellers of IRS (see eg N Boyarchenko, P Gupta, N Steele and J Yen, "Negative swap spreads", Federal Reserve Bank of New York Economic Policy Review, October 2018) but hedge funds have been growing their footprint. Fixed rate receivers in IRS often include institutional duration hedgers, corporates seeking to swap floating for fixed rates and other market participants managing interest rate risk. For the most recent discussion of the basis trade, see T Ehlers and K Todorov, "Goodbye Libor, hello basis traders: unpacking the surge in global interest rate derivatives turnover", BIS Quarterly Review, December 2025, in this issue. Also note that not all short UST positions are basis trades. For example, futures, instead of cash bonds, can also be used in yield curve arbitrage, and for hedging other cash bond exposures, such as those associated with auction cycle arbitrage. See "Volatility challenges the risk-on mood", BIS Quarterly Review, December 2025, in this issue. M Aquilina M, A Schrimpf, V Sushko and D Xia, "Negative interest rate swap spreads signal pressure in government debt absorption", BIS Quarterly Review, December 2024.