Covid, central banks and the bank-sovereign nexus

The Covid–19 outbreak strongly affected the evolution of the bank–sovereign nexus. In advanced economies, banks played an important role in financing sovereign debt during the first two quarters of 2020 but their participation fell in subsequent quarters. Correspondingly, the share of sovereign debt in banks' portfolios declined. In contrast, central bank reserves soared due to asset purchase and funding–for–lending programmes. In emerging market economies, the rise in banks' holdings of sovereign debt started before the Covid–19 outbreak and accelerated thereafter. From a longer–term perspective, the perceived credit risk of banks tends to co–move more strongly with that of sovereigns when the share of sovereign debt on banks' balance sheets is higher or – keeping this share constant – when the share of reserves is lower.1
JEL classification: E58, F34, G21, G32, H63.
The financial health of banks and sovereigns is intertwined. Banks are key investors in sovereign debt2 as its liquidity often helps them meet regulatory and internal risk–management objectives. In addition, many sovereigns backstop the financial system in times of trouble. Such connections – the "bank–sovereign nexus" – can lead to destabilising spillovers between the two sectors in times of stress. These spillovers were at the centre of policy debates, particularly during the emerging market economy (EME) crises of the 1980s and 1990s and the euro zone sovereign debt crisis.3
During the Covid–19 pandemic, sovereigns in both advanced economies (AEs) and EMEs issued a large amount of new debt to fund their support packages. This development affected the bank–sovereign nexus as the debt was funded in part directly by banks and in part by other investors but intermediated by banks. Banks in EMEs increased their holdings of sovereign debt from the pandemic's outbreak through mid–2022 (see also Deghi et al (2022)). In contrast, banks in AEs reduced such holdings over the same period, although they played a key role in funding the sovereign debt issuance in the first two quarters of 2020.
Key takeaways
- Sovereign borrowing surged globally in the wake of the pandemic's outbreak but only banks in emerging market economies steadily increased their holdings of sovereign debt.
- In advanced economies, central bank asset purchases reduced banks' holdings of sovereign debt and, with funding–for–lending programmes, boosted central bank reserves as the pandemic unfolded.
- Bank and sovereign credit spreads are more closely linked when banks hold more sovereign debt or – all else equal – fewer reserves.
These differences in the evolution of the bank–sovereign nexus stemmed from actions by the respective central banks. In contrast to central banks in major EMEs, those in AEs significantly expanded their balance sheets. In conducting large–scale asset purchase (LSAP) programmes, AE central banks funded purchases of primarily sovereign debt with reserves. Many also engaged in sizeable funding–for–lending (FFL) programmes, which provided financing to banks while also creating more reserves on their balance sheets (Markets Committee (2023)). Consequently, banks in AEs shifted their connection with the official sector away from sovereigns and towards central banks.4
We build on research that examines market participants' perceptions of the correlation between sovereign and bank credit risk (Acharya et al (2014), de Bruyckere et al (2013), Fratzscher and Rieth (2019)). We use CDS spreads to account for these perceptions and our contribution stems mainly from studying the role of central bank reserves. We show that the two sectors' CDS spreads co–move more strongly when banks hold more sovereign debt or – keeping sovereign debt holdings constant – when they hold fewer reserves. The latter result is consistent with markets holding the perception that reserves have greater liquidity benefits than sovereign debt. In line with our findings on the evolution of the bank–sovereign nexus across regions, the correlations of bank and sovereign CDS spreads increased in EMEs in 2020–22 but fell in AEs.
The rest of this article takes in turn different perspectives on the links between banks and sovereigns, paying particular attention to developments after the start of the Covid–19 pandemic. The first section discusses the size of banks in the sovereign debt investor pool. We do not consider non–bank investors, such as insurance companies (covered in Box A), investment funds or foreign central banks. The second section examines how the amounts of sovereign debt and reserves on banks' balance sheets have changed. The third turns to the correlation between the perceived credit risk of banks and sovereigns. The final section concludes with some policy considerations.
Importance of banks in the sovereign debt market
In examining the stock of sovereign debt and the share held by banks, we use the most recent data from the sovereign investor base estimates of Arslanalp and Tsuda (2014a, 2014b). Our main focus is bank investors – located either in the same country as the sovereign (resident banks) or abroad (non–resident banks). Since LSAPs in AEs were large–scale, we also consider central banks as large investors in sovereign debt. We refer to periods up to Q4 2019 as pre–pandemic and periods from Q1 2020 onwards as post–outbreak.
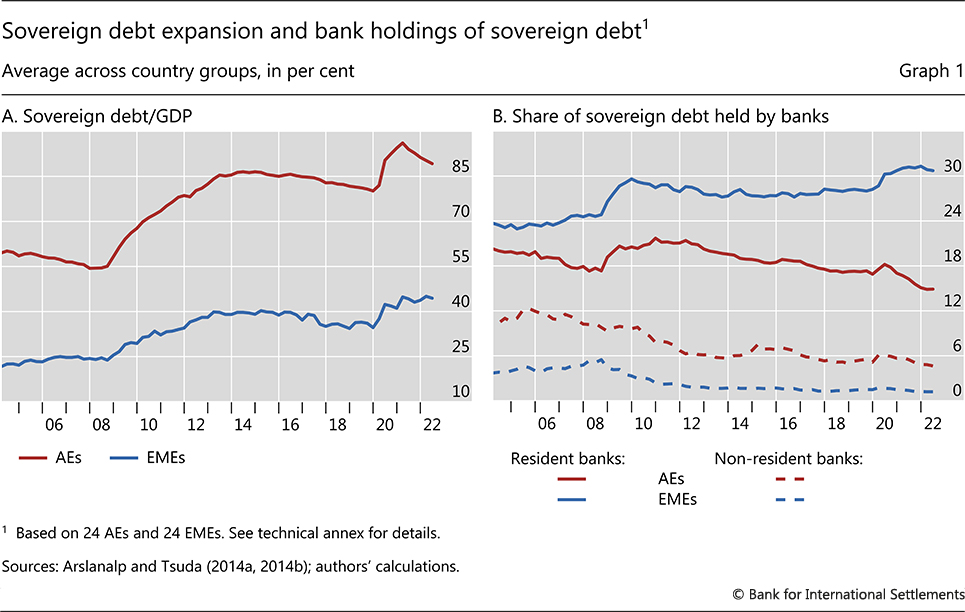
While total sovereign debt expanded similarly in both AEs and EMEs, the share of debt held by banks diverged in the two groups. From Q4 2019 to Q2 2022, the average outstanding debt rose from 80% to 89% of GDP in AEs and from 35% to 44% in EMEs (Graph 1.A). However – after an upward blip in Q1 2020 – the share of AE sovereign debt held by resident banks fell, accelerating a pre–existing downward trend (Graph 1.B). This stood in contrast to banks in EMEs, whose share rose over the post–outbreak period by 3 percentage points to reach 31% at end–Q2 2022.
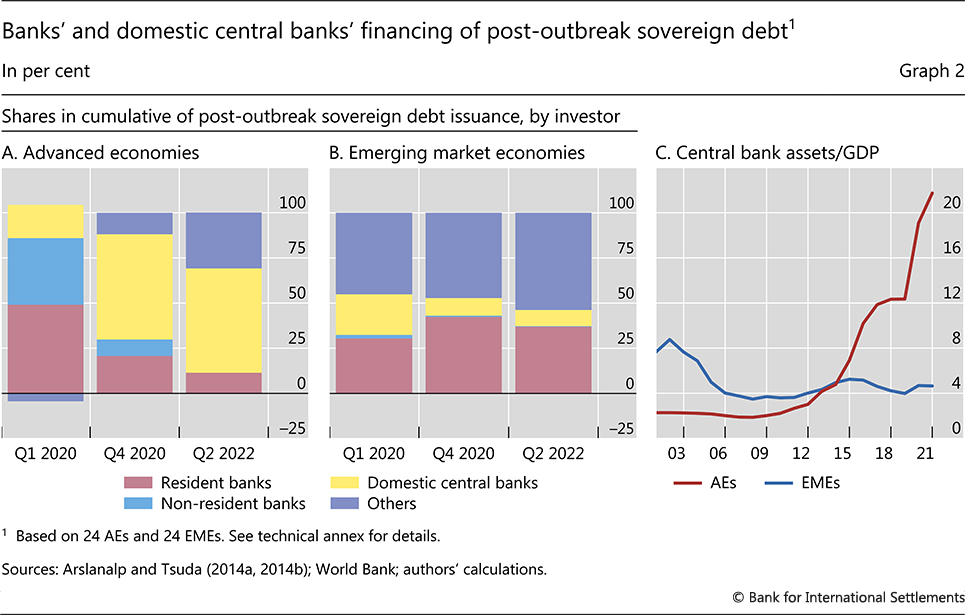
Nevertheless, banks did play a key role in absorbing sovereign debt in AEs at the pandemic's outset. The increase in sovereign debt in Q1 2020 was initially picked up by banks, mostly resident5 (Graph 2.A). This could be related to banks' role as primary market dealers in some economies (Arnone and Ugolini (2005)). Subsequently, banks held a progressively smaller share of cumulative pandemic–related debt issuance, falling from 49% in Q1 2020 to below 12% at mid–2022. In contrast, banks in EMEs remained key sovereign debt investors post–outbreak (Graph 2.B), although non–bank investors were also large holders of this debt (purple bars).
The difference in the sovereign debt holdings of banks in AEs and EMEs stems from actions taken by central banks. The balance sheets of EME central banks changed little relative to economic activity post–outbreak, while those of AE central banks expanded sharply (Graph 2.C). This expansion consisted in large part of sovereign debt purchases. By end–Q2 2022, domestic central banks' holdings of AE sovereign debt accounted for over half of the post–outbreak issuance, replacing banks as the key investors (Graph 2.A, yellow bars).
Further reading:
Importance of sovereigns in banks' portfolios
The increase in sovereign debt and the shifts in its financing due to central bank policies had important implications for the composition of bank balance sheets. This section examines the bank–sovereign nexus from the banks' perspective, investigating at the country level how their holdings of sovereign debt and central bank reserves evolved as a share of assets. We rely primarily on data from the BIS locational banking statistics, but first highlight banks located in the two largest sovereign debt–issuing countries, Japan and the United States, on the basis of national data.6
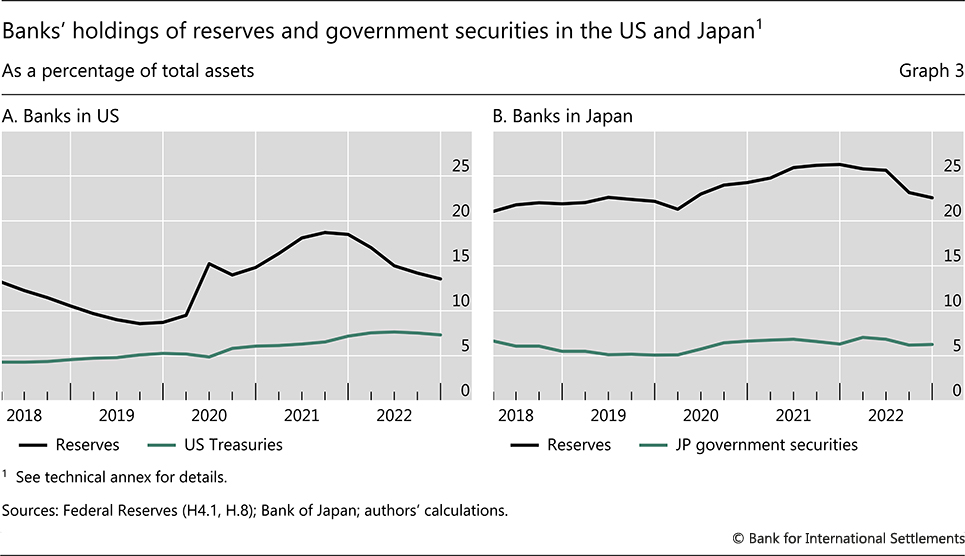
Banks in Japan and the United States saw significant increases in their reserves during the post–outbreak period while the shifts in their holdings of domestic sovereign debt were more muted. Reserves expanded from 10% and 22% of assets in Q4 2019 to 18% and 26% by end–2021 for banks in the United States and Japan, respectively (Graph 3). The concurrent rise in banks' holdings of domestic sovereign debt was more pronounced in the United States, where it continued a pre–pandemic trend. The potential underlying drivers are regulatory and market developments after the Great Financial Crisis, such as the introduction of liquidity requirements and bilateral margin requirements for non–centrally cleared derivatives and the transition of interbank lending from unsecured transactions to repo transactions secured by sovereign debt. Also, some banks used US Treasuries in carry trades to exploit the negative interest rate swap basis after 2010 (Du et al (2022)).
To examine a broader set of countries and also consider banks' cross–border holdings of sovereign debt, we leverage the BIS locational banking statistics.7 These statistics incorporate information on the counterparty sector of bank lending since 2014, including on sovereigns and central banks (see also Garcia Luna and Hardy (2019)). We limit our analysis to jurisdictions that report this information for both local and cross–border positions (18 AEs and six EMEs). In addition to the United States and Japan, this excludes China.8
In AEs, bank holdings of domestic sovereign debt temporarily increased in the first year of the pandemic but ultimately fell below pre–pandemic levels. Banks in the euro area accumulated $236 billion of domestic sovereign debt over the first two quarters of 2020 but shed nearly the same amount thereafter. Ultimately, the expansion of their balance sheets outpaced their sovereign debt holdings, leading to a declining share (Graph 4.A, blue line). Banks in other AEs also built up large positions in domestic sovereign debt in the first two quarters of 2020 ($505 billion), but this proved to have a temporary impact on the composition of their expanding balance sheets (Graph 4.B, blue line).
Although the share of sovereign debt in total assets hardly changed for banks in AEs after the pandemic's outbreak, LSAP and FFL programmes dramatically increased banks' holdings of reserves. The share of reserves doubled on the balance sheets of banks in the euro area from Q4 2019 to Q3 2022 and increased by a half for banks in other AEs (Graphs 4.A and 4.B, red lines).9 This increase was driven by an expansion of reserve holdings rather than a contraction of other parts of bank balance sheets. As the programmes tapered off in the first half of 2022, these shares plateaued at a high level. Ultimately, these trends reshaped the links of banks with the official sector, away from holding sovereign debt and towards reserves at the central bank.
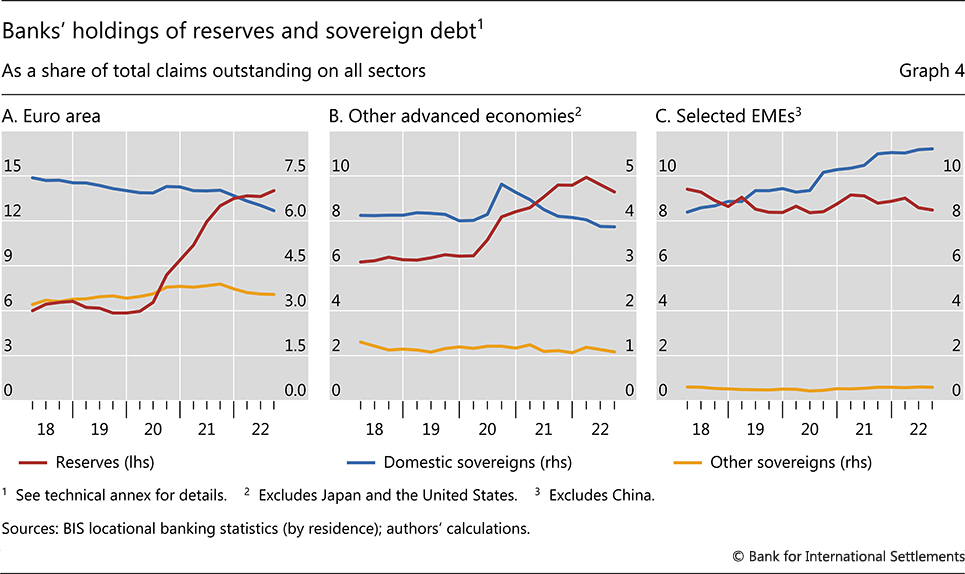
Banks located in our EME sample continuously increased their exposure to domestic sovereign debt during the post–outbreak period, accelerating a pre–pandemic trend. As banks' holdings of domestic sovereign debt rose by nearly $300 million between Q4 2019 and Q3 2022, their balance sheet share increased from 9% to 11% (Graph 4.C). Central banks' liquidity provision programmes and other measures made it easier for banks to purchase and hold the additional sovereign debt. The rise in sovereign debt holdings was accompanied by a change in the share of reserves that was muted in comparison with AE developments. This reflects the small scale or absence of LSAPs in some EMEs and the sterilisation of the LSAPs' impact on central bank balance sheets in others (Arslan et al (2020)).
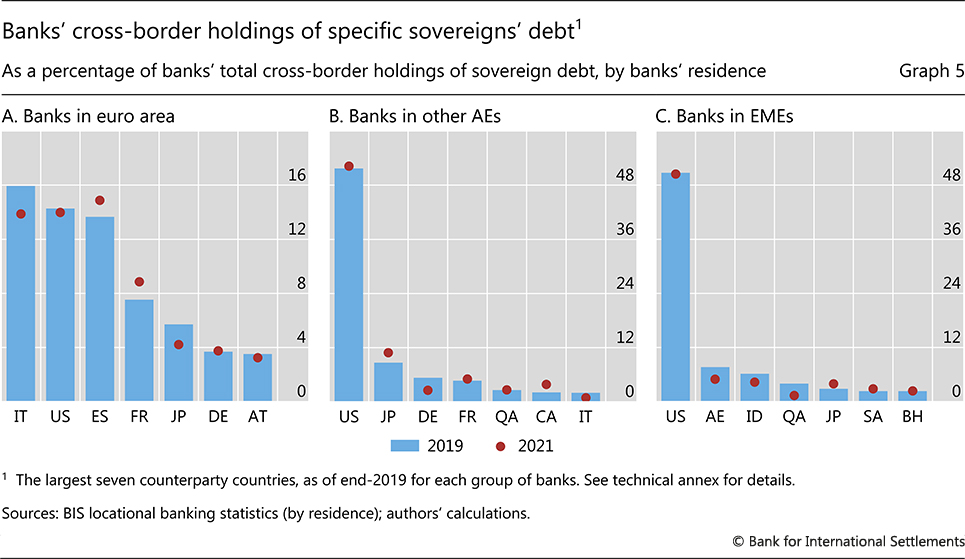
The massive pandemic–related rises in sovereign debt supply and the demand for such debt from central banks did not significantly impact banks' cross–border holdings of sovereign debt. Only in the euro area did these holdings rise as a share of assets – through 2021, in a continuation of a pre–pandemic trend – but then the increase was largely reversed (Graph 4.A, yellow line). Further, banks' cross–border holdings of sovereign debt did not show significant geographic shifts (Graph 5).
Bank–sovereign links and the correlation of CDS spreads
Stronger financial links between banks and sovereigns widen the channels for credit risk to propagate between the two. For example, banks' balance sheets may weaken on the back of sovereign defaults. More frequently, they sustain mark–to–market losses if the sovereign's perceived credit risk rises. This section relates the evolution of the bank–sovereign nexus to perceived credit risk spillovers between the two sectors.
First, we measure these spillovers by deriving the correlation of bank and sovereign credit default swap (CDS) spreads within each quarter from 2017 to 2022. Specifically, we average the daily log changes of CDS spreads across a set of banks in a given jurisdiction and then remove the daily common component of these changes across jurisdictions. We remove a similar component from the corresponding changes for the sovereigns. We calculate the correlation between the two resulting time series in each country (see annex for details).
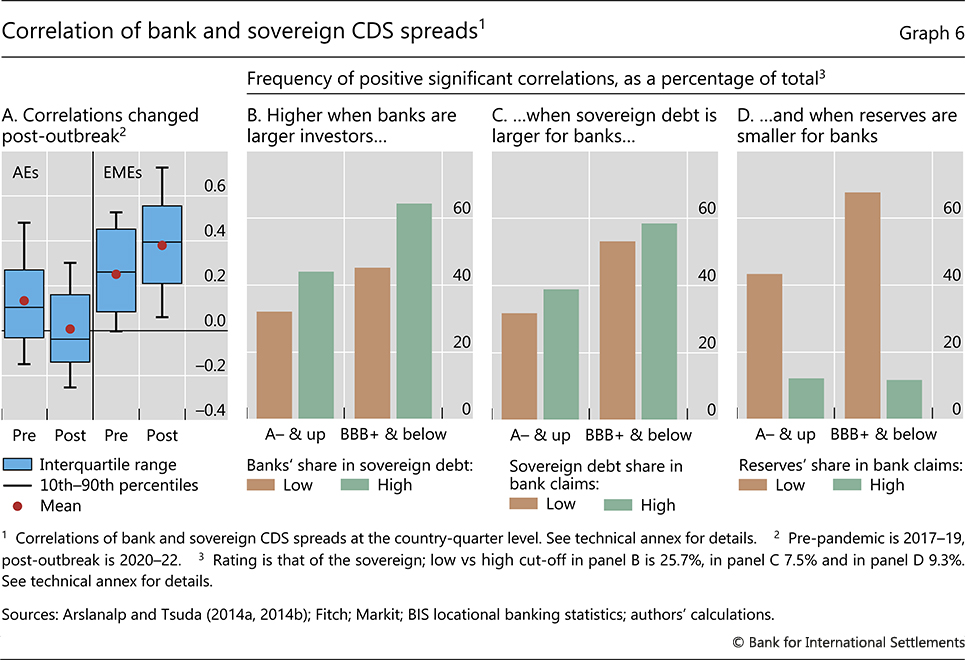
After the pandemic's outbreak, bank–sovereign CDS correlations declined for AEs but rose for EMEs. In AEs, the bank–sovereign correlation averaged 0.13 pre–pandemic across countries and quarters but fell to effectively zero post–outbreak, a statistically significant drop (Graph 6.A). Within the same time frame, the average correlation in EMEs rose from 0.25 to 0.38, a statistically significant increase. The frequency of statistically significant positive correlations reflects a similar pattern. In AEs, this frequency fell from 30% of the total to 17%, while in EMEs it rose from 53% to 67%. The respective rise and fall in the correlations may relate to the fact that banks' sovereign debt holdings rose in EMEs as the pandemic unfolded but declined in AEs.10
Second, we seek to shed further light on potential drivers of the CDS spread correlations. Our unit of analysis is the CDS spread correlation between banks and sovereigns in each of 32 countries and within each quarter from Q1 2004 to Q2 2022. We group these correlations – first according to the sovereign's credit rating and then the size of the financial link between banks and sovereigns.11 As a lower–rated sovereign is in general more likely to default, fluctuations in perceived credit risk will be more material for investors holding its debt. For the credit rating groupings, we split the sovereigns into highly rated (A– and above) and other (BBB+ and below). For the financial link groupings, we consider banks' holdings of sovereign debt – either as a share of the sovereign's total outstanding debt (sovereign's perspective) or as a share of banks' assets (banks' perspective). And we split observations into those with strong financial links (top third of the distribution) and weak financial links (bottom two thirds). For each group, we report the frequency of observations that are positive and statistically different from zero.
The frequency of bank–sovereign CDS correlations that are positive and statistically significant increases with the size of financial links or as the sovereign credit rating worsens. This is evident from both perspectives. The frequency is higher when banks make up a larger part of the investor base for the domestic sovereign's debt (Graph 6.B) and when this debt forms a larger share of their balance sheets (Graph 6.C). This relationship holds whether or not we focus on jurisdictions with a higher–rated sovereign (left–hand pairs of bars) or on those with lower–rated sovereigns (right-hand pairs of bars). In general, positive correlations are more frequent for lower–rated sovereigns.
Central bank reserves can reduce the correlation of perceived bank and sovereign risk. As with the holdings of sovereign debt above, we group country–quarter correlations by the share of reserves on banks' balance sheets (high in the top third of the distribution, low in the bottom two thirds). The frequency of positive correlations is lower when reserves form a larger share of a bank's portfolio (Graph 6.D). This finding does not depend in qualitative terms on sovereign credit ratings. That said, when banks' reserves holdings are low, the frequency is higher for those with a worse–rated sovereign (brown bars).
The mitigating effect of central bank reserves on the bank–sovereign CDS co–movement could reflect different views on the two types of public sector liability.12 For instance, market participants could perceive reserves as less subject to credit risk and as carrying greater liquidity benefits because they can be used to settle payments or meet margin calls at par.13,14 Likewise, some national supervisors require banks to satisfy requirements for intraday liquidity needs with central bank reserves.
Refining our analysis by considering continuous measures of sovereign debt and reserve holdings delivers three main messages. First, the patterns shown in Graph 6.B–D are robust (Annex, Table 1). Second, the impact of these links on the correlations of banks' and sovereigns' CDS spreads is economically meaningful. When sovereign debt amounts to 11% of assets, the average for banks in EMEs, the bank–sovereign CDS correlation would be higher by 0.1 than when there are no sovereign debt holdings. For comparison, the average of such correlations in the euro area was near zero in 2009 but rose to a peak of 0.5 during the euro area debt crisis. Third, the moderating impact of reserve holdings on CDS correlations remains when holding the share of sovereign debt constant.
Government–backed loan guarantees, which we do not examine, can in principle affect the results in this section. Such guarantees aim to transfer the credit risk of eligible loans from banks to the sovereign. However, the decline in banks' credit risk can potentially be offset by an increase in the credit risk of their sovereign debt holdings. This is especially the case when the sovereign's capacity to absorb additional risk is compromised. Overall, such guarantees add a new dimension to the bank–sovereign nexus and thus deserve careful examination in future research.
Conclusion
By quantifying the materiality of the sovereign–bank nexus, this article delivers a number of broader messages. For one, the adequate capitalisation and financial health of banks are of paramount importance because they are key investors in the sovereign debt market and can play a stabilising role in early stages of a crisis. In addition, public policy – such as LSAP and FFL programmes but also prudential requirements – can directly affect the bank–sovereign nexus by changing the amount of sovereign debt and central bank reserves on banks' balance sheets. Since such effects also influence the potential for spillovers between sovereigns and banks, they merit authorities' attention in addition to the primary objectives of the policies.
References
Acharya, V, I Drechsler and P Schnabl (2014): "A Pyrrhic victory? Bank bailouts and sovereign credit risk", Journal of Finance, vol 69, no 6, pp 2689–739.
Arnone, M and P Ugolini (2005): "Primary dealers in government securities", IMF Working Papers, no 2003/045.
Arslan, Y, M Drehmann and B Hofmann (2020): "Central bank bond purchases in emerging market economies", BIS Bulletin, no 20.
Arslanalp, S and T Tsuda (2014a): "Tracking global demand for advanced economy sovereign debt", IMF Economic Review, vol 62, no 3.
––– (2014b): "Tracking global demand for emerging market sovereign debt", IMF Working Papers, no 14/39.
Barbiero, F, L Burlo, M Dimou and J Toczynski (2022): "Targeted monetary policy, dual rates and bank risk taking", European Central Bank Working Paper Series, no 2682.
Böninghausen, B, L Brennan, L McCabe and J Schumacher (2023): "The pandemic emergency purchase programme – an initial review", European Central Bank, Economic Bulletin Articles, vol 8.
Brutti, F (2011): "Sovereign defaults and liquidity crises", Journal of International Economics, vol 84, no 1, pp 65–72.
De Bruyckere, V, M Gerhardt, G Schepens and R Vennet (2013): "Bank/sovereign risk spillovers in the European debt crisis", Journal of Banking and Finance, vol 37, no 12, pp 4793–809.
Deghi, A, S Fendoglu, T Iyer, H Tabarraei, Y Xu and M Yenice (2022): "The sovereign-bank nexus in emerging markets in the wake of the COVID-19 pandemic", IMF Working Papers, no 2022/223.
Du, W, B Hebert and W Li (2022): "Intermediary balance sheets and the treasury yield curve", University of Chicago, Becker Friedman Institute for Economics Working Papers, no 2022-94.
Fang, X, B Hardy and K Lewis (2022): "Who holds sovereign debt and why it matters", NBER Working Papers, no 30087.
Fratzscher, M and M Rieth (2019): "Monetary policy, bank bailouts and the sovereign-bank risk nexus in the euro area", Review of Finance, vol 23, no 4, pp 745–75.
Garcia Luna, P and B Hardy (2019): "Non-bank counterparties in international banking", BIS Quarterly Review, September, pp 15–31.
Gennaioli, N, A Martin and S Rossi (2018): "Banks, government bonds, and default: what do the data say?", Journal of Monetary Economics, vol 98, pp 98–113.
Markets Committee (2023): "Funding for lending programmes", Markets Committee Papers, January.
Popov, A and N Van Horen (2014): "Exporting sovereign stress: evidence from syndicated bank lending during the euro area sovereign debt crisis", Review of Finance, vol 19, no 5, pp 1825–866.
Annex
This annex describes the computation of the correlation between bank and sovereign CDS spreads and provides supplementary analysis linking it to measures of the bank-sovereign nexus. We use daily data for CDS spreads of five-year USD contracts, which are the most liquid contracts and are internationally comparable. We compute a bank CDS spread at the country level by averaging the CDS spreads of major banks located in that country. These banks are headquartered primarily in the country, but we also include foreign subsidiaries when they have their own CDS spread.
We construct a measure for the correlation of bank and sovereign CDS prices along the lines of de Bruyckere et al (2013) and Acharya et al (2014), proceeding in three steps. First, we compute the daily log change in CDS prices. Second, we remove global common factors by regressing these changes on time fixed effects αt:
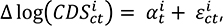
where c indexes countries, t indexes time (day), and i stands either for the banking sector in a country or the sovereign. Third, we calculate the following correlation: 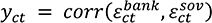 within each country and quarter.
To complement the analysis in the main text, we quantify the relationship of γct with the size of financial links between banks and sovereigns or central banks. We use three measures of these links: the share of outstanding sovereign debt held by resident banks, D/TotalD; the share of domestic sovereign debt on banks' balance sheet, D/BAssets; and the share of reserves on banks' balance sheet, Reserves/BAssets. We employ a regression approach, which allows us to examine each measure while holding the others constant:

The results (Table 1) corroborate those in Graph 6. The correlation is stronger when banks are larger as sovereign debt investors (column 1), sovereign debt is larger on banks' balance sheet (column 2) or reserves are smaller on banks' balance sheet (column 3). The latter result is unaffected by controlling for banks' holdings of sovereign debt (column 4). The coefficient β2 loses its significance in the last specification because of collinearity between D/TotalD and D/BAssets.
Table 1
Technical annex
Graph 1, Graph 2.B and Graph 2.C: The latest updated data for AEs and EMEs released by the authors on 6 January 2023 are used in the article. We use the BIS convention for classifying countries as AEs and EMEs, which differs from that in the source data. AEs comprise AU, AT, BE, CA, DK, FI, FR, DE, GR, IE, IT, JP, LT, LV, NL, NZ, NO, PT, SI, ES, SE, CH, GB and US; and EMEs comprise AR, BR, BG, CL, CN, CO, CZ, EG, HU, IN, ID, KR, MY, MX, PE, PH, PL, RO, RU, ZA, TH, TR, UA and UY. Not available (missing values) for Russia in Q1 2002 and Q2 2002 have been extrapolated. Other investors (Graph 2.B and 2.C) comprise resident as well as non-resident non-banks, and non-resident official sector.
Graph 2.C: Central bank assets are claims on domestic real non-financial sector by the central bank. The data are sourced from the World Bank's Global Financial Development Database (the latest update as of 23 September 2022). Missing values have been interpolated and extrapolated: from 2018 onwards for AR; in 2000 for AT, BE, ES, FI, FR, DE, GR, IT, NL, PT and RU; from 2019 onwards for DK; in 2000 and 2002 for IR; from 2006 to 2014 for LV; from 2004 to 2005 and 2010 to 2019 for RO; in 2004 and from 2007 to 2011 for SE; from 2018 onwards for CH; and in 2021 for TH. Data for Mexico are not available.
Graph 3: Banks in the United States include domestically chartered commercial banks, US branches and agencies of foreign banks and Edge Act and agreement corporations. US Treasuries include the non-MBS Treasury and agency securities. Banks in Japan include city banks, regional banks, trust banks and foreign banks; positions of Japanese banks' foreign branches are excluded.
Graph 4: Based on a constant population of reporting jurisdictions (from Q1 2018) that reported local and cross-border claims on governments (in domestic as well as foreign currencies). Outstanding amounts are adjusted for breaks in series and changes in foreign exchange rates, with first quarter value as the initial stocks. Euro area banks comprise those that are residents in 11 countries: AT, BE, DE, ES, FR, GR, IE, IT, LU, NL and PT. Banks resident in seven other advanced economies (AU, CA, CH, DK, GB, NO and SE). Banks resident in six emerging market economies (ID, KR, MY, TW, SA and ZA.).
Graph 5: Share by counterparty calculated after aggregating amounts outstanding within each reporting country group, excluding claims on regional residual counterparties, counterparties unallocated by country and international organisations. The sample of banks comprises euro area banks located in AT, BE, CY, DE, ES, FR, GR, IE, IT, LU, NL and PT; other advanced countries' banks located in AU, CA, CH, DK, GB, NO and SE; and emerging market and developing economies banks located in ID, IN, KR, MY, TW, SA and ZA. In the x-axis, AE=United Arab Emirates.
Graph 6: Correlation of daily log changes in five-year sovereign CDS spreads and in average five-year CDS spreads of banks located in the sovereign's country (only CDS denominated in US dollars included). Day fixed effects are removed from CDS price changes in the panel, and the residuals are then correlated within each quarter for each country. The bars show the share (within each group) of country-quarter observations where the bank-sovereign correlation is positive and statistically different from zero with 90% confidence. For panels B to D, observations are grouped by being above/below the 66th percentile of the bank-sovereign link variable in the panel, as well as by the credit rating of the sovereign.
1 The authors thank Iñaki Aldasoro, Claudio Borio, Stijn Claessens, Mathias Drehmann, Egemen Eren, Kumar Jegarasasingam, Patrick McGuire, Benoît Mojon, Andreas Schrimpf, Hyun Song Shin, Koji Takahashi, Nikola Tarashev, Goetz von Peter, Egon Zakrajšek and Fabrizio Zampolli for valuable comments, and Swapan-Kumar Pradhan for excellent research assistance. The views expressed are those of the authors and not necessarily those of the Bank for International Settlements.
2 Throughout this article, we use the term "sovereign debt" to refer to debt issued by the general government sector. This excludes publicly owned banks and corporations.
3 Bank lending typically falls following a sovereign debt crisis, and more so for banks that hold more sovereign debt (Gennaioli et al (2018), Popov and van Horen (2014)). The correlation of sovereign and bank risk rises after bailouts are announced (Acharya et al (2014)). While governments backstopped the banking sector in the 2007–09 Great Financial Crisis, during the Covid-19 pandemic they backstopped banks' exposures to the private sector via government-backed loan guarantees. These could also influence the bank-sovereign nexus.
4 This analysis complements literature on sovereign debt investors, which analyses pre-pandemic developments and finds that foreign investors can reduce sovereigns' borrowing costs while increasing refinancing risks (Arslanalp and Tsuda (2014a, 2014b)) and that non-bank investors are the marginal investors and most responsive to changes in the sovereign yield (Fang et al (2022)).
5 Non-resident banks' share was 37%, reflecting primarily intra-euro area investment.
6 These countries do not yet report the relevant breakdowns to the BIS locational banking statistics.
7 Cross-border claims on central banks tend to be small. One exception is the euro area, where claims on the ECB are considered cross-border for banks located outside Germany. Thus, in the remainder of this article, we consider all claims on the central bank together (cross-border and local) and interpret this as claims on the domestic central bank.
8 The locational statistics reflect banks' residence. The BIS also produces consolidated banking statistics, which are organised by bank nationality and exclude inter-office positions. These data have a longer time series of claims on the foreign official sector (government and central bank combined).
9 The euro area, in particular, engaged in a substantial FFL programme (TLTRO III) equal in size to its post-outbreak asset purchases, which further boosted central bank reserves there. See Barbiero et al (2022) for more discussions on TLTRO, and Böninghausen et al (2023) for a review of the ECB's pandemic emergency purchase programme.
10 The rising interest rate environment in 2022 doubtlessly also affected CDS spreads, but the correlation of those spreads in our sample was not appreciably different from that in the post-outbreak period more generally.
11 We do not also consider bank credit ratings. It is generally uncommon for banks to be better rated than their sovereign.
12 A greater share of reserves may also mean a smaller heft of other exposures that correlate strongly with sovereign risk (eg corporate debt constrained by a sovereign ceiling).
13 That said, sovereign bonds would be the highest-quality collateral for entities without access to central bank reserves. Our data do not allow us to rule out a scenario in which central bank interventions, surfacing as higher reserves in the banking system, reduced and stabilised sovereign CDS spreads but not bank CDS spreads.
14 Brutti (2011) models the liquidity role of sovereign debt in the bank-sovereign nexus.