Covid-19 policy measures to support bank lending

In the wake of the Covid-19 fallout, policymakers enacted a wide range of measures to support the flow of credit. Some measures strengthened banks' lending capacity by preserving their capital and encouraging flexibility in loss accounting. Others, such as state-backed loan guarantees or funding for lending programmes, incentivised banks to use their available capacity. We find evidence that both types of measures contributed to lending growth. Strong banks with ample balance sheet capacity could accommodate the large drawdown of corporate credit lines in the first months of the pandemic. Policy support appeared to foster further lending. Banks that increased their lending capacity increased their lending more than other banks. More generous guarantee programmes were associated with banks reporting looser lending standards and higher lending growth. Benefitting from such programmes, small and medium-sized enterprises expanded their borrowing, especially those in sectors hit hard by the pandemic.1
JEL classification: E44, G21, G28
Covid-19 and its associated health measures brought economic activity to a sudden halt, requiring a swift and strong reaction by monetary, fiscal and prudential authorities. A key public objective was to ensure the continued flow of credit to the real economy, particularly bank credit.
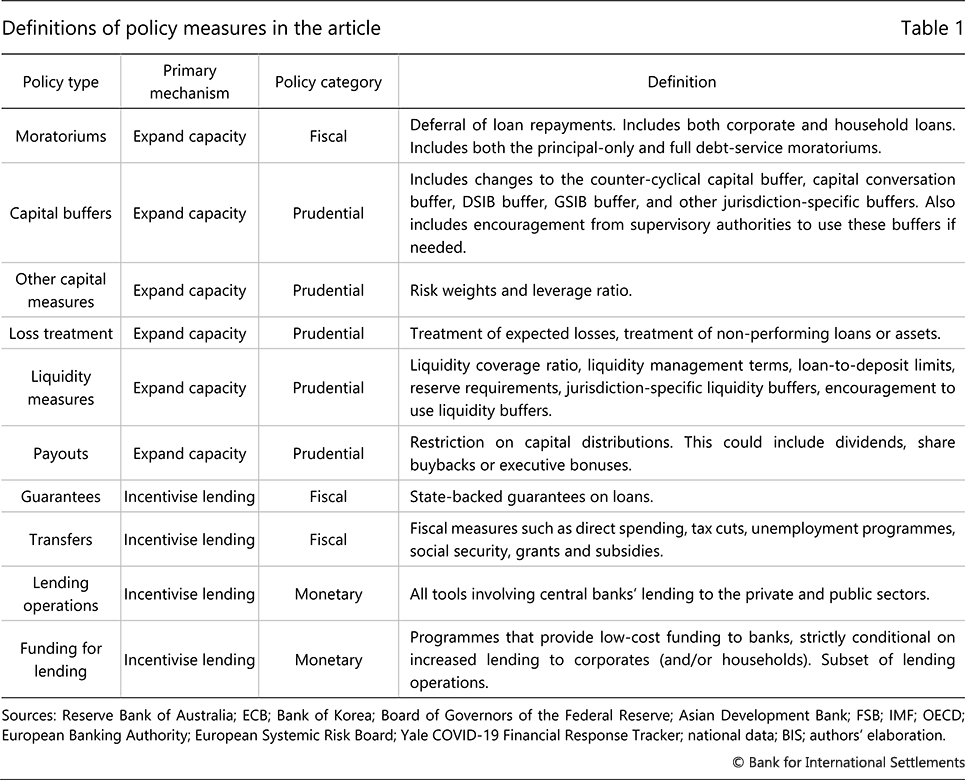
This special feature informs the discussion of how Covid-19 policy measures supported the flow of bank credit via two main mechanisms: by enhancing bank lending capacity and by providing incentives for banks to lend. These measures directly targeted banks and their borrowers.2 For example, balance sheet capacity was strengthened by preserving banks' capital and encouraging flexibility in loss accounting. Such prudential measures also sought to support bank resilience, an important foundation for lending. In turn, fiscal and monetary measures, such as loan guarantee programmes and funding for lending programmes, boosted incentives to lend by reducing banks' risks or funding costs. We stand out from the literature by considering the two mechanisms side by side, adopting a global perspective and highlighting outcomes for small and medium-sized enterprises (SMEs), which were targeted by many of the measures we consider.
Key takeaways
- Since the start of the Covid-19 pandemic, policy measures have supported lending by enhancing banks' balance sheet capacity and creating incentives for banks to use this capacity.
- Strong balance sheets allowed banks to accommodate credit line drawdowns at the start of the pandemic, while subsequent policy measures supported further lending.
- Small and medium-sized enterprises, particularly those in sectors hard hit by the pandemic, expanded their borrowing by more in countries with more generous guarantee programmes.
Both mechanisms supported bank credit. The initial increase in bank lending reflected the drawdown of pre-existing credit lines and was possible thanks to ample balance sheet capacity. Subsequently, capital preservation measures and guarantees appeared to further support lending in the second half of 2020 and into 2021. In particular, banks that increased their lending capacity increased their lending by more than other banks. More generous guarantee programmes were associated with larger increases in lending to SMEs in sectors particularly hard hit by Covid.
The remainder of this article proceeds as follows. The first section explains the mechanisms through which policy measures sought to support lending. The second documents the range of measures implemented across countries. The third analyses the impact of these measures on bank lending during the pandemic, and on credit to SMEs in particular. The concluding section outlines some trade-offs that policymakers face when unwinding the measures.
Through which mechanisms can policy support lending?
There are two complementary mechanisms by which policy measures can support bank lending in the face of a large but temporary shock. First, they can increase banks' capacity to lend by expanding their capital and by strengthening their liquidity positions. Second, they can provide incentives for banks to use this capacity by improving the risk-return trade-off for granting new credit.
Expand bank lending capacity
In order to increase lending, banks need to have the balance sheet capacity to make new loans. Public policy measures can enhance this capacity by boosting capital ratios, relaxing the requirements on these ratios or granting banks accounting flexibility. When it comes to liquidity constraints, swift central bank action can ensure that funding liquidity is not an issue for banks.
Policy measures can boost capital by supporting its growth. While regulators can, in principle, achieve this outcome by encouraging banks to raise new capital, this is rarely explored through market mechanisms amidst a crisis, when the cost of capital is particularly high. More effective are restrictions on capital payouts, which force banks to retain their earnings rather than distribute the capital to shareholders.
In parallel, policy measures can reduce constraints on lending capacity by reducing the measured riskiness of banks' balance sheets. Moratoriums on existing loans keep risk weights from increasing by preventing borrowers' distress from surfacing as missed payments. Similar to this is the effect of encouraging banks to use the full flexibility of accounting rules like IFRS 9 in order to look beyond short-term uncertainty when accounting for expected losses.3 In these cases, loss provisioning for the affected loans can decline.4
Authorities can also mobilise additional balance sheet capacity by loosening regulatory constraints themselves. The most straightforward way is by releasing buffers, such as the countercyclical capital buffer, which frees up capital at all banks in the releasing jurisdiction. Encouraging the use of other regulatory capital buffers can also generate capacity, especially in the absence of attendant regulatory restrictions.
Incentivise banks to increase lending
Banks use spare balance sheet capacity only if new lending offers a favourable risk-return balance, at interest rates that will not compromise borrowers' solvency. Public policy can influence this trade-off – and thus banks' lending incentives – by influencing the risk that banks bear and their cost of funding.
Several measures can reduce credit risk from banks' perspective. Loan guarantees provided by the public sector remove some or all credit risk from a loan, thus making it more attractive for banks to sustain their client relationships. That said, this effect could be reduced when guarantees come hand in hand with prescribed lending rates, thus keeping a lid on interest margins. Other fiscal measures primarily strengthen the creditworthiness of the borrower. They include, for instance, furlough schemes, direct transfers, tax deferrals or relief, grants and equity injections.5
Authorities can enhance the attractiveness of new loans by reducing their funding costs. An example, with additional incentives, is funding for lending programmes, which usually offer banks access to low-cost funding under certain conditions about how this funding is accessed and used. The Box explores how the structure of these programmes varies across countries.
Removing regulatory penalties can play a similar role. Dipping into non-releasable regulatory buffers – eg the capital conservation buffer – can involve penalties, such as restrictions on capital payouts. Regulators can dampen the attendant market stigma by: explicitly suspending those penalties; implicitly removing them with payout restrictions for all banks; or actively encouraging buffer use.
Policy implementation and use across countries
Policymakers implemented many different measures in a very brief time span. We map these measures across countries and regions, focusing on implementations in the first half of 2020, which allows us to capture most of the policy response to the Covid-19 shock.
Which policies were implemented?
Policy actions varied across countries. Many measures consisted of relaxing existing policies, so countries with tighter ones in place had more scope for adjustment. In general, authorities in advanced economies had more fiscal space to fund costly measures than those in emerging market economies (EMEs).
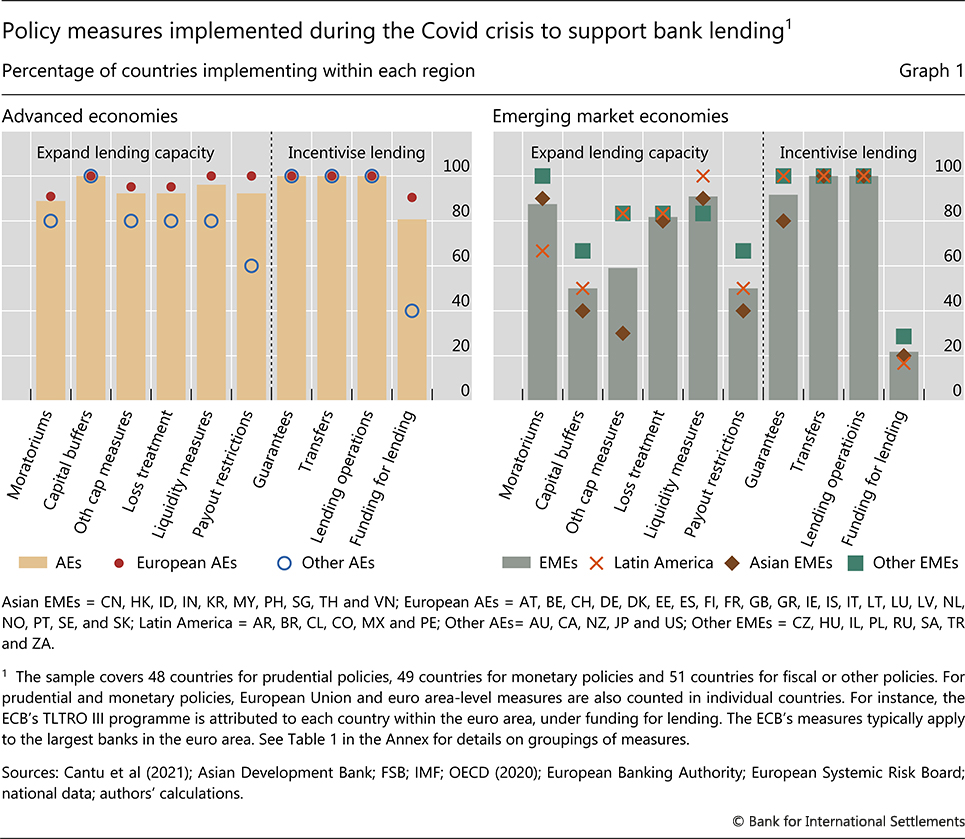
Advanced economies implemented a number of measures targeted at increasing banks' balance sheet capacity. Nearly all of them relaxed capital and liquidity requirements, and encouraged flexibility in the calculation of expected losses and the classification of non-performing loans (Graph 1, left-hand panel). Capital payout restrictions varied across regions: they were concentrated in Europe, where the European Central Bank (ECB) took the lead, and were implemented by only 60% of the non-European countries in our sample.
Measures to enhance banks' balance sheet capacity in emerging markets varied much more than in advanced economies. Most EMEs in our data implemented moratoriums on loan payments, provided relief from liquidity requirements and granted flexibility as regards the recognition of losses and the treatment of non-performing loans. That said, less than 60% of these EMEs used measures directly addressing capital requirements, buffers or payouts (Graph 1, right-hand panel). Asian EMEs resorted to such measures the least.
In turn, measures to incentivise lending were adopted by similar proportions of advanced and emerging market economies in our sample. Virtually all countries implemented loan guarantees and fiscal transfers, and expanded their lending operations. The notable exception has to do with funding for lending programmes, which were put in place across most European countries (many falling under the ECB programme) but only in around 20% of the EMEs in our database (Box).
How did the size and terms of policies vary?
While the general policy types tended to be similar across countries, some of the specific features differed considerably. For instance, many jurisdictions implemented payout restrictions, but some only restricted share buybacks or executive bonuses (Canada and Singapore) while others froze dividend payments as well (euro area, Brazil, United Kingdom and South Africa; see Svoronos and Vrbaski (2020)). Similarly, the scope of loans that qualified for debt moratoriums varied significantly: some covered all types of existing loans, while others only covered loans to specific sectors or to SMEs. Moreover, in some countries such as Spain or the United States, debt repayment moratoriums were mandated by legislation, while in others, including Australia and South Africa, they were encouraged by policymakers and industry associations (Coelho and Zamil (2020)).
Further reading
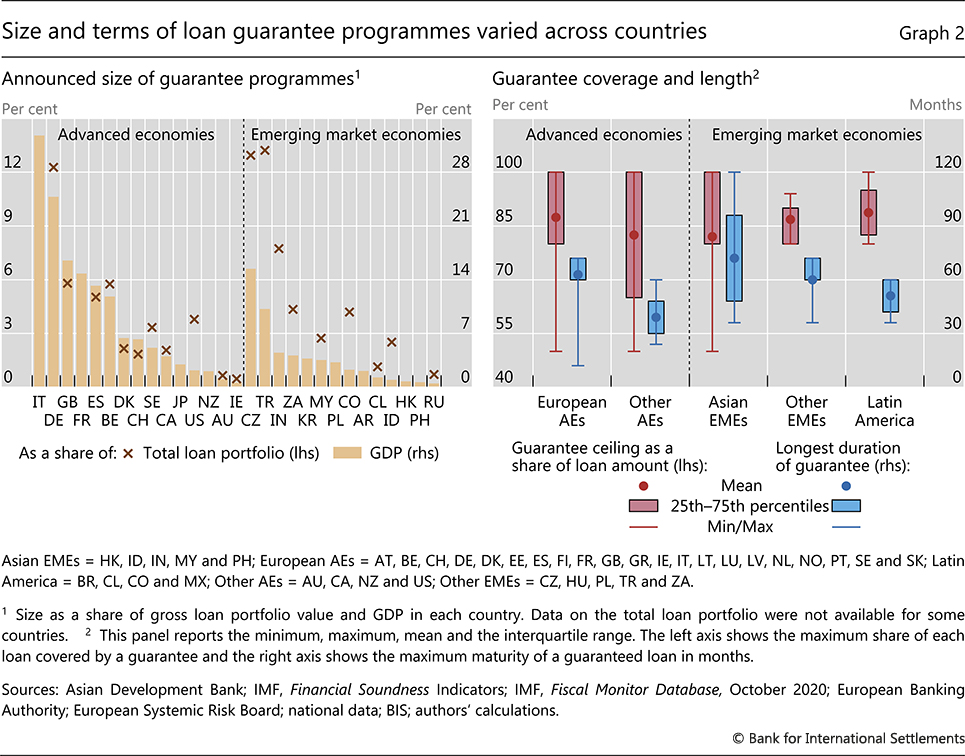
Details of guarantee programmes further underscore cross-country differences. Nearly every country in our sample implemented some sort of loan guarantee programme, but the ex ante (announced) sizes of these programmes varied greatly (Graph 2, left-hand panel). In advanced economies, it ranged from 32% of GDP in Italy and 25% in Germany, down to 1% in Australia. For emerging markets, the Czech Republic and Turkey top the list at 15% and 9% of GDP, respectively, while Russia sits below 0.5%. When expressed relative to the volume of outstanding bank loans, the announced guarantee programmes rank similarly across countries, ranging from about 0.5% in Ireland to about 12% in the Czech Republic and Germany, and more than 13% in Turkey.
Different jurisdictions also imposed different terms for their guarantee programmes (Graph 2, right-hand panel). As of Q3 2020, the share of a given loan that was subject to guarantees was set at 100% in 14 countries but was as low as 50% in Australia and Latvia.6 At the time of the programmes' announcements, the maximum maturity of eligible loans ranged from 12 months in Belgium to 10 years in Malaysia.
While programmes were almost always limited to corporate loans, sometimes they were further narrowed to SMEs (Hong Kong and Norway) or firms in sectors that were particularly hard hit by the pandemic (Portugal and Austria). Programmes also varied with respect to the pricing of guaranteed loans, the maximum loan amount per firm and the constraints on borrowers (in terms of disclosure and use of the proceeds).
Policy measures and lending outcomes: empirical evidence
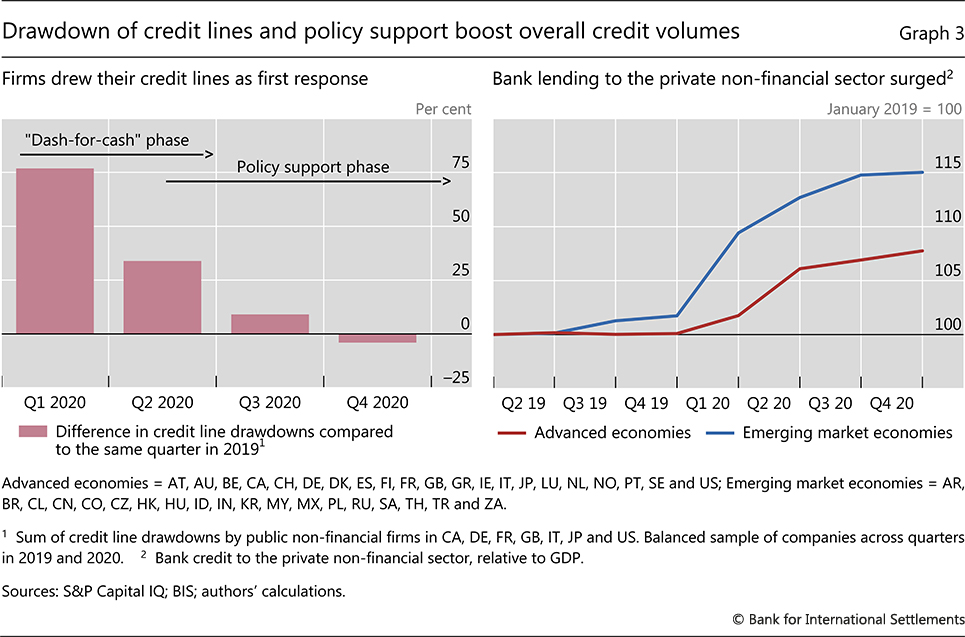
Broadly speaking, bank lending evolved over two phases after the Covid shock. The first phase was characterised by a "dash-for-cash" in Q1 2020 that spilt over into Q2. In this phase, firms drew down their available credit lines and raised other short-term borrowing, in part to bolster cash reserves (Graph 3, left-hand panel). This short-term borrowing gave rise to a sharp increase in credit to the private non-financial sector in Q1 (right-hand panel). Second came the policy support phase when measures were implemented en masse, mostly starting in Q2 2020. Initial balance sheet strength and new policy actions allowed banks to accommodate the sharp rise in corporate loan demand through both phases, even though the drawdown of credit lines consumed banks' lending capacity (Falagiarda and Köhler-Ulbrich (2021), Kapan and Minoiu (2021)).
What role did policy measures play in the second phase, after the drawdown of credit lines? In particular, to what extent did capacity-enhancing measures affect bank lending? Did guarantees incentivise greater lending, in particular to SMEs, which are the corporate borrowers most likely to become credit constrained during crises (Chodorow-Reich (2014))? On these questions, we provide cross-country evidence that is consistent with, but does not necessarily imply, causal effects.
The role of bank balance sheet capacity
While changes to balance sheet capacity are typically difficult to attribute to specific policy measures or other drivers, it is straightforward to gauge the changes themselves and relate them to lending outcomes. In this section, we consider two changes to individual banks' consolidated balance sheets in the first half of 2020. The first is the change in capital, normalised by end-2019 risk-weighted assets (RWA). The second is the change in the ratio of loan loss reserves (LLR) to total assets.7 We incorporate these variables jointly in a regression – together with other bank-level characteristics – to study how they relate to lending growth from Q1 2020 to Q1 2021. We also seek to rule out a scenario whereby our findings reflect the continuation of pre-existing lending growth or the effect of this growth on banks' balance sheets (Graph 4). Our key question is whether banks that expanded their balance sheet capacity by more than their peers – as measured by the capital and LLR variables – also experienced higher lending growth. An affirmative answer, especially if banks' pre-pandemic lending patterns were not different from their peers', would be indirect evidence that capacity enhancing measures might have supported lending during the pandemic.
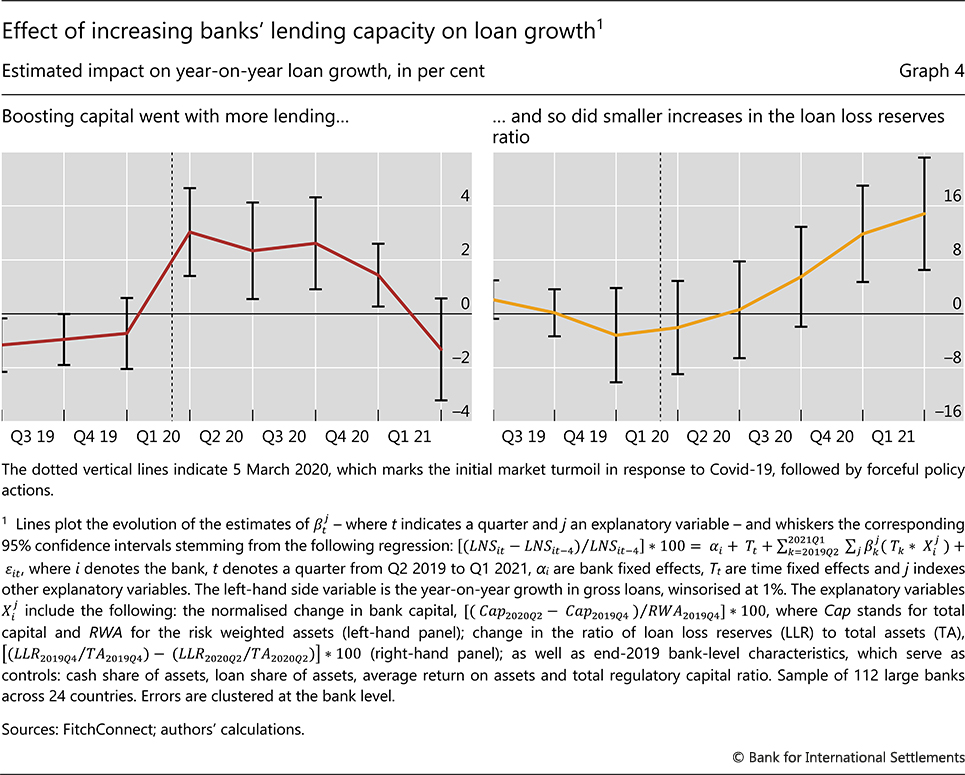
Banks that boosted their capital in the first half of 2020 by more than their peers, experienced comparatively higher lending growth throughout 2020 (Graph 4, left-hand panel). The effect arises in Q1, during the dash-for-cash phase when regulators stepped in to restrict capital payouts, but the comparatively higher lending persisted throughout the following quarters. The effect is economically significant: the median increase in capital across banks in the first half of 2020, of about 1.4% of 2019 RWA, is associated with a 3.3 percentage point higher year-on-year lending growth during 2020. This evidence is consistent with payout restrictions supporting lending by strengthening banks' capital base (see also Hardy (2021)).
Smaller increases in LLR in the first half of 2020 were also associated with expanded bank lending during, but not before, the pandemic. The increase in lending growth started in Q4 2020, well after the dash-for-cash phase (Graph 4, right-hand panel).8 The results are economically significant, as we estimate that a bank with LLR changes at the cross-sectional median experienced loan growth 2.2 percentage points higher than a bank at the 75th percentile of LLR changes. This suggests an important countercyclical effect of flexibility in accounting for expected losses amidst an unprecedented crisis. While such flexibility backstopped unwelcome ballooning of loss provisions because of the unprecedented uncertainty, it is also important that these provisions accurately reflect expected losses once the dust settles.
Our data do not allow us to study, in any depth, macroprudential measures to boost lending capacity on the basis of capital buffers. Since only a few countries had implemented positive countercyclical capital buffers when the pandemic hit, releasable buffers accounted for a small fraction of bank capital. In addition, banks may have been reluctant to use non-releasable buffers because of non-regulatory constraints to maintain significant capital space above regulatory requirements. These constraints could stem from either internal risk-management considerations or market expectations. Whether or not buffer-based measures made a difference remains an open question, despite some evidence suggesting that banks which were closer to regulatory requirements constrained their lending by more (BCBS (2021), Berrospide et al (2021), Saporta (2021)).
The role of guarantees to incentivise lending
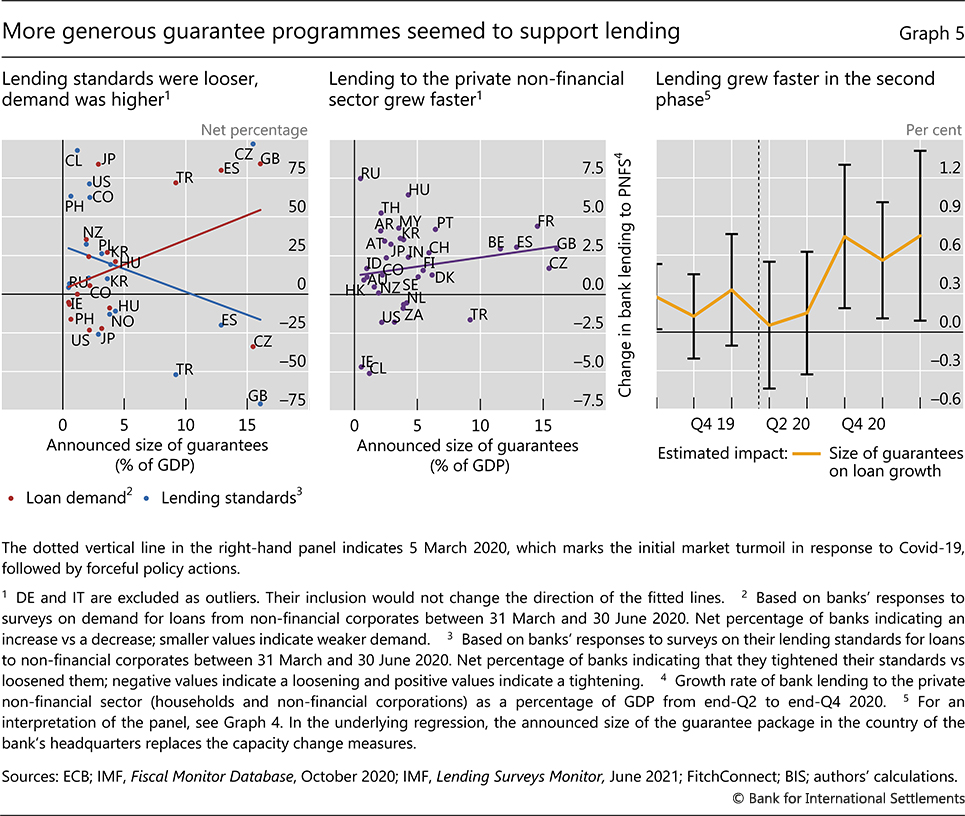
Government guarantee schemes seem to have been a major driver of bank lending during the second phase of post-outbreak lending. The attractive terms of such loans from the perspective of borrowers is likely to have boosted demand (Baudino (2020)), as banks reported higher demand in jurisdictions where the size of the guarantee programmes was larger (Graph 5, left-hand panel, red dots).9 In addition, and less directly, these programmes dampened overall macroeconomic uncertainty, which is likely to have contributed to banks reporting looser lending standards (blue dots). Overall, aggregate bank lending to the private non-financial sector grew faster in countries with larger announced guarantee programmes (centre panel). This differentiation was most pronounced in the second phase of lending, from Q3 2020 to Q1 2021 (Graph 5, right-hand panel).
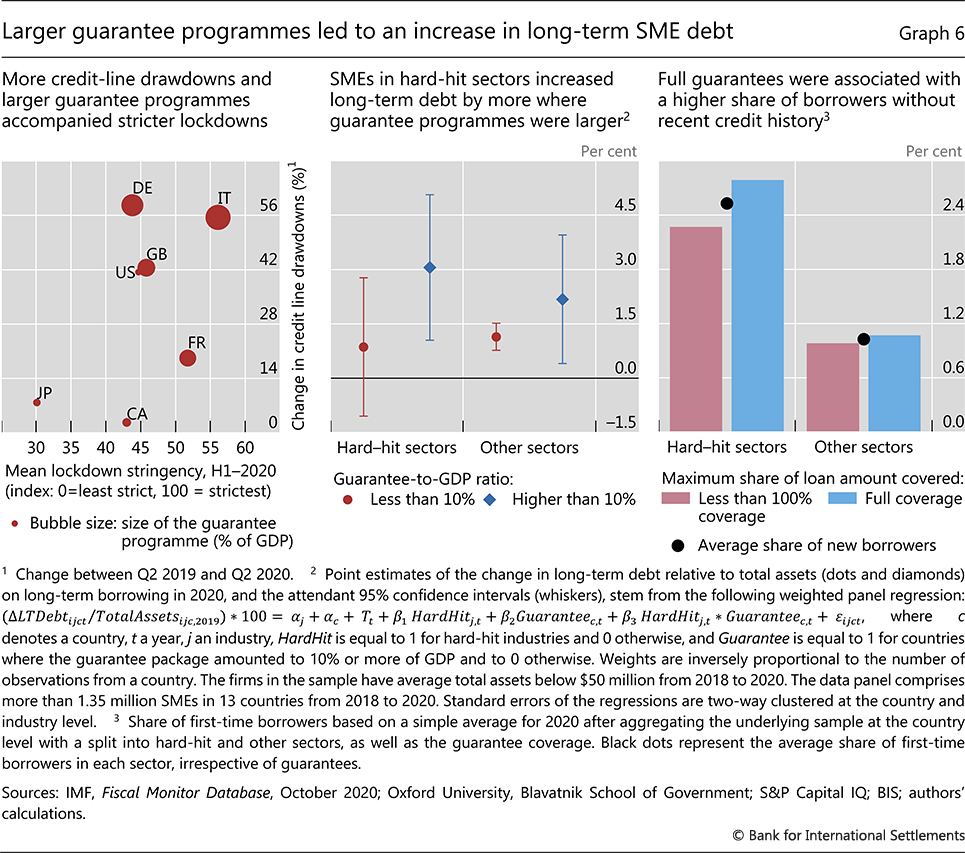
Next, we study whether guarantee programmes benefited borrowers that needed support. For this, we need to abstract from the drawdown of credit lines, as these reflect predetermined credit access as opposed to the effect of guarantees. Indeed, there is evidence that the drawdown of credit lines was more intense in countries that imposed stricter lockdowns during the early stages of the pandemic (Graph 6, left-hand panel). To look through such developments, which reflect mostly short-term instruments, we consider "long-term" borrowing – with remaining maturity longer than one year. In particular, we consider such borrowing by SMEs,10 which were a key target of guarantee programmes in many countries. Further, we highlight firms in sectors that were hard hit by Covid restrictions, and so may have been in greater need of funds.11
Our results suggest that SMEs, particularly those in sectors hard hit by Covid, were more likely to expand their "long-term" borrowing in countries with more generous guarantee programmes. Firms in such sectors increased their long-term debt by 3% of assets in countries where the announced guarantees amounted to 10% of GDP or more (Graph 6, centre panel). There was no such increase where the guarantee packages were smaller. Firms in other sectors seemed to benefit from larger guarantee programmes as well, but to a lesser degree.
We also find that the set of SMEs accessing bank credit expanded in countries with more generous guarantee terms. The share of firms that obtained new debt in 2020 and which had not raised any debt over the previous two years was substantially higher in hard-hit sectors, and was even higher in jurisdictions in which guarantees covered 100% of the loan. This share was 2.5% in hard-hit sectors, but only 1% in other sectors (Graph 6, right-hand panel, black dots). In hard-hit sectors, it was 2.3% when guarantees did not cover the full amount of the loan but rose to 2.8% with full coverage (bars). These results are consistent with evidence from Switzerland, where many SMEs without pre-existing bank debt are likely to have participated in the guaranteed loan programme (Fuhrer et al (2020)).
Admittedly, the data underpinning the analysis in this section do not allow us to identify what part of the lending during the pandemic was actually subject to guarantees. Regardless, the results suggest that guarantees – likely to have been supported by other fiscal support measures, such as furlough schemes, tax relief or direct subsidies (IMF (2021a)) – encouraged banks to lend by providing reassurance that credit risks had been contained and a self-reinforcing credit crunch had been avoided.
Moving forward: trade-offs and unwinding
Policy measures that helped expand bank lending capacity and provided incentives for banks to lend seemed to support lending through the Covid-19 pandemic. Existing capacity accommodated the sudden drawdown of pre-negotiated credit lines. Once the Covid-19 crisis set in, backstopping the erosion of bank capital was essential for supporting the further flow of credit. In turn, there needed to be incentives for banks to utilise that capacity for lending to new or existing borrowers. Loan guarantees provided such incentives. In sum, measures targeting banks and their borrowers directly appeared to be effective at cushioning the pandemic's fallout and prevented a simultaneous credit crunch across banks.
Looking forward, policymakers face the challenge of appropriately timing the phasing out of support measures. On the one hand, withdrawing guarantees too early might cause an abrupt credit crunch where collateral values are low, making it impossible for firms, especially SMEs, to roll over their debt. This in turn could generate a wave of defaults (Juselius and Tarashev (2021)). On the other hand, keeping guarantees for too long creates moral hazard by encouraging banks to lend to non-viable, over-indebted firms, with the risk of zombification and evergreening these loans (Borio and Restoy (2020)). Further, the larger the volume of guaranteed debt, the bigger the potential dent in sovereign budgets.
The sequence and speed of withdrawing the different policy measures is also key. It is important that banks maintain sufficient capacity to absorb any additional losses that may materialise when fiscal support and guarantees are withdrawn (Drehmann et al (2020)). It is with these losses in mind that supervisors will need to assess the adequacy of banks' capitalisation.
References
Araujo, D, B Cohen, and P Pogliani (2021): "Bank loan loss provisioning during the Covid crisis", BIS Quarterly Review, March.
Banerjee, R, J Noss and J Vidal Pastor (2021) "Liquidity to solvency: transition cancelled or postponed?", BIS Bulletin, no 40.
Bank for International Settlements (2020): Annual Economic Report 2020, June.
Basel Committee on Banking Supervision (2021): Early lessons from the Covid-19 pandemic on the Basel reforms, July.
Baudino, P (2020): "Public guarantees for bank lending in response to the Covid-19 pandemic", FSI Briefs, no 5.
Berrospide, J, A Gupta and M Seay (2021): "Un-used Bank Capital Buffers and Credit Supply Shocks at SMEs during the Pandemic", Finance and Economics Discussion Series 2021-043. Washington: Board of Governors of the Federal Reserve System.
Borio, C and F Restoy (2020): "Reflections on regulatory responses to the Covid-19 pandemic", FSI Briefs, no 1.
Cantu, C, P Cavallino, F De Fiore, and J Yetman (2021): "A global database on central banks' monetary responses to Covid-19", BIS Working Papers, no 934.
Chodorow-Reich, G (2014): "The employment effects of credit market disruptions: firm-level evidence from the 2008-9 financial crisis", The Quarterly Journal of Economics, vol 129, no 1, pp 1-59.
Coelho, R and R Zamil (2020): "Payment holidays in the age of Covid: implications for loan valuations, market trust and financial stability" FSI Briefs, no 8.
Drehmann, M, M Farag, N Tarashev and K Tsatsaronis (2020) "Buffering Covid-19 losses – the role of prudential policy", BIS Bulletin, no 9.
European Central Bank (2021): "Financial Stability Review, May 2021".
European Systemic Risk Board (2021): Financial stability implications of support measures to protect the real economy from the Covid-19 pandemic, February.
Fuhrer, L, M-A Ramelet and J Tenhofen (2021): "Firms' participation in the Swiss COVID-19 loan programme", Swiss Journal of Economics and Statistics, vol 157, no 2.
Falagiarda, M and Köhler-Ulbrich, P (2021): "Bank lending to euro area firms – What have been the main drivers during the Covid-19 pandemic?", European Economy.
Hardy, B (2021) "Covid-19 bank dividend payout restrictions: effects and trade-offs", BIS Bulletin, no 38.
International Monetary Fund (2021a): Global financial stability report, April.
----- (2021b): "Lending surveys monitor", June.
Juselius, M and N Tarashev (2021) "Could corporate credit losses turn out higher than expected ?", BIS Bulletin, no 46.
Kapan and C Minoiu (2021): "Liquidity insurance vs. credit provision: evidence from the Covid-19 crisis", mimeo.
Organization for Economic Cooperation and Development (2020): "Coronavirus (COVID-19): SME policy responses", OECD Policy Responses to Coronavirus (COVID-19), July.
Saporta, V (2021): "Emerging prudential lessons from the Covid-stress", speech at the Bank of England Webinar, 21 July.
Sveriges Riksbank (2020): "Financial Stability Report", November.
Svoronos, J-P and R Vrbaski (2020): "Banks' dividends in Covid-19 times", FSI Briefs, no 6, May.
Annex
1 The authors thank Patrizia Baudino, Claudio Borio, Stijn Claessens, Benjamin Cohen, Marc Farag, Ulf Lewrick, Benoit Mojon, Hyun Song Shin, Jean-Philippe Svoronos, Nikola Tarashev, Philip Wooldridge and Raihan Zamil for valuable comments and suggestions, and Anamaria Illes for excellent research assistance. All errors are our own. The views expressed in this article are those of the authors and do not necessarily reflect those of the Bank for International Settlements.
2 Chapter I of the BIS Annual Economic Report (2020) discusses a broad range of policy measures implemented in response to the pandemic and outlines remaining challenges. While this feature analyses the design and implications of some of the policy responses in more depth, important measures, such as monetary easing, remain out of scope.
3 IFRS stands for International Financial Reporting Standards. IFRS 9 require banks to provision against expected credit losses, rather than provisioning only once evidence of losses arise. These standards are more flexible, allowing banks to account for the expected policy support over the medium term when determining expected losses. See Araujo et al (2021).
4 By shifting all or part of the credit risk to the sovereign, guarantees on loans also expand capacity through lower risk weights and loss provisioning. In some cases, however, banks may need to assess if guaranteed loans would be non-performing. In addition, the loans typically remain on banks' balance sheet and affect the leverage ratio.
5 These measures could also serve as a substitute for new loans, reducing loan demand.
6 These terms may have affected banks' use of guarantee programmes. For example, anecdotal evidence from Sweden suggested that banks were reluctant to take up guaranteed loans unless the guarantee covered 100% of the loan (Sveriges Riksbank (2020)). More generally, while the announced size of guaranteed loans in Europe reached 10% of existing loans in the region, the attendant take-up as of September 2020 was below 2.8% (ESRB (2021)).
7 Overall, bank capital ratios improved during 2020 in many jurisdictions (BCBS (2021)). See www.bis.org/frame for evidence across a number of studies showing increased capital ratios leading to higher lending growth. The increases in capital in 2020 were largely through retained earnings, in some cases compelled via payout restrictions, as few banks issued new capital on the market. The results reported in this section are robust to using balance sheet changes over all of 2020.
8 Since changes in provisions and changes in capital are both included in the regression, the results indicate that both factors played a role in our sample. In principle, government guarantees can improve borrowers' credit quality from banks' perspective, thus driving both a lower LLR-to-asset ratio and higher lending. Nevertheless, we find that the results are robust to including announced guarantee package size as an additional explanatory variable in the regression.
9 The underlying surveys are administered to loan officers by banking supervisors in individual countries. The data are country aggregates and reflect these officers' opinions regarding changes in lending standards and demand conditions at their bank (IMF (2021b)).
10 We define SMEs as firms with total assets on balance-sheets not exceeding USD 50 million. SMEs generally do not issue significant amounts of debt securities, so their debt liabilities should largely comprise bank loans.
11 Sectors hard hit by Covid include airlines, hotel, restaurants and leisure, entertainment, textiles, apparel and luxury goods, as in Banerjee et al (2021).