Non-bank lenders in the syndicated loan market

Non-bank lenders are an important source of syndicated credit to non-financial corporates in most regions and industries. Their loan origination, however, is more concentrated by location and sector than that of banks and it is also more volatile. Syndicated loans arranged by non-banks carry a significantly higher spread relative to those by banks, consistent with the pattern that firms borrowing from non-banks are more leveraged and less profitable, ie riskier. Non-banks generally grant a smaller share of their new loans to foreign borrowers than banks do. During domestic financial crises, they reduce this share further, exacerbating the global transmission of shocks. 1
JEL classification: E51, F34, G21, G23.
The increasing footprint of non-bank financial intermediaries has put them front and centre of policymakers' agendas. While they can contribute to a more diversified and efficient financial system, non-banks can also be a source of instability due to, for instance, liquidity mismatches (Aramonte et al (2021)). With the March 2020 market turmoil serving as a case study, substantial efforts have been made to understand how such instability can unfold and what policy measures can mitigate it (Carstens (2021)).
The reach of non-banks extends beyond financial market conditions. Non-bank lenders represent an important source of funding for non-financial corporates (NFCs) in general (Aramonte and Avalos (2021)) and through syndicated loans in particular (Elliott et al (2019)). As non-banks extend syndicated loans in a highly procyclical fashion (Fleckenstein et al (2021)) and access to syndicated credit affects firm performance (Chodorow-Reich (2014)), their ubiquitous presence could drive real economy developments.
This special feature provides the first systematic overview of global syndicated lending by non-banks and contrasts it with that by banks.2 It further investigates the role of non-banks in cross-border spillovers during financial crises.
Key takeaways
- Non-banks' origination of syndicated loans to non-financial firms grew twentyfold from 1990, to $410 billion in 2019, and represents a sizeable share of the total in most regions and sectors.
- Non-banks' syndicated lending is more concentrated across countries and industries than that of banks and it is more volatile. It also carries higher spreads, partly reflecting riskier borrowers.
- In the wake of a crisis at home, non-banks curtail lending to foreign borrowers by more than they do to domestic ones, thereby transmitting shocks across countries.
The main findings are as follows.
First, non-banks play an important role in the syndicated loan market, but their lending patterns differ from those of banks. Non-banks have increased their yearly syndicated lending twentyfold over the past three decades, serving borrowers in all major regions and sectors. Their share in total new syndicated lending fluctuated between 7% and 18% over the same period. Non-bank lending is more concentrated by geographical location and sector than bank syndicated lending. While non-banks' credit provision tends to ebb and flow with that of banks, it is more volatile and contracted more during the Great Financial Crisis (GFC).
Second, loans arranged by non-bank lenders carry materially higher spreads than those arranged by banks. The difference in spreads largely reflects a riskier pool of borrowers and associated risk premia, rather than differences in loan terms.
Finally, when facing domestic financial crises, non-bank arrangers retrench particularly forcefully from abroad. In general, non-banks exhibit a stronger home bias than banks, as foreign borrowers account for a smaller share in their syndicated lending. During a financial crisis in their home country, non-banks further reduce their credit provision abroad, and do so more than banks. Such retrenchment, so far established for banks only (Giannetti and Laeven (2012)), suggests that non-banks transmit financial shocks across countries.
The rest of this article is organised as follows. The first section discusses the main features of syndicated lending and the classification of lenders into banks and non-banks (Box A). The second section documents patterns in non-bank syndicated lending across countries, industrial sectors and over time. The third discusses differences in loan terms and borrower characteristics between banks and non-bank lenders, assessing to what extent they explain loan spreads. The fourth section investigates how non-banks adjust their lending in foreign and domestic markets during domestic financial crises, with details summarised in Box B. The final section concludes with policy considerations.
The syndicated loan market and non-bank lenders
Syndicated loans are an important financing source for non-financial firms. They represent around three quarters of total cross-border lending to NFCs in high- and middle-income countries (Doerr and Schaz (2021)) and are particularly important for larger firms (Cerutti et al (2015)). Consequently, changes in the supply of syndicated credit influence firm investment and employment (Acharya et al (2018)).3
A syndicated loan is granted by a group of financial institutions (the "syndicate") to a single borrower. The lending syndicate includes at least one lead institution (the "lead arranger(s)", sometimes called "underwriter(s)") as well as one or more participants. Lead arrangers negotiate preliminary loan terms and conditions and, upon agreement with the borrower, put together the group of participants to fund parts of the total loan amount. In return, lead arrangers receive an arrangement fee (Gadanecz (2004)).
In the loan's life cycle, lead arrangers typically act as the agent bank and perform due diligence. They ensure screening and monitoring, govern the terms of the loans and enforce covenants. In line with their responsibility as monitors, lead arrangers retain a larger portion of the loan on their balance sheets, while participants often sell their tranches on the secondary market (Sufi (2007)).
This feature analyses loan originations using detailed deal-level data on global syndicated lending from Thomson Reuters' DealScan. The sample period is from 1990 to 2019. Information on loans at origination includes the loan amount, maturity, currency of denomination and interest rate, as well as the identity, type, location and industry code of borrowers and lenders (banks as well as non-banks). All loan amounts are converted to US dollars. To attribute loan portions among members, we use the allocation provided by DealScan or, if this is not available, allocate pro rata. Henceforth, we will refer to the syndicated loan amounts attributed at origination to banks or non-banks as "bank loans" or "non-bank loans", respectively. There is no public information to track loan sales on the secondary market.4
We identify non-bank lenders based on information provided by DealScan, in combination with Standard Industrial Classification codes, string search and manual checks. In our sample, non-bank lenders include investment banks (or broker-dealers), finance companies and mutual funds – in line with the categorisation used by the Financial Stability Board (2021).5 Investment banks and finance companies account for over four fifths of aggregate non-bank syndicated lending.
Non-bank lenders have gained a large footprint in the syndicated loan market and their participation is now comparable with that of banks along important dimensions. The share of all loan facilities with non-bank involvement exceeds one third. Around two fifths of all non-bank lenders active in the syndicated loan market act as lead arrangers, a share similar to that of banks. Likewise, individual members of both types contribute comparable shares to the total syndicated amount on average and extend loans for similar purposes (eg working capital, debt repayment or capital expenditure). That said, credit lines are more common among banks at origination and term loans are more common among non-banks.
Box A presents further details on the data construction, classification of banks and non-bank lenders, and their role in syndicates.
Patterns in non-bank syndicated lending
Non-bank syndicated lending has grown with the overall market, both domestically and internationally. Total new syndicated lending to NFCs increased substantially, from under $300 billion originated in 1990 to around $4,750 billion in 2019. Non-bank lending increased from $20 billion to $410 billion per year over the same period (Graph 1, left-hand panel). Its share of total loan originations steadily increased to around 14% in 2007 but contracted sharply during the GFC. This share trended up again from 2010 to 2019. Foreign loans, ie loans to borrowers located in a jurisdiction other than the lender's home country, follow a similar pattern, albeit at a lower level.
Growth in non-bank syndicated lending is more volatile than that of banks. On average across borrower countries, the standard deviation of the growth in loan origination is almost 60% higher for non-bank than bank loans (Graph 1, centre panel). While the volatility is in general higher for emerging market economy (EME) borrowers than for those from advanced economies (AEs), non-bank lending is more volatile than bank lending in both regions. Higher volatility meant greater procyclicality during the GFC, when non-banks cut their syndicated loan origination by twice as much as banks, in a pattern typical for crisis times (Fleckenstein et al (2021), Aldasoro et al (2022b)).
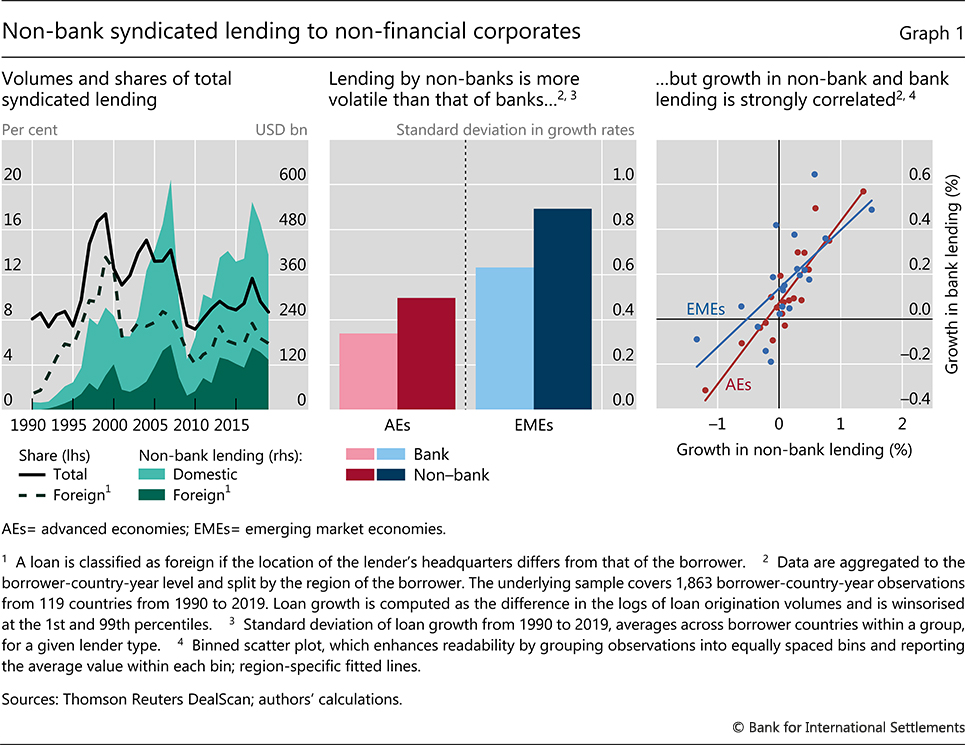
Differences in volatilities notwithstanding, bank and non-bank lending move in tandem, especially for loans granted to borrowers from AEs. The overall correlation between bank and non-bank loan growth stands at 0.50 on average across borrower countries. For loans granted to NFCs in EMEs, the correlation is 0.36, whereas it is 0.54 in AEs (Graph 1, right-hand panel). Together with the greater volatility in loan originations, this positive correlation casts doubt on the notion that non-banks provide a "spare tyre" for borrowers when banks retrench.
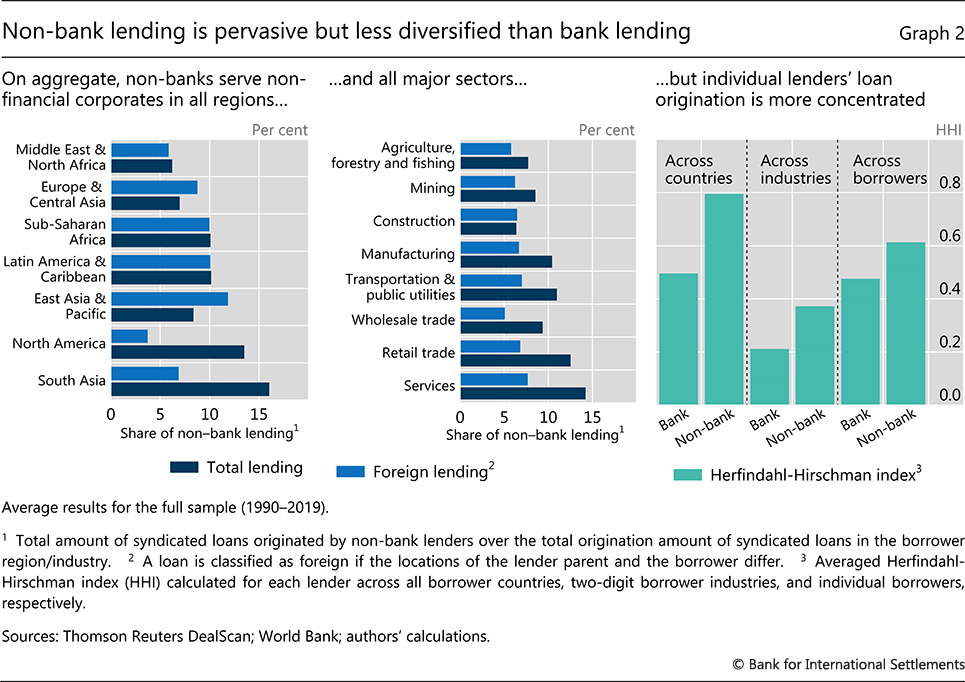
Non-banks serve firms in all regions and sectors. In terms of geographical reach over the full sample period, the share of non-bank loans in total loans is largest in South Asia and that in foreign loans is largest in East Asia and the Pacific (Graph 2, left-hand panel). Among the major economies, the share of syndicated borrowing from non-banks averages 14% for the United States and 3% for China. In terms of sectoral presence, the average share of non-bank loans in total new syndicated lending ranges from 6.4% in the construction sector to 14.2% in services (centre panel).
Despite their global presence, non-banks' origination of loans is more concentrated than that of banks. The average non-bank serves fewer distinct borrowers than the average bank (around 330 vs 740 per year) and does so in a narrower set of regions and sectors. Accordingly, loan origination by non-banks is more concentrated across borrower countries and industries (Graph 2, right-hand panel).
Loan terms and borrower characteristics
We first provide a comparison of banks' and non-banks' borrower characteristics and syndicated loan terms. Then, motivated by the patterns thus revealed, we zoom in on potential drivers of the notable difference in loan spreads.
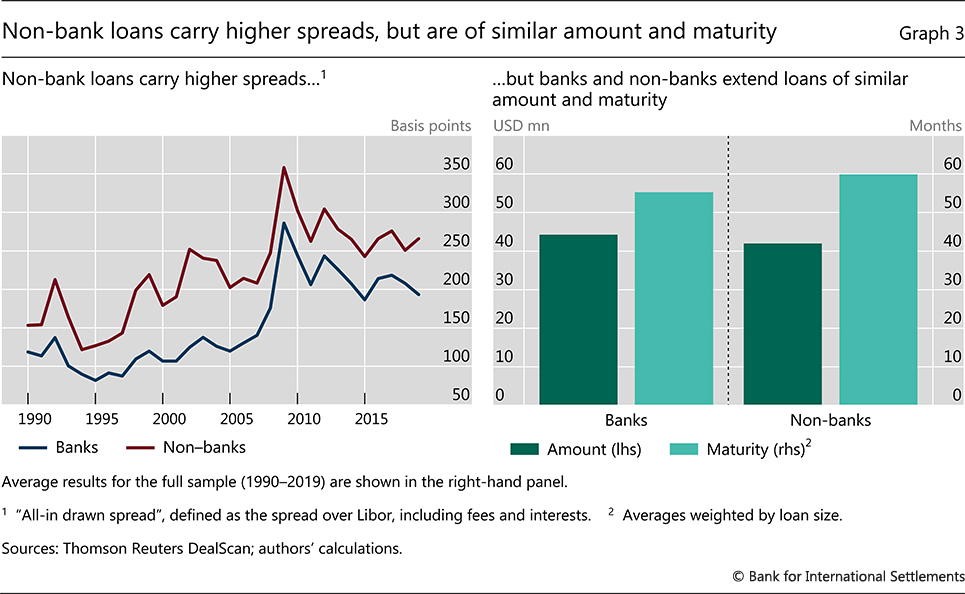
Loans with non-bank participation carry materially higher spreads than those with bank participation only. The average all-in spread, defined as the annual spread over Libor, including fees and interests and weighted by loan size, equals 253 basis points on syndicated loans with non-bank involvement, vastly exceeding that on bank-only loans (170 basis points). While average spreads trended upwards until 2010 and receded somewhat since then for both lender types, the difference in loan spreads has remained relatively constant (Graph 3, left-hand panel). These patterns are robust to zooming in on lead arrangers only.
- S Aramonte and F Avalos (2021): The rise of private markets, BIS Quarterly Review, December.
-
S Aramonte, A Schrimpf and H S Shin (2021): Non-bank financial intermediaries and financial stability, BIS Working Papers, no 972, October.
-
A Carstens (2021): Non-bank financial sector: systemic regulation needed, BIS Quarterly Review, December.
Banks and non-banks originate loans of similar amounts and maturity. The average loan amount granted by banks stands at $44 million, roughly the same as the $42 million granted by non-bank lenders (Graph 3, right-hand panel). The corresponding maturities are also similar, at 60 and 55 months respectively. Again, the patterns persist when considering lead arrangers only.
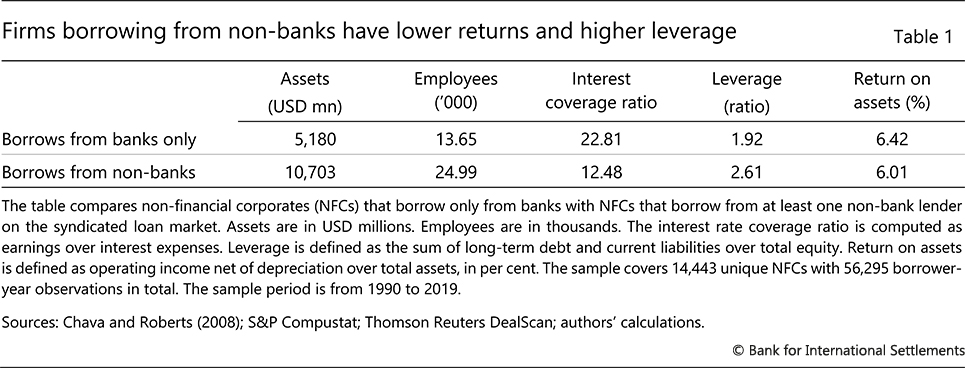
By contrast, firms borrowing from syndicates with non-bank lenders appear to be riskier.6 The average firm receiving syndicated credit from non-banks has a lower return on assets, higher leverage and a lower interest coverage ratio than firms obtaining syndicated loans from banks only (Table 1). Unreported tests show that these differences remain material even among firms of similar size and operating in the same location and industry. They are also present when we classify firms by their connection to bank or non-bank lead arrangers.
We now examine to what extent loan and borrower characteristics drive the spread differential in a regression analysis. The analysis focuses on lead arrangers as they negotiate loan terms and usually contribute material shares to the syndication amount.
Loan characteristics explain only a small part of the spread differential. We start by recording that the average loan spread on loans with non-bank arrangers is 84 basis points higher than on those without (Table 2, column 1). Accounting for loan amounts, maturity and loan currency narrows the gap only marginally, to 77 basis points (column 2). This is consistent with the earlier finding that loan terms are broadly comparable across lender types.
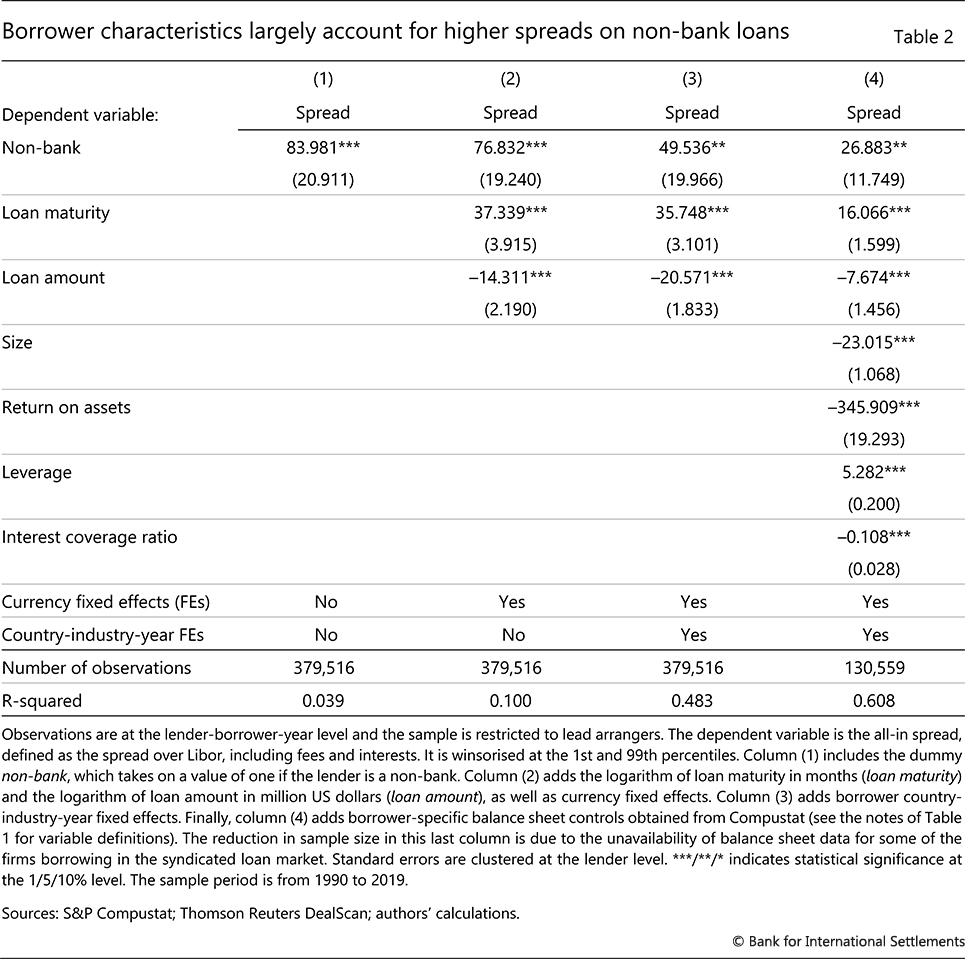
Borrower characteristics, on the other hand, explain a significant fraction of the higher spread on loans arranged by non-banks. Accounting for borrowers' country and industry as well as the year of origination reduces the difference by one third, to 50 basis points (Table 2, column 3). Further considering differences in borrower characteristics such as size, profitability and leverage halves the remaining difference to 27 basis points (column 4). Thus, borrower riskiness is a key driver of the spread differential.7
The remaining difference in loan spreads between bank and non-bank arrangers could be explained by lender-specific factors. For example, a closer lender-borrower relationship has been shown to lead to higher spreads to compensate for better access to credit during shocks (Bolton et al (2016)). Lower geographical diversification has also been associated with higher spreads (Keil and Müller (2020)). Further, a higher market share in a sector could allow lenders to charge relatively higher interest rates (De Jonghe et al (2020)). Exploring these dimensions in the context of non-banks would be an interesting avenue for future work.
Non-banks and the global transmission of shocks
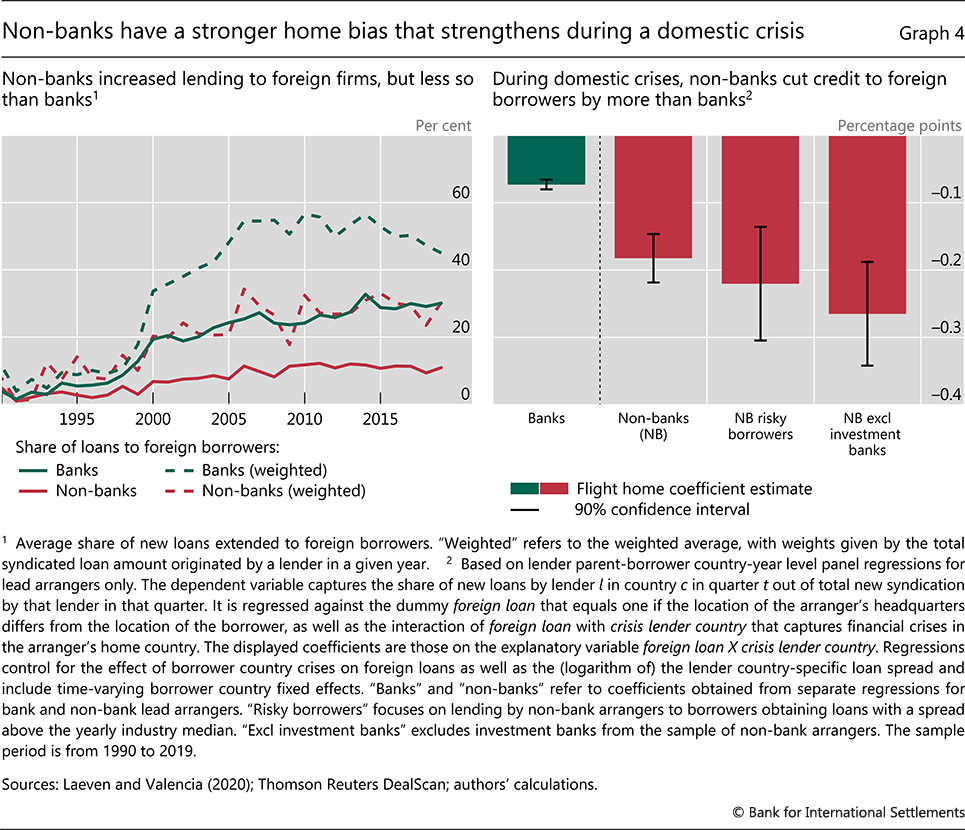
Non-banks' large global footprint could have implications for shock transmission across borders. As the volume of non-banks' syndicated lending expanded, so did the attendant share of credit to foreign borrowers, from 3% for the average lender in the early 1990s to 11% in 2019 (Graph 4, left-hand panel). This share is even higher for larger lenders. A retrenchment of such international presence could have material implications in the borrower countries.
To investigate how non-banks' global lending responds to negative shocks, we analyse whether non-bank lenders exhibit a "flight home" effect. So far established for banks only, this effect refers to banks cutting their lending in foreign markets by more than they do in their domestic market following a financial crisis in their home country (Giannetti and Laeven (2012)). The relative retrenchment has been shown to be stronger for banks with higher exposure to risky clients and less stable funding sources.
Non-banks are likely to exhibit a more pronounced flight home effect relative to banks. Not only do non-banks serve riskier borrowers, but they also rely more on wholesale funding (Jiang et al (2020), Fleckenstein et al (2021)). Such funding is more sensitive to price changes than retail deposits are, and makes lenders – non-banks and banks alike (Aldasoro et al (2022a)) – more vulnerable to negative liquidity shocks (Demirgüç-Kunt and Huizinga (2010), Ivashina and Scharfstein (2010)).
We find that, during a financial crisis in their home country, non-bank lead arrangers reduce the share of loans to foreign borrowers by more than bank lead arrangers.8 Both banks and non-banks curtail credit to foreign borrowers by more than to domestic ones, even after controlling for crises in foreign countries. However, while the share of new loans to foreign borrowers declines by 7.3 percentage points for banks, it falls by 18.2 percentage points for non-banks (Graph 4, right-hand panel). Box B provides details of the estimation.
The relative retrenchment is more pronounced for non-bank lending to risky borrowers and among non-banks with less stable funding. Non-banks contract their share of foreign loans by 22 percentage points when considering only the subset of risky borrowers, defined as those obtaining loans with a spread above the yearly industry median. Excluding investment banks, in turn, leads to a decline of 26.5 percentage points. This may reflect the fact that some investment banks tend to have more stable funding than other types of non-bank lender (eg when they are part of a bank holding company).
These findings suggest that non-banks transmit financial shocks acrosscountries, and by more than banks do. As a large literature has found that contractions in syndicated lending reduce firm investment and employment,9 non-banks' retrenchment is likely to have consequences for the real economy.
Conclusion
Policymakers have so far mostly focused on the role of non-banks during severe market stress. Yet, non-banks are also important providers of credit to non-financial corporates across the globe. Indeed, this feature finds that, relative to banks, non-banks lend to a riskier pool of borrowers. To the extent that such firms have limited access to financing (Chernenko et al (2021)), non-bank lenders contribute to a more diversified and efficient financial system. That said, the global footprint of non-bank lenders may be a destabilising force. Not only is their credit provision more volatile, possibly reflecting their greater reliance on wholesale funding, but it is also more concentrated than that of banks. The resulting procyclicality of non-bank lending warrants continued analysis, as does the tendency of non-bank lenders to transmit shocks across borders to a larger extent than banks do.
References
Acharya, V, T Eisert, C Eufinger and C Hirsch (2018): "Real effects of the sovereign debt crisis in Europe: evidence from syndicated loans", Review of Financial Studies, vol 31, no 8, pp 2855–96.
Aldasoro, I, J Caparusso and Y Chen (2022a): "Global banks' local presence: a new lens", BIS Quarterly Review, March.
Aldasoro, I, S Doerr and H Zhou (2022b): "Non-bank lending during financial crises", working paper.
Aramonte, S and F Avalos (2021): "The rise of private markets", BIS Quarterly Review, December, pp 69–82.
Aramonte, S, S J Lee and V Stebunovs (2019): "Risk taking and low longer-term interest rates: evidence from the US syndicated term loan market", Journal of Banking & Finance, forthcoming.
Aramonte, S, A Schrimpf and H S Shin (2021): "Non-bank financial intermediaries and financial stability", BIS Working Papers, no 972, October.
Bolton, P, X Freixas, L Gambacorta and P Mistrulli (2016): "Relationship and transaction lending in a crisis", Review of Financial Studies, vol 29, no 10, pp 2643–76.
Carstens, A (2021): "Non-bank financial sector: systemic regulation needed", BIS Quarterly Review, December, pp 1–6.
Cerutti, E, G Hale and C Minoiu (2015): "Financial crises and the composition of cross-border lending", Journal of International Money and Finance, vol 52, pp 60–81.
Chava, S and M Roberts (2008): "How does financing impact investment? The role of debt covenants", Journal of Finance, vol 63, no 5, pp 2085–121.
Chernenko, S, I Erel and R Prilmeier (2021): "Why do firms borrow directly from nonbanks?", working paper.
Chodorow-Reich, G (2014): "The employment effects of credit market disruptions: firm-level evidence from the 2008–09 financial crisis", Quarterly Journal of Economics, vol 129, no 1, pp 1–59.
Chodorow-Reich, G and A Falato (2022): "The loan covenant channel: how bank health transmits to the real economy", Journal of Finance, vol 77, no 1, pp 85–128.
De Jonghe, O, H Dewachter, K Mulier, S Ongena and G Schepens (2020): "Some borrowers are more equal than others: bank funding shocks and credit reallocation", Review of Finance, vol 24, no 1, pp 1–43.
Demirgüç-Kunt, A and H Huizinga (2010): "Bank activity and funding strategies:the impact on risk and returns", Journal of Financial Economics, vol 98, no3, pp 626–50.
Doerr, S, M Raissi and A Weber (2018): "Credit-supply shocks and firm productivity in Italy", Journal of International Money and Finance, vol 87, no 10, pp 150–71.
Doerr, S and P Schaz (2021): "Geographic diversification and bank lending during crises", Journal of Financial Economics, vol 140, no 3, pp 768–88.
Elliott, D, R Meisenzahl, J-L Peydro and B Turner (2019): "Nonbanks, banks and monetary policy: US loan-level evidence since the 1990s", working paper.
Elliott, D, R Meisenzahl and J-L Peydro (2021): "Nonbank lenders as global shock absorbers: evidence from US monetary policy spillovers", working paper.
Financial Stability Board (2021): Global monitoring report on non-bank financial intermediation, December.
Fleckenstein, Q, M Gopal, G Gutierrez Gallardo and S Hillenbrand (2021): "Nonbank lending and credit cyclicality", working paper.
Gadanecz, B (2004): "The syndicated loan market: structure, development and implications", BIS Quarterly Review, December, pp 75–89.
Giannetti, M and L Laeven (2012): "The flight home effect: evidence from the syndicated loan market during financial crises", Journal of Financial Economics, vol 104, no 1, pp 23–43.
Güler, O, M Mariathasan, K Mulier and N Okatan (2021): "The real effects of banks' corporate credit supply: a literature review", Economic Inquiry, no 59, pp 1252–85.
Hale, G, T Kapan and C Minoiu (2020): "Shock transmission through cross-border bank lending: credit and real effects", Review of Financial Studies, vol 33, no 10, pp 4839–82.
Ivashina, V and D Scharfstein (2010): "Bank lending during the financial crisis of2008", Journal of Financial Economics, vol 97, no 3, pp 319–38.
Jiang, E, G Matvos, T Piskorski and A Seru (2020): "Banking without deposits: evidence from shadow bank call reports", working paper.
Keil, J and K Müller (2020): "Bank branching deregulation and the syndicated loan market", Journal of Financial and Quantitative Analysis, vol 55, no 4, pp 1269–303.
Laeven, L and F Valencia (2020): "Systemic banking crises database II", IMF Economic Review, vol 68, pp 307–61.
Sette, E and G Gobbi (2015): "Relationship lending during a financial crisis", Journal of the European Economic Association, vol 13, no 3, pp 453–81.
Sufi, A (2007): "Information asymmetry and financing arrangements: evidence from syndicated loans", Journal of Finance, vol 62, no 2, pp 629–68.
Xiao, K (2020): "Monetary transmission through shadow banks", Review of Financial Studies, vol 33, no 6, pp 2379–420.
1 The authors thank Sirio Aramonte, Fernando Avalos, Frédéric Boissay, Claudio Borio, Stijn Claessens, Egemen Eren, Blaise Gadanecz, Ulf Lewrick, Hyun Song Shin, Philip Wooldridge, Youngsuk Yook and Nikola Tarashev for valuable comments and suggestions, and Murphy Pan for excellent research assistance. The views expressed in this article are those of the authors and do not necessarily reflect those of the Bank for International Settlements.
2 Syndicated lending by banks has been studied extensively (see Güler et al (2021) for a summary).
3 For the real effects of bank syndicated lending, see also Doerr et al (2018), Hale et al (2020) and Chodorow-Reich and Falato (2022). These papers build on work showing that lender-borrower relationships are sticky and that the costs of switching between lenders are high, especially during downturns (Sette and Gobbi (2015), Bolton et al (2016)).
4 While such information is important to accurately assess lenders' risk exposures, it is less relevant for understanding patterns in the origination of new credit, which is key from the borrower's perspective and is the focus of this special feature. That said, non-banks purchase a significant amount of loans in the secondary market (Aramonte et al (2019)). Accordingly, loan volumes at origination probably represent a lower bound of the ultimate financing provided by non-banks to NFCs.
5 Broadly speaking, non-bank lenders differ from banks in their funding structure and their lack of access to public backstops. For example, their funding tends to be largely wholesale (Jiang et al (2020), Xiao (2020)) and they are not eligible for deposit insurance. There is, however, no harmonised or universally accepted definition of non-bank lenders.
6 We link the DealScan data set to balance sheet data on listed firms from Compustat Global and North America following the updated matching table of Chava and Roberts (2008). Around 40% of all observations are matched, as not all borrowing firms are covered in Compustat. Firms borrowing from at least one non-bank in a given year account for 19,500 firm-year observations. The small sample of firms borrowing exclusively from non-banks (ca 2,500 observations) exhibits similar patterns in the measures of risk. Among firms with credit ratings, the share rated high-yield is significantly higher for NFCs borrowing from non-banks.
7 Results are qualitatively similar when all syndicate participants are included (the coefficient estimates on the dummy variable non-bank are 83 basis points, 72 basis points, 50 basis points and 30 basis points in columns 1, 2, 3 and 4, respectively). They are similarly robust in regressions weighted by each lender's contribution to the total syndicated amount (105 basis points, 95 basis points, 66 basis points and 50 basis points in columns 1, 2, 3 and 4, respectively). Re-classifying investment banks as banks results in coefficient estimates of 80 basis points, 69 basis points, 50 basis points and 29 basis points. Finally, comparing loans exclusively arranged by non-banks (7% of all loans) with those arranged by banks only (72%) yields coefficient estimates of 163 basis points, 151 basis points, 115 basis points and 76 basis points. The robust effect of borrower characteristics on spread differentials is in line with evidence for mid-sized US companies (Chernenko et al (2021)).
8 In terms of total lending, banks and non-bank lenders reduce their loan origination by a respective 3.3% and 5.4% during domestic crises. For the identification of financial crises, we rely on Laeven and Valencia (2020). The two conditions defining a banking crisis are significant signs of financial distress in the banking system and significant banking policy intervention measures in response to losses in the banking system.
9 See above for the real effects of bank syndicated lending. Elliott et al (2019, 2021) and Aldasoro et al (2022b) establish the real effects of non-bank syndicated lending.