Markets jolted

Before the sharp escalation of geopolitical tensions ushered in a new wave of uncertainty, financial markets had been jolted by signals of a global shift towards a quicker pace of monetary policy tightening. During the period under review,1 government bond yields increased significantly. Stock markets fell amid an investor rotation away from technology and other growth stocks and into value stocks. Corporate credit spreads were little affected, by comparison. Financial conditions tightened moderately in non-Asian emerging market economies (EMEs).
Inflationary pressures intensified globally over the three-month period ending 21 February, even though the impact of the Omicron variant faded quickly. While a traditional inflation hedge – gold – was flat, a surge in energy commodity prices and persistent supply chain bottlenecks played a key role in the high inflation readings.
In this environment, investors appeared unnerved by the prospect of a determined monetary policy tightening on a global scale. Nominal bond yields increased materially in most advanced economies (AEs) starting in mid-December, as investors' perception of a shift by the Federal Reserve firmed up. The increase in nominal yields translated mostly into a surge of real yields – while inflation compensation moved sideways. That said, real (inflation-adjusted) yields remained largely in negative territory. In the United States, the runups in rates were tilted towards the short end of the yield curve, which flattened with respect to the term structure of other AEs. The dollar appreciated against AE currencies, particularly with respect to those of central banks less advanced in the tightening cycle. In the euro area, the Fed and the ECB's tightening guidance widened peripheral spreads to bunds.
The monetary policy shift left a clear imprint on risky assets. Global equity markets were on the back foot in the first weeks of 2022. Technology stocks – seen as more sensitive to interest rate changes – suffered large valuation losses in January as investors rotated towards energy and value stocks. Surprisingly perhaps, corporate spreads widened modestly overall, even narrowing for sectors initially harmed by the emergence of Omicron. Similar to equities, credit spreads reflected a rotation away from technology into energy and value.
In EMEs, financial conditions were mixed but remained largely stable. Local currency yields increased more at the short end, particularly in non-Asian countries. Spreads on dollar-denominated debt rose moderately across the board. In China, the central bank gradually added support, as the economy appeared to struggle with persistent headwinds coming from the real estate sector and a new wave of Covid-19. Exchange rates vis-à-vis the US dollar were flat, except for Latin American currencies which appreciated significantly. Portfolio flows into Asian EMEs regained momentum, supporting less stringent financial conditions than in other EMEs.
Key takeaways
- In the three-month period ending 21 February, fixed income markets were jolted by the sudden shift towards a tighter monetary policy outlook amid persistently high inflation readings.
- Stock markets plummeted but corporate credit spreads widened only modestly, while investors rotated away from sectors seen as particularly sensitive to interest rate hikes.
- EMEs faced mixed financial conditions, with favourable investor sentiment towards Asian economies and more pronounced bond yield increases in other regions.
Bonds repriced sharply as the policy outlook shifts
Amid persistently high inflationary pressures during the period under review, investors reacted strongly to a global monetary policy outlook that turned markedly less accommodative. Rates on government fixed income securities increased substantially. As short-term rates rose more than long-term ones, the term structure in the United States flattened vis-à-vis those of most other AEs. In contrast to last October, higher nominal yields resulted mainly in increased real yields, with little change in inflation compensation. The dollar appreciated, particularly against AE currencies with a looser monetary policy outlook.
Several central banks tightened policy during the review period, but timings varied. As inflation pressures intensified, investors began to anticipate an acceleration in the pace of accommodation removal by the Federal Reserve from late November, particularly following the mid-December Federal Open Market Committee (FOMC) meeting. The late January FOMC meeting seemed to consolidate the views of investors that a tightening could start with a lift-off in March and continue with the central bank's balance sheet shrinking at a quick pace soon thereafter. Several other central banks in both AEs and EMEs hiked policy rates further, including those in the United Kingdom (which also announced upcoming sales of corporate bonds), New Zealand, Norway, Korea, and the major Latin American and EMEA countries.2 In January, the Reserve Bank of Australia announced the end of its asset purchase programme. In December, the ECB also communicated a gradual scaling down of its balance sheet policies.3 Moreover, in February, the ECB tilted its guidance in a less accommodating direction. Among the major AE central banks, only the Bank of Japan (BoJ) kept its stance unchanged. In contrast, the People's Bank of China (PBoC) actually loosened policy.
The impact on short-term rates was particularly strong in the United States. Soon after the release of the minutes of the December FOMC meeting on 5 January, the December 2023 futures rate breached the corresponding dot plot projection. Likewise, key money market interest rates soared in January, moving above the Federal Reserve's policy target range for the first time in over a year (Graph 1, first panel, green and brown lines). This shift intensified in early February, as the US Consumer Price Index (CPI) showed an unexpectedly high reading. Overnight repo rates (blue line), however, remained pinned at the level of the overnight reverse repo facility.
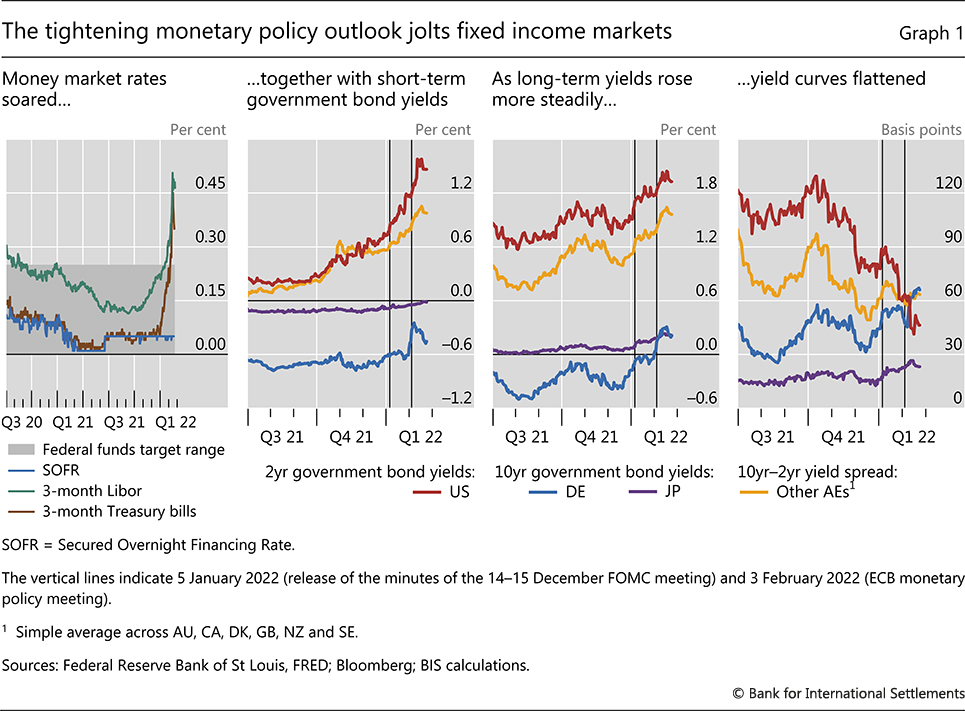
The expectation of higher policy rates boosted nominal bond yields in most AEs, particularly at the short end. Initially, short-term yields increased most in the United States (Graph 1, second panel). The subsequent spillover to other sovereign yields suggested that investors expected the corresponding central banks to follow suit. Short rate increases were initially muted in the euro area. But the tightening shift in the ECB's guidance in February surprised investors, triggering a jump in the euro area's short end as well.
Long-term yields moved largely in sync across all AEs. Following the release of the minutes of the FOMC December meeting in early January, the yield on the 10-year bund approached zero for the first time since early 2019 (Graph 1, third panel). Similarly, the yield on 10-year Japanese government bonds (JGBs) reached its highest level in five years. Long yields received another push up across all AEs in the wake of the ECB meeting in early February. The repricing was sharpest for long-term bund yields, which moved decisively into positive territory. US long-term yields also rose during this period but by much less than short yields. Thus, the US yield curve flattened markedly with respect to those of other AEs, which mostly steepened to varying degrees (fourth panel).
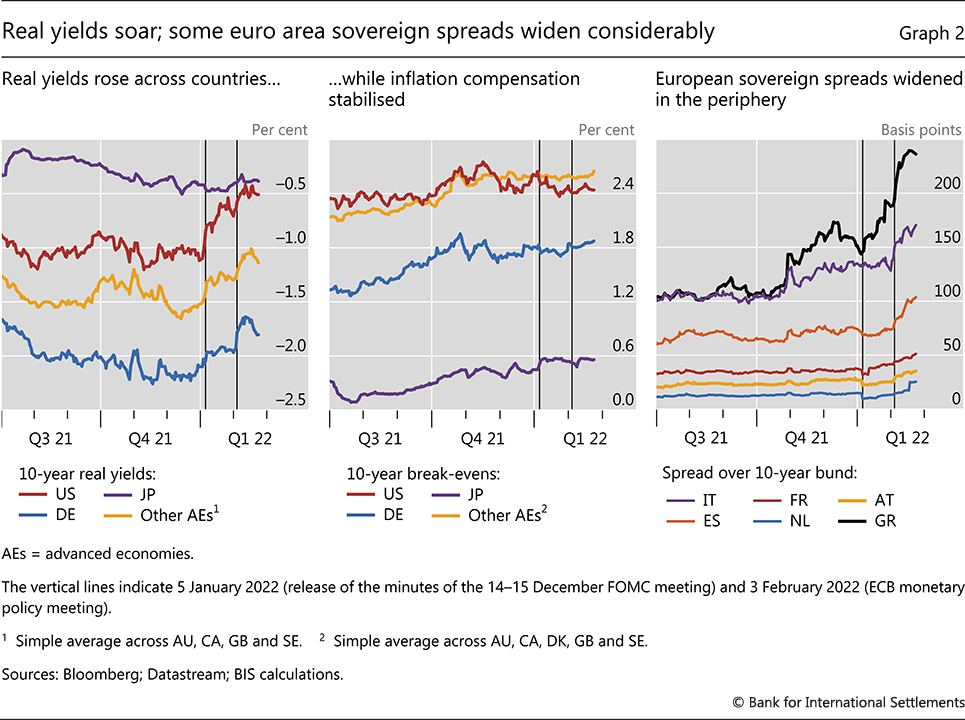
The increase in nominal long-term rates largely reflected a surge in real (inflation-adjusted) yields. For instance, the yield on the 10-year US Treasury inflation-protected note increased about 60 basis points by mid-February (Graph 2, left-hand panel), more than the roughly 40 basis points increase in the corresponding nominal yield. Similar shifts occurred in other AEs except Japan, where real yields hardly moved. As a result, inflation compensation remained largely flat and even trended down in some AEs, after rising during the first three quarters of 2021 (centre panel). This reflected the stabilisation of inflation expectations across maturities except at the short end, which saw considerable volatility.
As the monetary policy outlook tightened in core markets, investors also reassessed sovereign credit risk in the euro area, causing sovereign spreads for some euro area countries to widen. Spreads relative to German bunds had been trending upwards since early Q3 2021. They rose in January with the FOMC minutes, and again in February when the ECB adjusted its guidance (Graph 2, right-hand panel). To varying degrees, investors perceived Greece, Italy and Spain as more exposed to a tightening of the ECB policy stance, and in particular the termination of asset purchases.
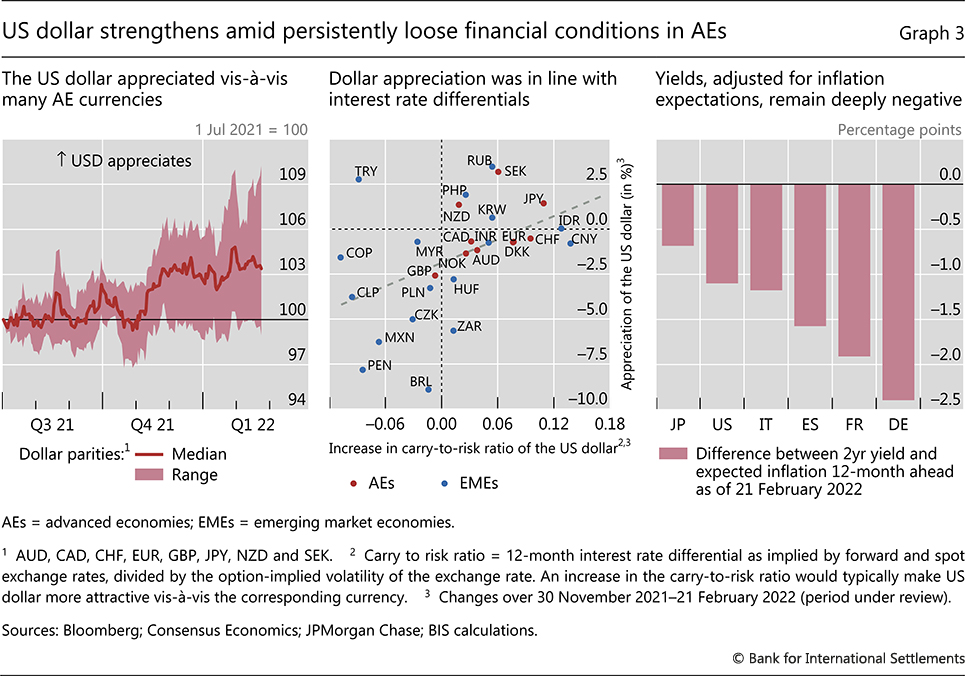
In this environment, the US dollar gained vis-à-vis AE currencies. The dollar had begun to appreciate in October 2021, as news on inflation worsened and investors appeared to anticipate a policy change (Graph 3, left-hand panel, red line). The currency extended its gains following the January FOMC meeting. As monetary policy stances among AEs diverged, the dispersion of their exchange rates against the dollar widened (red area). The dollar appreciated the least vis-à-vis the currencies of those AE countries that were perceived as more advanced in their tightening cycles, as captured by relative changes in risk-adjusted interest rate differentials (centre panel). The United Kingdom, Norway and Australia saw their respective currencies appreciate against the US dollar, whereas the Swedish krona and the yen depreciated. The euro depreciated in January and bounced back in February, seemingly supported by the ECB meeting guidance. The Swiss franc was an exception in this context, as its strength was possibly boosted by safe haven flows linked to geopolitical concerns.
Overall, financial conditions remained very loose in all major AEs during the review period. Despite their increases, the long-term real yields in all major AEs remained below zero, where they have been since the outbreak of the pandemic or earlier. Real yields were even more negative at the short end, especially when derived from analysts' inflation expectations. For instance, the spread between the nominal yield on two-year government bonds and expected inflation over the next 12 months stayed in deeply negative territory in many large AEs, notably in the euro area (Graph 3, right-hand panel).
Financial condition indexes, which rely on a number of indicators, showed some moderate tightening, particularly for the United States, where conditions returned to the average over the period following the pandemic outbreak, while still remaining in loose territory. Conditions tightened marginally in the euro area and Japan but also remained generally loose. Most of the tightening stemmed from the increase in long-term yields and the sharp fall in equity prices.
Rotation across risky assets intensifies
Global stock markets saw significant upheaval during the review period. In contrast, corporate bond markets were little affected, as credit spreads remained generally compressed. Overall, investors rotated away from sectors particularly sensitive to interest rates, and into energy and some sectors initially harmed by the pandemic.
Equity markets declined globally with the central banks' shift in policy stance. The drop in AEs was stronger than that in EMEs, except for China (Graph 4, first panel). In January, US equities suffered their worst month since the beginning of the pandemic. The surge in real yields underlay the swift adjustment in the valuations of US stocks. Market commentary was rife with speculation about the size and timing of the lift-off and its possible implications for financial markets. The prospect of an earlier and faster than anticipated balance sheet run-off also contributed to these concerns.
The prevailing uncertainty manifested itself in asset prices differently from the recent past. In the second half of 2021, the uncertainty had surfaced as higher downside than upside risks (blue line, second panel of Graph 4). In early 2022 however, the likelihood of the two sets of outcomes was seen as less skewed even as the range of possibilities – ie the implied volatility – widened (red line).
The prospect of higher yields weighed on sectors particularly sensitive to interest rates. As such, technology stocks underperformed most other sectors globally (Graph 4, third panel). This was part of a general rotation from rate-sensitive growth stocks to value stocks (Box A). In addition, energy stocks outperformed other sectors across most jurisdictions, probably supported by rising oil and gas prices.
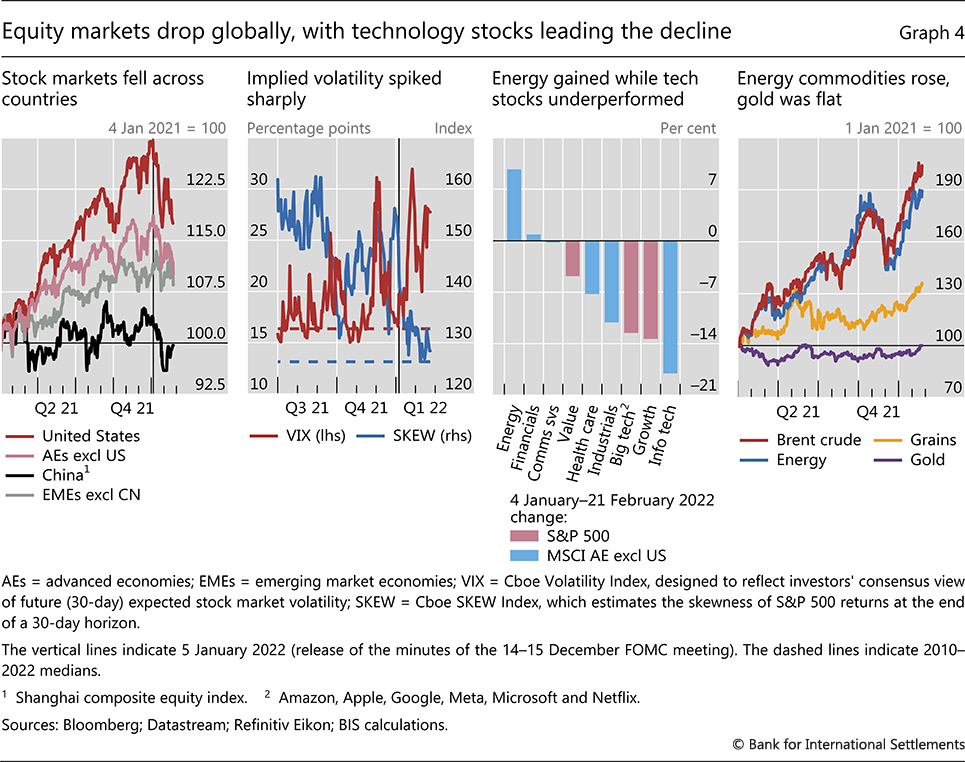
Investors also rotated into energy commodities, perhaps as a hedge against inflation. Prices of these commodities took off sharply in the second half of 2021. During the review period, the oil price reached its highest level since 2014, likely attributable to rising geopolitical tensions. Grains and other food commodities also increased but to a lesser extent than energy. In contrast, gold, which is often perceived as an inflation hedge, was surprisingly flat throughout 2021 and early 2022.
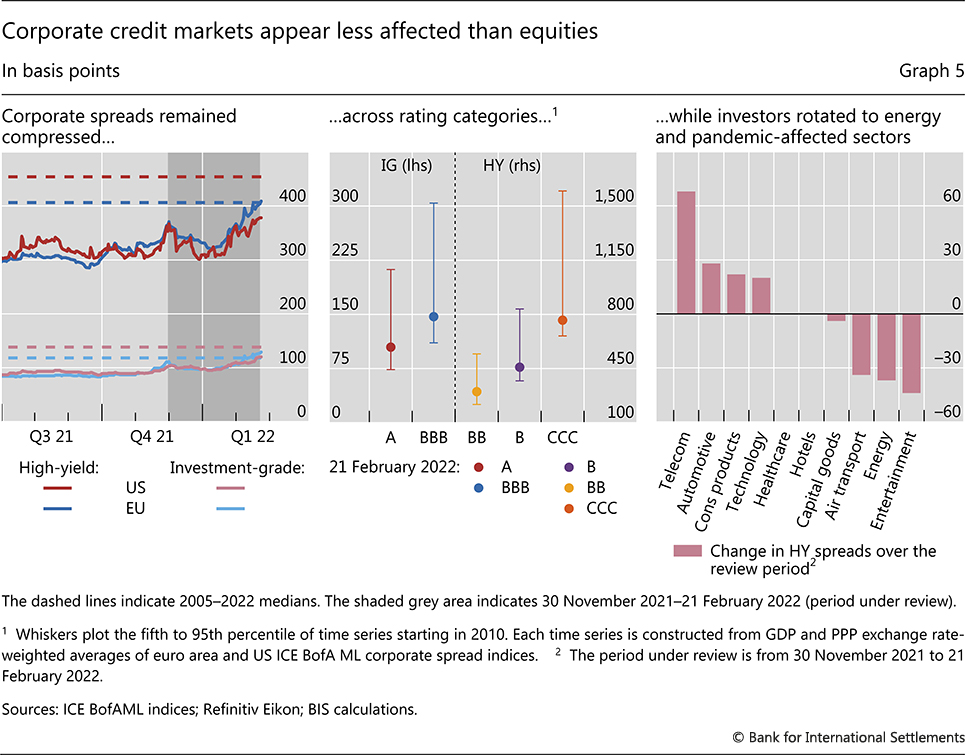
The corporate bond market was less affected than the stock market by the prospect of tighter monetary policy. Corporate spreads in the euro area and the United States fell early on but started rising in late January. They stayed low in historical terms for both investment-grade (IG) and high-yield (HY) securities in the United States but reached long-term medians in the euro area (Graph 5, left-hand panel). At the level of individual rating categories across regions, spreads hovered at the lower end of their post-GFC distribution (centre panel).
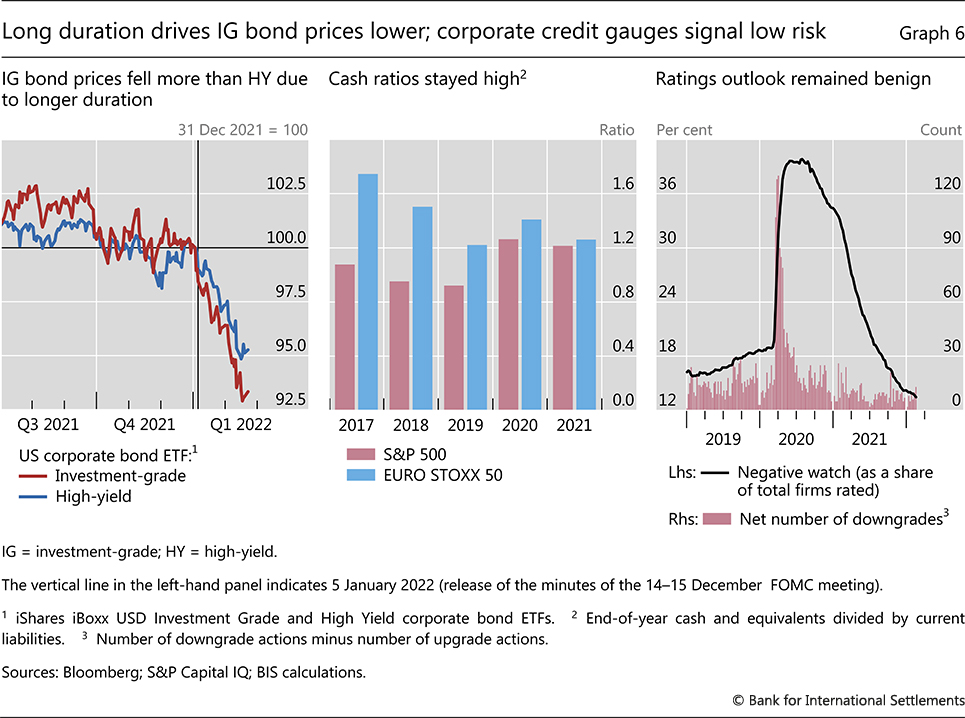
The rotation towards less interest rate-sensitive sectors was also evident among corporate bonds. Credit spreads narrowed the most for energy companies and sectors that had been threatened by the emergence of the Omicron variant and that subsequently benefited from its favourable evolution: entertainment and air transport (Graph 5, right-hand panel). By contrast, spreads widened for telecommunications and technology companies. Despite the overall small change in spreads, corporate bond prices declined, driven by rising government benchmarks. With their duration near all-time highs, IG bonds experienced price drops more pronounced than HY securities, which tend to have shorter maturities (Graph 6, left-hand panel).
Compressed credit spreads may reflect, in part, the perceived financial condition of corporates. The cash holdings of large firms in the United States and the euro area exceeded short-term debt (due within 12 months) by an average of 20%. In particular, the cash ratios of US firms were higher than before the pandemic (Graph 6, centre panel). Even though cash ratios need not be a good measure of credit risk,4 investors may see them as a positive signal about firms' overall financial conditions. Consistent with this, the share of firms on negative rating watch declined steadily throughout 2021 and even fell below pre-pandemic levels at the start of 2022 (right-hand panel). The number of net downgrades also declined, and defaults remained historically low.
Consistent with this, the share of firms on negative rating watch declined steadily throughout 2021 and even fell below pre-pandemic levels at the start of 2022 (right-hand panel). The number of net downgrades also declined, and defaults remained historically low.
Investor concerns surfaced in the credit default swap (CDS) markets, while those of policymakers were directed at leveraged loan markets. CDS spreads tightened slightly more than bond spreads from comparatively lower levels. In addition, trading volume in the CDS market increased, suggesting that investors' view on credit risk was in flux. As regards the leveraged loan market, prudential authorities expressed concerns about weak lending standards, not least for corporates that had tapped the market during Covid but could face repayment difficulties. Moreover, a large share of leveraged loans reside in collateralised loan obligations (CLOs), which are opaque collective investment vehicles.5
EMEs proved resilient amid mixed conditions
Financial conditions in EMEs were mixed. The dollar traded sideways or depreciated in relation to most EME currencies. Local currency sovereign financing costs varied by tenor and geography, while those in US dollars changed little. In China, the central bank eased policy in view of the difficulties faced by the economy.
EME currencies held steadfast versus the US dollar despite the monetary policy shift in the United States. The dollar zigzagged vis-à-vis EMEA and Asian currencies, but overall remained essentially unchanged by the end of the review period (Graph 7, first panel). The exceptions were the Turkish lira, which depreciated significantly in December (and featured prominently in cryptoasset trades, Box B), and the Russian rouble, which plummeted amid growing geopolitical tensions. The renminbi continued with the gradual appreciation seen in recent months. Remarkably, Latin American currencies, which had been depreciating throughout the second half of 2021, saw a sharp appreciation as the new year began, despite comparatively high inflation rates. Central banks in the region were among the most proactive globally in raising policy rates in the face of strong inflationary pressures. That in turn widened differentials vis-à-vis benchmark US interest rates, bolstering the attractiveness of local currencies vis-à-vis the dollar (Graph 3, centre panel). Accordingly, in the period under review, the currencies seemed partly supported by long positions in local currency assets taken by non-resident investors. For instance, such investors' holdings of Mexican and Brazilian government bonds increased for the first time since mid-2020.
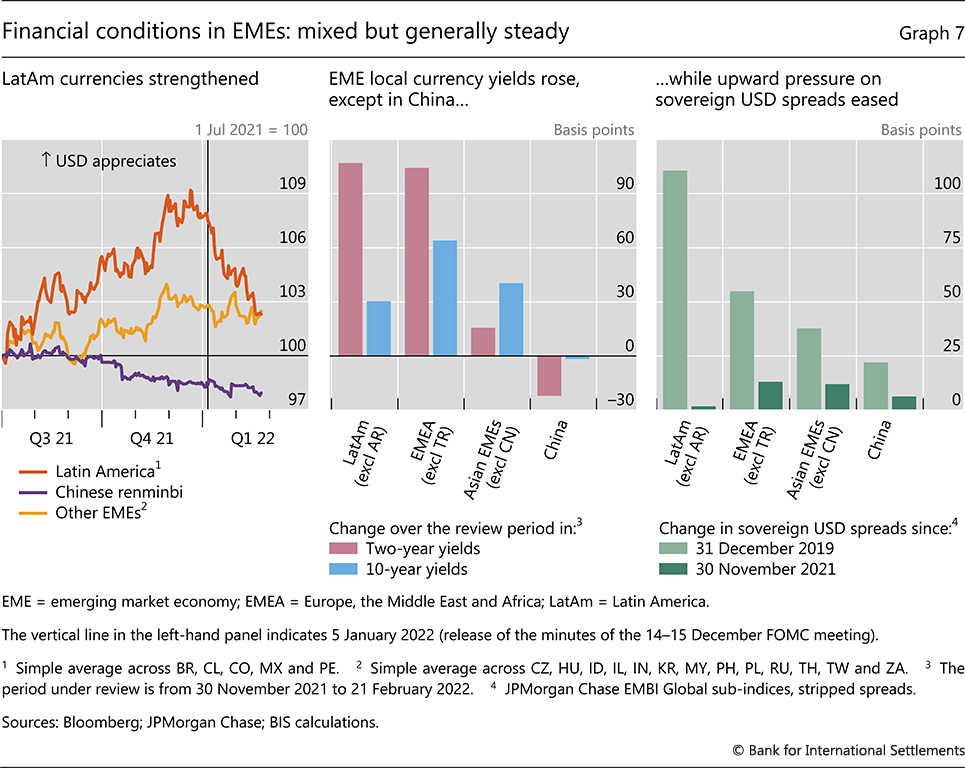
Sovereign funding conditions tightened to varied degrees in different regions. Starting in November, local currency short-term yields rose the most in Latin America and EMEA (Graph 7, centre panel, red bars), in part boosted by rate hikes. Long-term yields increased by less in these regions (blue bars). Against the backdrop of generally lower inflation rates and thus less pressure for monetary policy action, local yield rises in Asian economies were more subdued and tilted towards the long end. In parallel, spreads on dollar-denominated sovereign debt rose only slightly across regions (Graph 7, third panel, dark green bars). That said, they remained much higher than pre-pandemic, particularly in Latin America (light green bars).
In China, PBoC actions kept a lid on sovereign yields. As the domestic economy seemed to struggle with persistent headwinds from the real estate sector and a new wave of Covid-19, the central bank provided support by reducing reserve requirements and policy rates several times during the review period. As a result, renminbi sovereign yields fell in nominal terms.
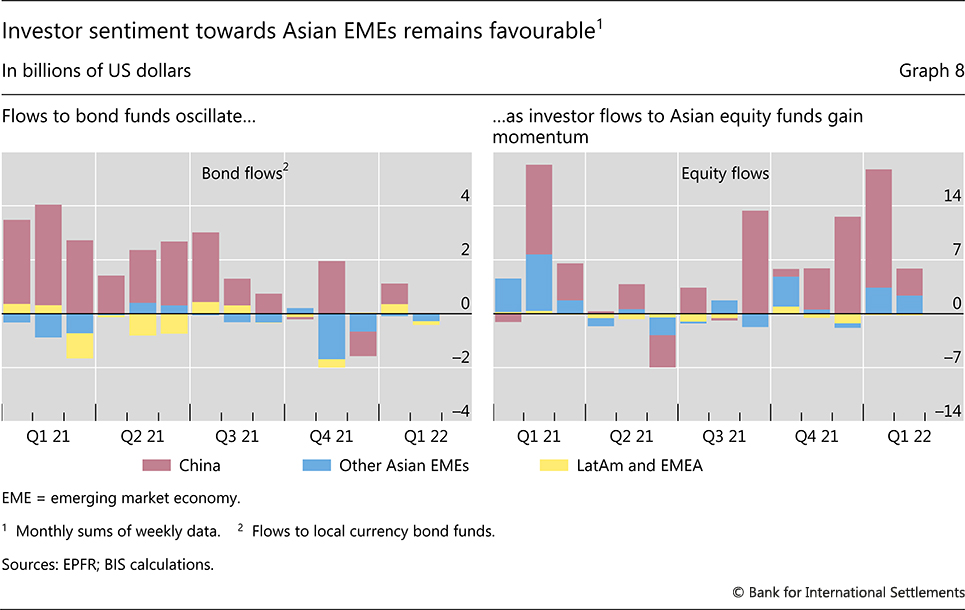
Investment flows to EME funds recovered somewhat, driven mainly by inflows to Asian stock funds. Flows to bond funds were mixed, with the significant outflows in December being followed by modest inflows in January (Graph 8, left-hand panel). Chinese bond funds received the largest share of inflows, possibly owing to the perspective of further drops in yields. Equity fund inflows gained further momentum in December and January, targeting China in particular, as well as Korea and Chinese Taipei (right-hand panel). These flows continue to indicate favourable investor sentiment towards Asian EMEs.
1 The period under review extends from 29 November 2021 to 21 February 2022.
2 EMEA stands for Europe, Middle East and Africa.
3 The ECB confirmed the shift from the PEPP (Pandemic Emergency Purchase Programme) towards a gradually shrinking APP (Asset Purchase Programme) starting in March 2022, and the end of the extra 50 basis points discount relative to the deposit facility rate for TLTROs (Targeted Longer-Term Refinancing Operations) in June 2022, as scheduled.
4 See R Banerjee and E Kharroubi, "The financial vulnerabilities driving firms to the exit", BIS Quarterly Review, December 2020.
5 See S Aramonte and F Avalos, "Structured finance then and now: a comparison of CDOs and CLOs", BIS Quarterly Review, September 2019.