Markets wrestle with reflation prospects
In the period under review,1 policy support and overall positive, if uneven, pandemic-related developments benefited risky-asset valuations but also drove long-term bond yields up. Against the background of loose financial conditions and continued monetary accommodation, some asset prices reacted strongly to the prospect of fiscal expansion. Equities extended gains and credit spreads tightened further, with cross-country and sectoral differences reflecting delays in some vaccination programmes. While short-term sovereign yields remained firmly anchored, rising market-based inflation expectations accompanied a steepening of the yield curve.
Stock prices continued their ascent in many jurisdictions, often exceeding pre-pandemic levels and, in some cases, setting all-time highs. Even as US corporate profitability improved, equity prices remained high relative to earnings on the back of low interest rates. In Europe, valuations in sectors more exposed to the pandemic lost some ground with vaccination delays.
Memories of the tech boom in the late 1990s resurfaced. Initial public offerings (IPOs) rose in number, and the rapid growth of conduits set up to scout for private firms and list them continued. In addition, retail investors took on record amounts of leverage, used options to speculate on individual stocks, and coordinated on social media platforms to put pressure on short-sellers. While cryptoasset funds are a new phenomenon, the flows they attracted reinforced the picture of strong risk appetite.
Credit markets remained buoyant after a remarkable recovery. Corporate bond spreads widened briefly in late January after months of steady decline, but remained well below long-run norms. Issuance was strong, particularly in the lower-rated segments. In the background, bankruptcies were stable at a low level in the United States and below five-year averages in Europe, thanks in part to lender leniency and policy measures to soften the pandemic's blow. Unfazed by the risk that these conditions might change, investors kept default risk premia compressed.
Importantly, the reflation trade gathered strength. Long-term government bond yields rose quickly, even as short-term rates were pinned at historically low levels. The increasing likelihood of a strong US fiscal impulse - funded with new issuance at long maturities - was a key driver of this steepening of the yield curve, in both Europe and the United States. Aided by the Federal Reserve's revised monetary policy framework, the prospect of fiscal expansion led investors to price in higher inflation, without the dollar strengthening much against other advanced economy (AE) currencies. The rise of nominal long-term sovereign yields reflected a combination of rising term premia, an upturn in inflation expectations and higher compensation for inflation risk.
Global financial conditions turned less favourable for emerging market economies (EMEs) in 2021. As the dollar bounced back from its post-election slide in January on the prospect of US fiscal support, the currencies of EMEs more strongly stricken by the pandemic depreciated more. Local currency bond yields reversed their downward trend. Even so, the overall sentiment towards EME assets remained positive. Sovereign spreads for US-denominated bonds continued to compress. Portfolio flows gained momentum, consistent with investors searching for yield in Chinese bond markets and looking for growth in East Asia.
Key takeaways
- Equities and credit gained on the back of a brighter outlook and expectations of greater fiscal support, with signs of exuberance reflected in the behaviour of retail investors.
- Sovereign yield curves steepened as fiscal expansion lifted term premia and inflation compensation.
- Sentiment towards EME assets remained favourable, and investors' appetite for East Asian assets rose.
Risky assets extend gains, but tail risks remain
With monetary policy remaining very easy, global equity markets rose in response to indications of stronger fiscal policy support, notably in the United States, and a brightening earnings outlook. The increase in stock prices was broad-based, but particularly strong in EMEs other than China and in selected AEs such as Japan (Graph 1, first panel). Over time, equity indices waxed and waned in line with the prospect of a major US fiscal package (vertical lines). Later in the review period, the run-up in US stock prices paused just as the reflation trade gained momentum (see below). In the background, earnings forecasts continued to improve in the United States but stayed rather flat in Europe (second panel). Actual earnings also largely surprised on the upside, with about three quarters of US companies exceeding analysts' estimates for Q4 2020.
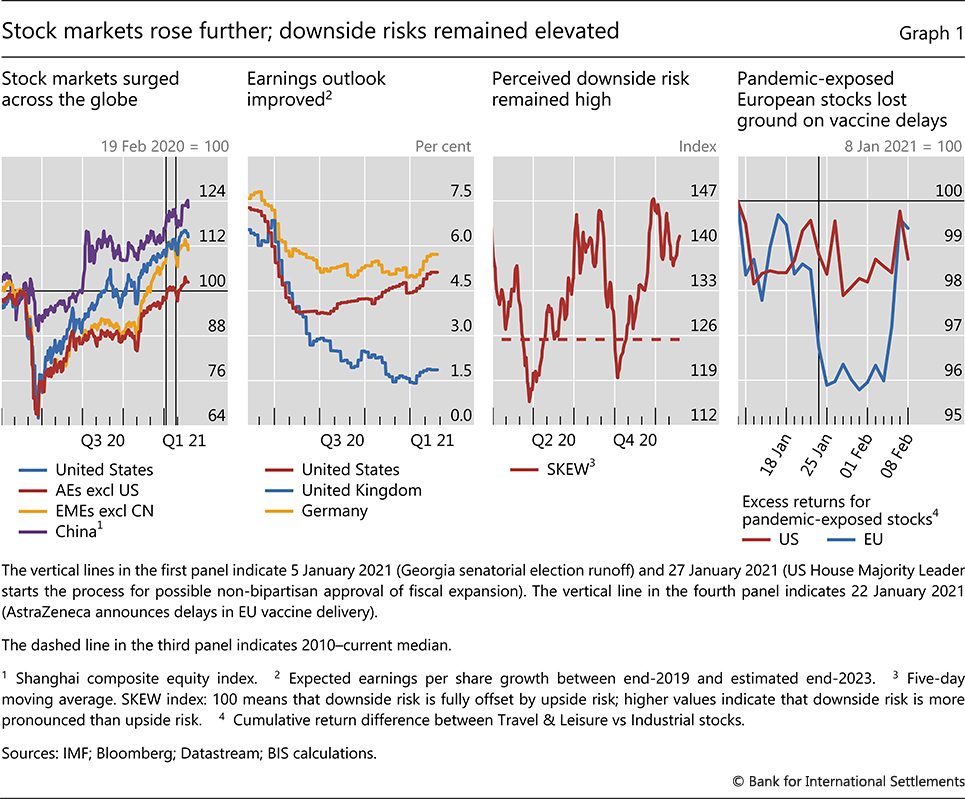
That said, investors did not seem to neglect tail risks altogether. Their concerns were visible in the historically high levels of the SKEW index, which measures the price of insurance against large negative stock returns (Graph 1, third panel). Delays in vaccine rollouts were possible manifestations of such risk. Indeed, the prices of European stocks most exposed to the pandemic lost ground suddenly, if only temporarily, when delays in the EU vaccination programme emerged in mid-January (fourth panel).
Low long-term interest rates have been critical in supporting valuations. Since recent US price/earnings ratios were among the highest on record, they suggest stretched valuations if considered in isolation. However, assessments that also take into account the prevailing low level of interest rates indicate that valuations were in line with their historical average. Box A investigates the drivers of stock returns, suggesting that equity prices are particularly sensitive to monetary policy in environments akin to the current one, featuring high price/earnings ratios and low interest rates.
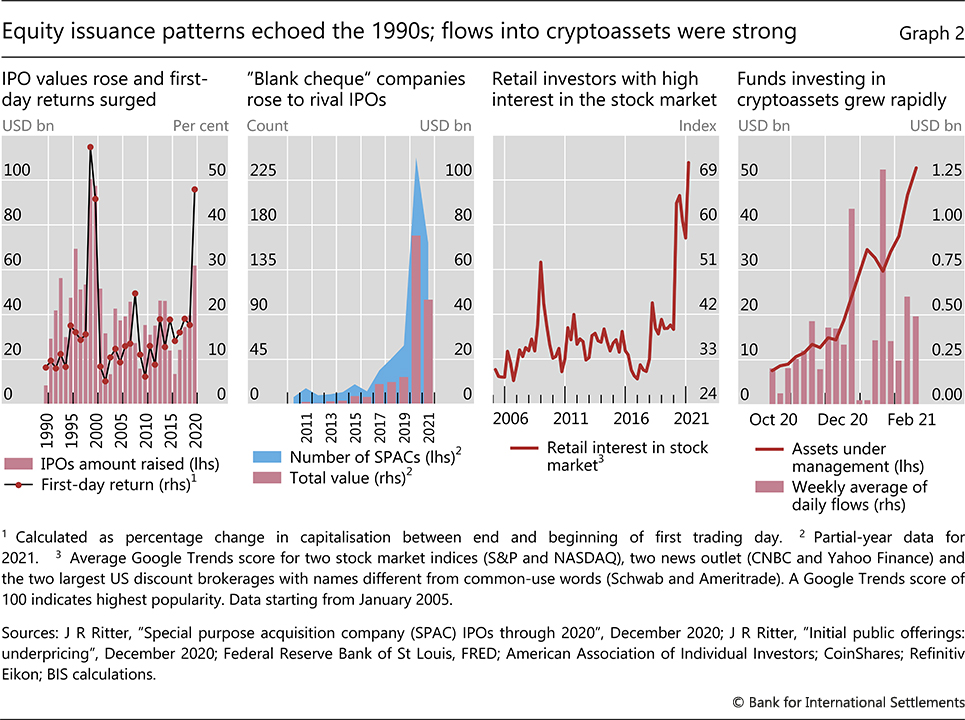
Even if equity valuations did not appear excessive in the light of low rates, some signs of exuberance had a familiar ring. Just as during the dotcom boom in the late 1990s, IPOs saw a major expansion and stock prices often soared on the first day of trading (Graph 2, first panel). The share of unprofitable firms among those tapping equity markets also kept growing. In addition, strong investor appetite supported the rise of special purpose acquisition companies (SPACs) – otherwise known as "blank cheque" companies (second panel). These are conduits that raise funds without an immediate investment plan.
Box A
The news sensitivity of high equity prices when long-term rates are low
While low interest rates may help explain high equity prices, they also change the relative importance of alternative drivers of stock returns. In this box, we first document that the current low rates, rather than corporate earnings, assuage concerns about froth in the equity markets. We then argue that, in such an environment, equity valuations are particularly sensitive to monetary policy news, much more so than to macroeconomic news. Besides increasing the present value of future cash flows, accommodative monetary policy can help to boost economic activity and can also, to some extent, limit downside risks. Overall, the findings underscore the pivotal role that central banks are playing in influencing stock prices at the current juncture.
Equity valuations reflect both corporate profitability and the level of interest rates. In an asset-pricing model, the price of a stock is the discounted present value of future profits, with the discounting factor dependent on the profile of interest rates at short and long horizons. Measures that abstract from interest rates and compare equity prices only with corporate profitability conclude that stocks are at present trading at a substantial premium. One of the most common such measures, the cyclically adjusted price/earnings ratio (CAPE) of the S&P 500, is at its highest apart from a brief period in the late 1990s. Once interest rates are taken into account, however, stocks appear more reasonably priced. The excess CAPE yield, which takes the inverse of the S&P 500 CAPE ratio and subtracts real (inflation-adjusted) interest rates, is currently not far from its long-term average (Graph A, left-hand panel).
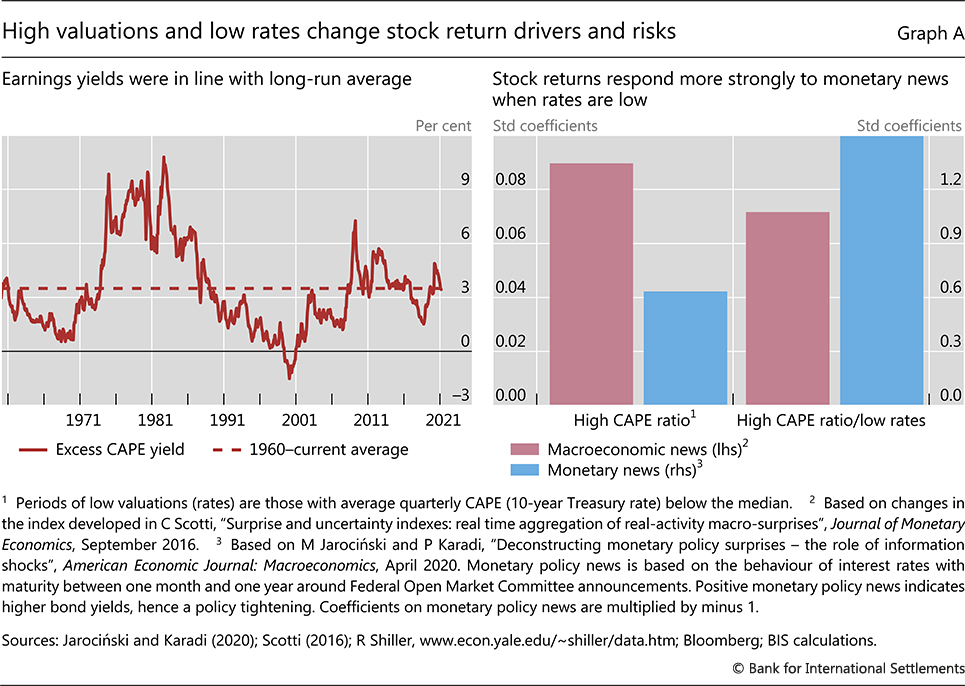
An environment of low interest rates is conducive to particularly high sensitivity of stock returns to monetary policy news. When interest rates are below their median, monetary policy news, measured with changes in short-term interest rates around Federal Open Market Committee announcements, has a stronger effect on S&P 500 returns than when interest rates are above their median. In contrast, the corresponding impact of macroeconomic news, proxied by deviations of scheduled macroeconomic releases from consensus forecasts, is actually lower at low interest rates.
In principle, there could be a mechanical effect at play. Monetary policy news that induces changes to interest rates at low levels has a substantially larger impact on the discount factor, which translates into a similarly large impact on stock returns. For the results we report in Graph A (right-hand panel), we seek to strip out these effects. Likewise, all else the same, macroeconomic news could have mechanically a stronger impact on returns when the discount factor is lower. Our findings indicate that this effect does not drive outcomes. Namely, the reported sensitivities to macroeconomic news (red bars) are actually lower at low interest rates.
Through what channels - other than that of the discount factor - do low interest rates strengthen the responsiveness of stock returns to monetary policy news? Such interest rates reduce corporates' debt servicing costs and encourage economic activity, thus leading to higher expected profits and ultimately higher equity valuations. Moreover, if low interest rates are the symptom of accommodative monetary policy that seeks to reduce the likelihood of steep losses on the equity market, then they would go hand in hand with low risk premia and, thus, high valuations. Overall, to the extent that corporate profitability and investors' attitude to risk are predicated on monetary policy, stock valuations would respond strongly to news about this policy.
The views expressed are those of the authors and do not necessarily reflect the views of the Bank for International Settlements. We observe similar patterns in the corporate bond market. The effect of monetary policy on exchange rates is also higher when interest rates are low. See M Ferrari, J Kearns and A Schrimpf, "Monetary policy's rising FX impact in the era of ultra-low rates", BIS Working Papers, no 626, April 2017. Concretely, in our empirical analysis, we estimate separately the effect of news on stock returns that depends on the interest rate level and the effect that does not. In Graph A (right-hand panel), we report only the latter effect.
The increasing footprint of retail investors and the appeal of alternative asset classes also pointed to brisk risk-taking. An index gauging interest in the stock market on the basis of internet searches surged, eclipsing its previous highest level in 2009 (Graph 2, third panel). This rise went hand in hand with the growing market influence of retail investors (Box B). In a sign of strong risk appetite, funds investing in the main cryptoassets grew rapidly in size following sustained inflows (fourth panel), and the prices of these assets reached all-time peaks.

Box B
The rising influence of retail investors
Recent events have drawn attention to the growing role of retail investors in equity markets. In addition to fuelling a rise in trading volumes, these investors use leverage, buy and sell options to speculate on individual companies, and rely on social media platforms to coordinate their portfolio strategies. This box documents the footprint of retail traders and discusses its impact on market functioning.
Telltale signs of retail investors' growing activity emerged from patterns in equity trading volumes and stock price movements. For one, small traders seem to be often attracted by the speculative nature of single stocks, rather than by the diversification benefits of indices. Consistent with such preferences gaining in importance, share turnover for exchange-traded funds (ETFs) tracking the S&P 500 has flattened over the past four years, while that for the S&P 500's individual constituents has been on an upward trend over the same period, pointing to 2017 as the possible start year of retail investors' rising influence (Graph B, left-hand panel). In addition, retail investors are more likely to trade assets on the basis of non-fundamental information. During the late 1990s tech boom, for instance, they sometimes responded to important news about certain companies by rushing to buy the equity of similarly named but distinct firms. Comparable patterns emerged in early 2021 – for instance, when the value of a company briefly quintupled as investors misinterpreted a social media message as endorsing its stock.
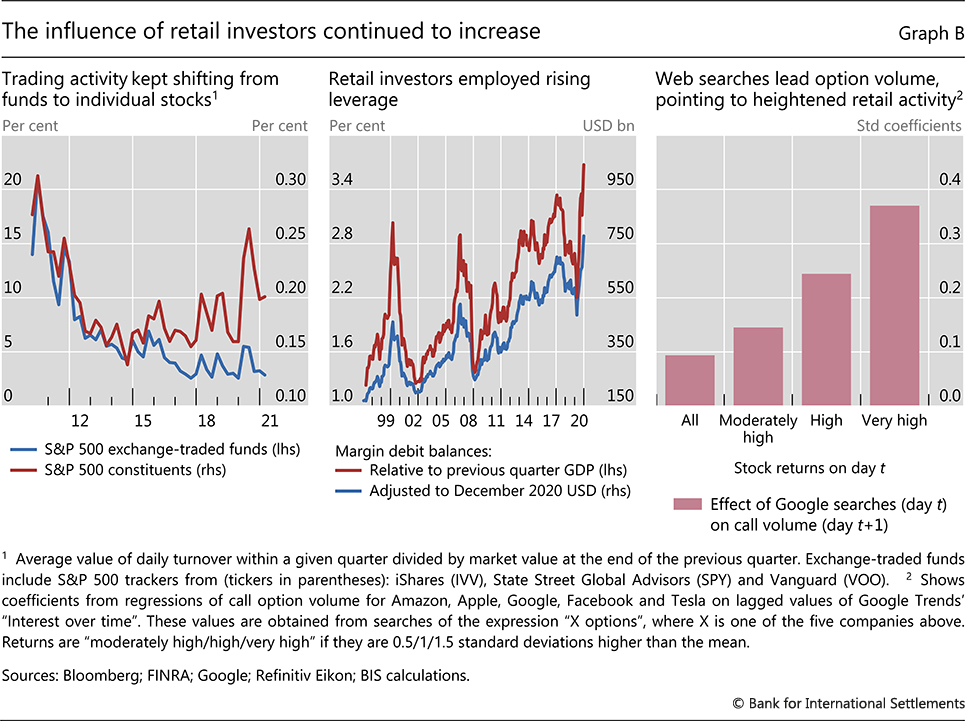
In the United States, retail investors' sustained risk-taking has been channelled through brokerage accounts, the main tool they have to manage their non-retirement funds. Brokerage accounts allow owners to take leverage in the form of margin debt. In December 2020, the amount of that debt stood at $750 billion, the highest level on record since 1997, both in inflation-adjusted terms and as a share of GDP. Its fast growth in the aftermath of March 2020 exceeded 60% (Graph B, centre panel). There is evidence that retail investors are currently taking risky one-way bets, as rapid surges in margin debt have been followed by periods of stock market declines.
In seeking exposure to individual companies, retail investors trade options. Call (put) options pay off only when the price of the underlying stock rises (falls) past a preset value, with gains potentially amounting to multiples of the initial investment. In this sense, options have embedded leverage that margin debt magnifies further. Academic research has found that option trading tends to be unprofitable in the aggregate and over longer periods for small traders, not least because of their poor market timing.
Reports in early 2021 have suggested that the surge in trading volumes for call options – on both small and large stocks – has indeed stemmed from retail activity. For example, internet searches for options on five technology stocks – a clear sign of retail investors' interest – predicted next-day option volumes. This link was particularly strong for searches that took place on days with high stock returns, suggesting that option activity was underpinned by bets on a continuation of positive returns (Graph B, right-hand panel).
Equity prices rose and fell as retail investors coordinated their trading on specific stocks through social media in January 2021. While online chat rooms were already a popular means of information exchange in the late 1990s, the trebling of the number of US internet users and the rise in no-fee brokerages since then has widened the pool of traders who can combine their efforts. In a recent episode, retail investors forced short-sellers to unwind their positions in distressed companies. A similar move in the more liquid silver market floundered a few days later. These dislocations were short-lived, not least because, in response to collateral requests from clearing houses, some brokerages limited their customers' ability to trade. Even so, it has become clear that deliberate large-scale coordination among small traders is possible and can have substantial effects on prices.
Certain actions of retail investors can raise concerns about market functioning. Sudden bursts of trading activity can push prices far away from fundamental values, especially for less liquid securities, thus impairing their information content. In a move that underscored the materiality of this issue, the US Securities and Exchange Commission suspended trading in the shares of companies that had experienced large price movements on the back of social media discussions.
Even without deliberate coordination, retail investors' inclination to use options for speculative trading can amplify market volatility. The reason is that option sellers hedge their exposure by trading in the underlying stocks, typically buying when the prices of these stocks rise and selling when they fall. This hedging strategy adds to price swings.
The views expressed are those of the authors and do not necessarily reflect the views of the Bank for International Settlements. See R Bauer, M Cosemans and P Eichholtz, "Option trading and individual investor performance", Journal of Banking and Finance, April 2009.
Signs of strong risk appetite were also visible in credit markets. Corporate bond spreads continued to decline steadily through early January, across rating grades and geographies, and remained firmly below historical averages (Graph 3, left-hand panel). Especially in the high-yield (HY) segment, the high issuance volume that characterised the first quarter of 2021 was more than twice the first quarter average from 2010 to 2019 (centre panel).
In the leveraged finance market, prices kept rising. The increase benefited all types of securities, including leveraged loans, collateralised loan obligations (CLOs) and private credit, which refers to loans made to smaller companies by alternative asset managers with little bank participation (Graph 3, right-hand panel). Similarly to equities, private credit proved particularly sensitive to rising expectations of US fiscal expansion in early January. Survey data from 2020 indicate that private credit volumes were likely to stay close to those observed in the previous record year.
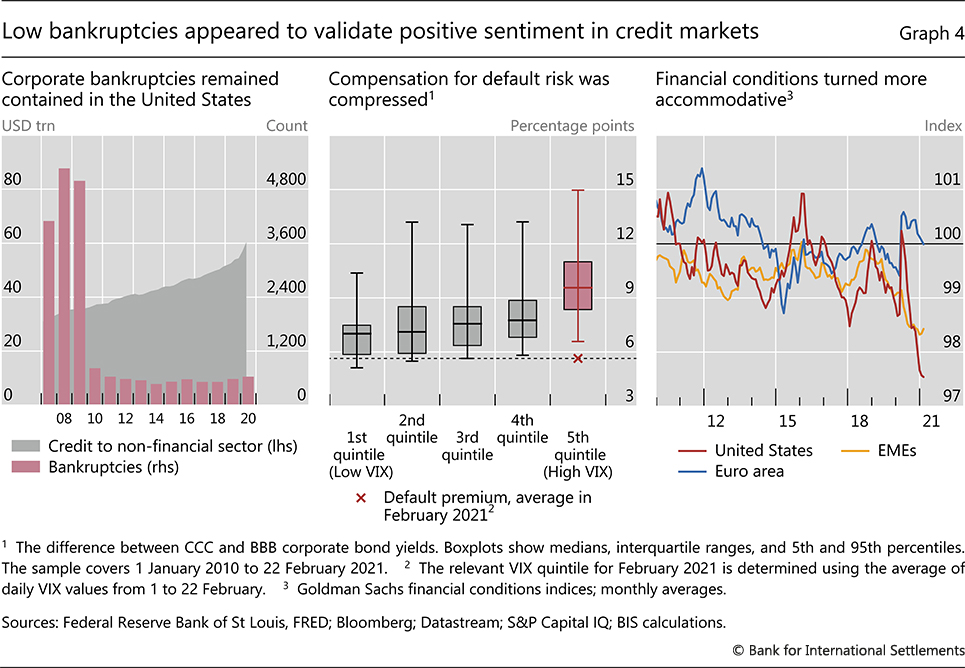
Pricing in credit markets reflected upbeat sentiment on the back of low levels of realised risk. The number of corporate bankruptcies barely inched up in the United States (Graph 4, left-hand panel) and actually fell below 2015–19 averages in France and Germany, thanks to forceful public support programmes, looser filing requirements and lender leniency. Compressed spreads mirrored, in part, these developments. Bonds issued by distressed companies offered only a modest spread over yields of the lowest-rated investment grade firms. This spread, which is a proxy for default premia, was remarkably tight in the light both of banks' loan loss provisions in the course of 2020 (Box C) and of perceived market risk (Graph 4, centre panel).
Generally loose financial conditions underscored the buoyant mood in financial markets. In the specific index shown in Graph 4, the tightening effect of rising long-term sovereign yields (see below) was typically offset by increasing stock prices and declining corporate funding costs. In EMEs and the United States, financial conditions were more accommodative at the beginning of 2021 than at any point over the previous 10 years (Graph 4, right-hand panel). While they had not fully retraced the tightening that occurred in March, financial conditions in the euro area stood at relatively neutral levels.
Fixed income markets and the "reflation trade"
Government bond markets in AEs reflected the improved macroeconomic outlook around the turn of the year. With the continuous backdrop of vigorous monetary policy support and brighter pandemic prognoses, the stiffening prospect of a US fiscal spur unleashed a so-called "reflation trade": yield curves steepened and inflation break-evens rose.2 Moreover, the US dollar bounced back from its post-election slide.
Box C
Bank loan loss provisioning during the Covid crisis
The Covid-19 crisis prompted a re-evaluation of banks' asset quality under conditions of extreme uncertainty. The crisis also represents the first major test of the newly introduced accounting standards for expected credit loss (ECL) provisioning. How have banks and supervisors approached these challenges?
ECL provisioning standards mandate that banks and other firms take provisions against expected credit losses on assets that are not accounted for at fair value. The expectations are based on a number of inputs, including model-based forecasts, historical experience and current conditions as well as bank management's judgment. As part of the standards and related regulatory guidance, global banks have also enhanced their qualitative and quantitative disclosures. The ECL standards replace the earlier incurred loss (IL) approach, under which banks only set aside provisions upon actual evidence that the borrower will not (or is strongly unlikely to) repay. Developed in the aftermath of the Great Financial Crisis of 2007–09, these standards are part of the IFRS 9 "Financial Instruments" standard under International Financial Reporting Standards (IFRS), and are known as Current Expected Credit Loss (CECL) under the United States Generally Accepted Accounting Principles (US GAAP). IFRS 9 was mandated for IFRS reporters from the first quarter of 2018, and CECL from the first quarter of 2020 for the largest banks subject to US GAAP.
In response to the uncertainties introduced by the Covid crisis, authorities granted banks greater leeway as to how to implement ECL provisioning. International standard setters have reiterated the inherent flexibility in the standards, emphasising the key role of judgment, and have stressed that banks should take account of the positive effects from policies to support the economy during the pandemic. National supervisors have conveyed similar messages. Standard setters have also acted to alleviate the impact of the transition from IL to ECL on capital.
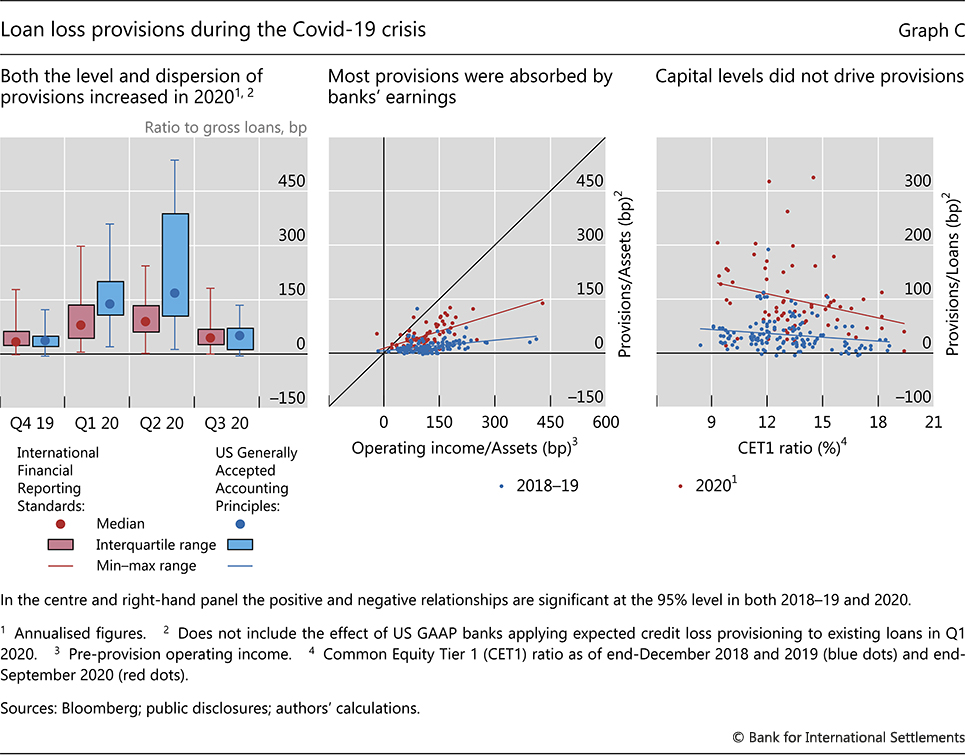
The initial Covid-19 shock triggered significant upward revisions to banks' forward-looking assessment of credit losses. For a sample of 70 large, internationally active banks reporting under ECL accounting, provisions totalled $161 billion in the first half of 2020, compared with $50 billion in the second half of 2019. Relative to loans, the median of annualised provisions rose from 35 basis points in the second half of 2019 to 105 basis point in the first half of 2020. Along with this higher level, the Covid crisis brought more dispersion across banks in provisions as a share of loans. Provisions were somewhat higher as a share of loans for US GAAP banks than for IFRS reporters (Graph C, left-hand panel), perhaps reflecting the use of lifetime credit risk in determining provisions under the US GAAP framework rather than one-year risk for most loans in the IFRS approach.
Provisions in 2020 were significantly higher for banks with higher pre-provision earnings but were not strongly related to bank capital (Graph C, centre and right-hand panels, red dots). The positive relationship between announced provisions and earnings had been weaker in 2018–19 (blue dots). This relationship strengthened in 2020 when, faced with a substantial increase in credit risk, banks may have felt more comfortable taking larger provisions if this still left them with positive net earnings. Another possible reason is that higher interest margins could have been earned on riskier loans that subsequently required higher provisions in bad times. Contrary to the relationship between provisions and earnings, banks with higher capital ratios did not take more provisions in 2020; if anything, the relationship was slightly negative (right-hand panel). This suggests that, to the extent that strategic concerns affected provisioning in 2020, they did not relate to capital preservation, possibly reflecting the banks' initially strong capital positon. It could also be that those banks that took higher provisions in 2020 had entered the crisis with relatively riskier loan portfolios, and hence higher risk weights and lower risk-weighted capital ratios.
As the economic outlook improved in the second half of 2020, banks reduced their quarterly provisions, and some even took negative provisions. In the third quarter, the total provisions of the banks in our sample declined to $29.5 billion, approaching pre-Covid levels. Dispersion across banks also fell. At the end of the year, the 57 banks that had published fourth quarter financial data at the time of writing took an aggregate of $20 billion in provisions, with the median provisions-to-loans ratio across institutions amounting to 29.7 basis points. Six of these banks announced negative provisions, ie a reduction in loan loss reserves. These reductions remained substantially smaller than the amount of loan loss reserves added during the previous three quarters.
The initial Covid-19 shock triggered significant upward revisions to banks' forward-looking assessment of credit losses. For a sample of 70 large, internationally active banks reporting under ECL accounting, provisions totalled $161 billion in the first half of 2020, compared with $50 billion in the second half of 2019. Relative to loans, the median of annualised provisions rose from 35 basis points in the second half of 2019 to 105 basis point in the first half of 2020. Along with this higher level, the Covid crisis brought more dispersion across banks in provisions as a share of loans. Provisions were somewhat higher as a share of loans for US GAAP banks than for IFRS reporters (Graph C, left-hand panel), perhaps reflecting the use of lifetime credit risk in determining provisions under the US GAAP framework rather than one-year risk for most loans in the IFRS approach.
The views expressed are those of the authors and do not necessarily reflect the views of the Bank for International Settlements. See Basel Committee on Banking Supervision, Measures to reflect the impact of Covid-19, April 2020; and International Accounting Standards Board, "IFRS 9 and Covid-19", 27 March 2020. The transition arrangements had been set out in Basel Committee on Banking Supervision, Regulatory treatment of accounting provisions – interim approach and transitional arrangements, March 2017. In 2020, the Basel Committee allowed banks more flexibility in phasing in the capital impact of the new frameworks. A portion ($18.5 billion) of the 2020 increase in provisions by the 19 US GAAP banks in this group included the one-time impact of the application of the ECL approach to existing loans on 1 January 2020. All findings in the box exclude this increase. For differences between the IFRS 9 and CECL frameworks, see B Cohen and G Edwards, "The new era of expected credit loss provisioning", BIS Quarterly Review, March 2017, pp 39–56.
Central banks across the globe continued to maintain a very accommodative stance. Policy rates stayed unchanged across most AEs and EMEs, and some central banks increased the size or pace of their asset purchase programmes. In the core jurisdictions, policymakers maintained forward guidance of continued strong accommodation, despite inflation figures that surprised on the upside in December and January. Their stance reflected concerns that economic activity had not fully recovered, that economic scars could linger, that new lockdowns heralded further weakness, and that the factors behind higher inflation figures were temporary. In contrast, some EME central banks broadcast a more cautious message as inflationary pressures continued to build up during the second half of 2020.
Long-term yields surged in core markets during January and February, and yield curves steepened as short-term rates remained pinned at historically low levels. The rotation was most pronounced in the United States, where 10-year yields resumed the trend initiated in August when the Treasury announced large increases in the issuance of long-term bonds (Graph 5, left-hand panel). In parallel, short rates plunged in February as the Treasury unveiled its plan to drastically curtail its cash holdings, which may result in a large reduction in the amount of bills outstanding. The resulting steepening of the yield curve was roughly mirrored in other major economies (centre panel).
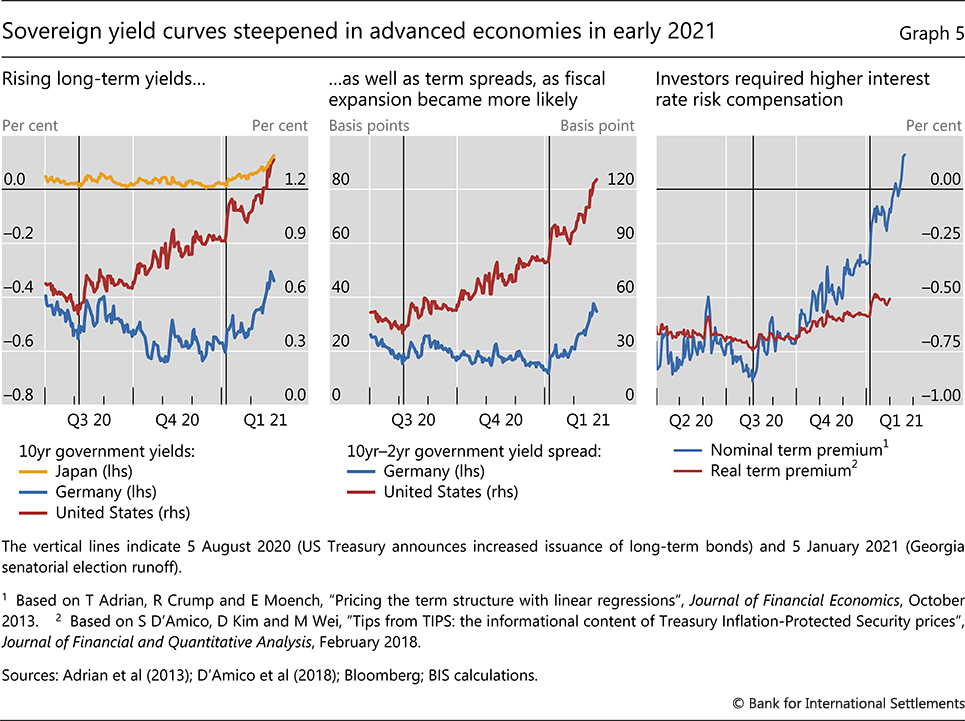
The steepening of yield curves in core markets mirrored the increase in market measures of interest rate risk and inflation compensation.3 Continuing their trend after a turning point in early August, term premia climbed gradually throughout the review period (Graph 5, right-hand panel). In turn, US inflation compensation, as reflected in 10-year break-even rates, picked up pace in late November, and rose by about 40 basis points by late February. This stemmed, in part, from a substantial upward revision of investors' inflation expectations, which are almost back to pre-pandemic levels. Moreover, the inflation risk premium has been high, which appears closely connected to conditions in the US Treasury market (Box D). In Germany, inflation break-evens also rose, yet their levels were still far below those in the United States.
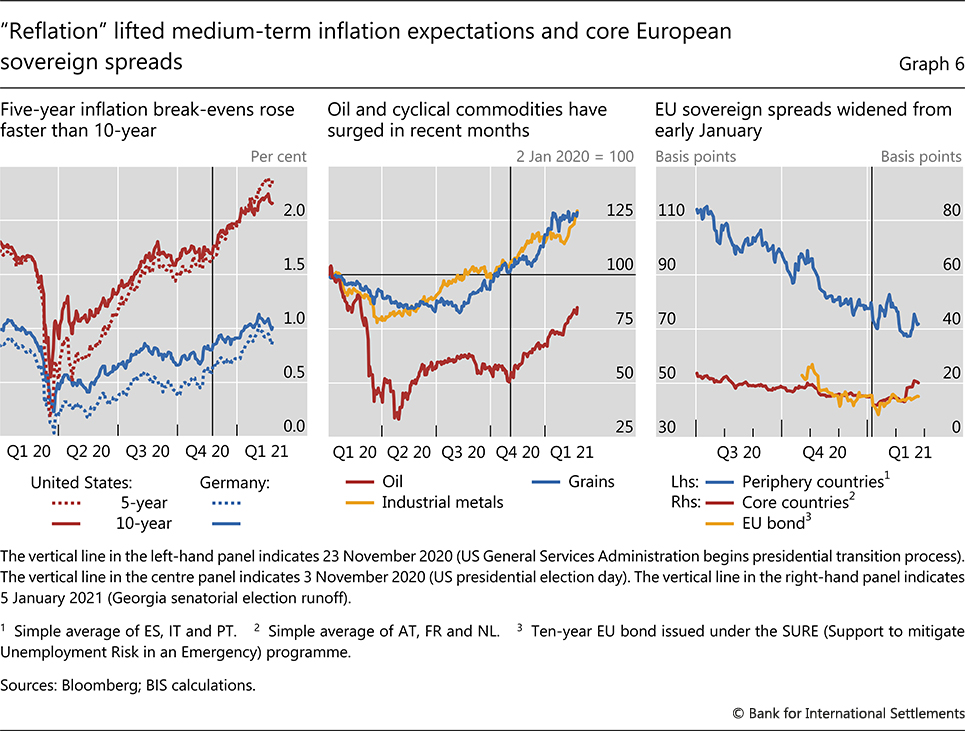
A close examination of the inflation break-even rates reveals that investors were expecting inflation to flare up in the medium term and to ease subsequently. This is the message of five-year US break-evens surpassing and rising above the corresponding 10-year benchmarks since early January (Graph 6, left-hand panel). In a qualitatively similar development, the spread between the corresponding German break-evens dropped by about 10 basis points during the review period.
Box D
What drove the recent increase in the US inflation break-even rate?
Inflation break-even rates indicate how investors' perceptions of future inflation translate into pricing decisions. For the United States, this rate can be measured as the spread between the yields on nominal US government bonds (Treasuries) and on Treasury Inflation-Protected Securities (TIPS). In this box, we use a model of the term structure of interest rates to decompose the US break-even rate into its two elements: inflation expectations and what is known as "inflation risk premium". In so doing, we find that inflation expectations have increased substantially since mid-2020, and that the measured inflation risk premium has also contributed materially. The latter seems to reflect, in part, the funding policy of the US Treasury and its interaction with asset purchases by the Federal Reserve.
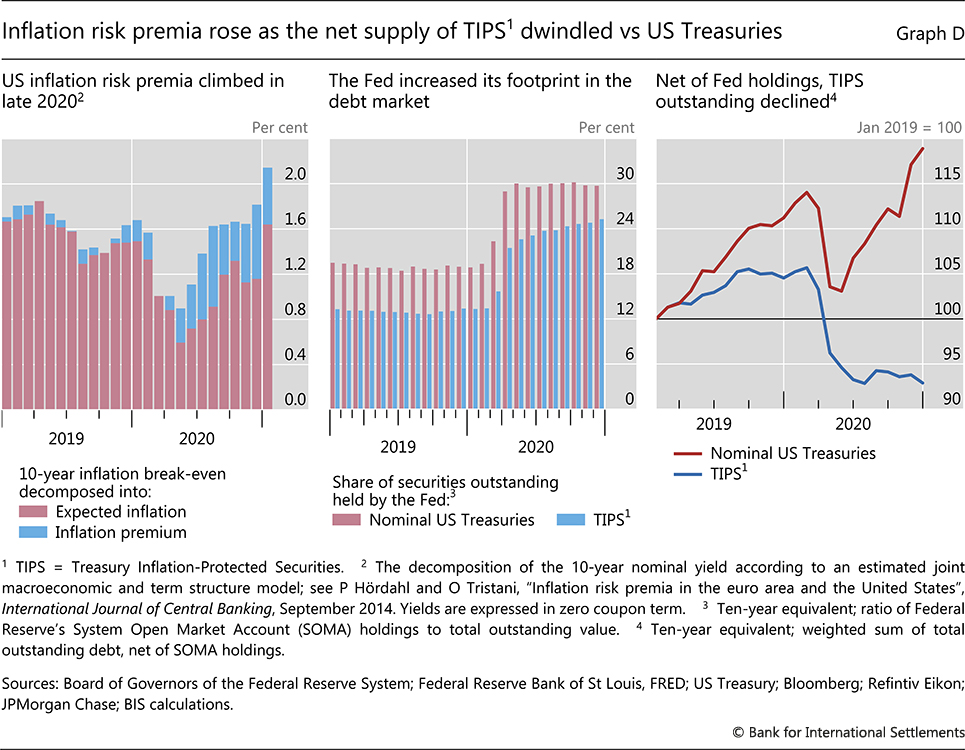
Since the end of March 2020, the break-even rate has increased by almost 130 basis points, to 2.16% in late February 2021, surpassing its pre-pandemic watermark. Much of this reflects the rise in inflation expectations between May and October 2020. Expected inflation then levelled off in November and December before a step increase in January, as the prospect of a large fiscal impulse consolidated (Graph D, left-hand panel, red bars). In parallel, the inflation risk premium increased by about 50 basis points (blue bars), helping to take the break-even rate to the highest level seen since early 2019.
The overall increase in the break-even rate is likely to have reflected a variety of indications that US inflation could be higher in the near term. On the back of the Federal Reserve's new monetary policy framework, progress in the distribution of vaccines, higher commodity prices and a potentially substantial fiscal impulse were likely drivers of higher inflation expectations. But what could have contributed to the high inflation risk premium?
In a simple textbook setting, the inflation risk premium would only reflect the compensation that investors demand for holding nominal Treasuries, over and above the compensation for expected inflation. In this case, the only drivers of the risk premium would be investors' perceptions of risk and their risk appetite. In practice, however, the measured inflation risk premium can also reflect a variety of additional drivers. In the US case, these include imbalances between the demand for and supply of Treasuries and TIPS, or the relative liquidity of the underlying markets.
The net supply of Treasuries and TIPS to private investors stems from the interaction of US Treasury issuance patterns and Federal Reserve purchases. As the US central bank swiftly expanded its holdings of TIPS and Treasuries in response to the Covid-19 emergency, the corresponding bond amounts available to investors dropped substantially in the first quarter of 2020 (Graph D, centre panel). From mid-2020, however, issuance of Treasuries picked up, with auction sizes increasing by between 20% and more than 50% by the end of 2020, depending on the tenor. At the same time, the auction sizes of TIPS remained stable. Since the Federal Reserve maintained a relatively large and steady pace of purchases that somewhat exceeded TIPS issuance but not the expanded issuance of Treasuries, the amount of Treasuries available to investors recovered quickly (Graph D, right-hand panel, red line), while the corresponding TIPS volume stagnated (blue line).
This combination of higher supply of Treasuries and lower supply of TIPS is likely to have contributed to the higher measured inflation risk premium. To the extent that the appetite for inflation hedging remained constant or rose, which appears likely given the macroeconomic and policy backdrop, investors would bid down the yield on the limited amount of TIPS available. The relatively low liquidity of the TIPS market would amplify this effect. At the same time, investors would ask for an increasingly higher compensation to hold the quickly expanding amount of Treasuries. All these mechanisms would contribute to the rise of the break-even rate for given inflation expectations, thus boosting the measured inflation risk premium.
The views expressed are those of the authors and do not necessarily reflect the views of the Bank for International Settlements. For the estimates of expected inflation and the inflation risk premium, we use the model from P Hördahl and O Tristani, "Inflation risk premia in the euro area and the United States", International Journal of Central Banking, September 2014. We confirm that our findings are qualitatively similar to those of S D'Amico, D Kim and M Wei, "Tips from TIPS: the informational content of Treasury Inflation-Protected Security prices", Journal of Financial and Quantitative Analysis, February 2018. Indeed, earlier studies have found that these frequently used empirical models tend to deliver estimates with similar time profiles. See B Cohen, P Hördahl and D Xia, "Term premia: models and some stylised facts", BIS Quarterly Review, September 2018, pp 79–91.
A number of factors seem to have been at work. Probably the most important one was central banks vowing to be patient and allow full economic recovery before tightening policy – and to do so even if that meant moderate overshoots of their targets in the short and medium term, as clearly stated in the new Federal Reserve framework. This makes it more likely that the more expansionary fiscal policy and the recent rally in oil and other highly cyclical commodity prices will have an inflationary impact. By the end of the review period, the prices of grains and industrial metals had surpassed their pre-pandemic levels by about 25% (Graph 6, centre panel, blue and yellow lines). And while oil prices have not staged a similar recovery, they increased by roughly 35% during the review period (red line).
In line with the prevailing high risk appetite, European sovereign spreads relative to German bunds narrowed up to the end of the year. This reflected, in part, a relatively smooth completion of Brexit. In January, European sovereign spreads fluctuated in response to setbacks in vaccine procurement and swinging perceptions of political risk in Italy (Graph 6, right-hand panel).
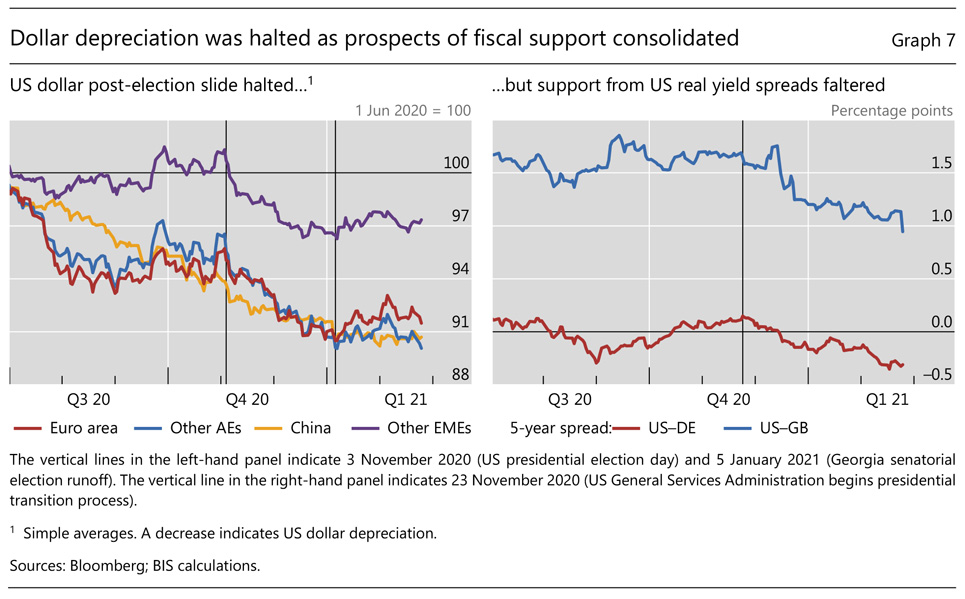
The US dollar picked up somewhat during the review period, following a post-election slide. The currency tentatively strengthened from early January, as the US outlook improved relative to the rest of the world (Graph 7, left-hand panel). Fiscal support and a relatively successful rollout of the vaccination campaign in the United States contrasted with a global picture beset by evidence of procurement setbacks, new virus strains and relatively limited fiscal space.
The greenback still faced significant headwinds. It is possible that the expansionary tilt of the new Fed strategy has muted the appreciation pressure. Falling inflation-adjusted yield spreads have been gradually eroding the advantage of US dollar assets, and a global upswing in real yields late in the review period did not change that trend (Graph 7, right-hand panel). Going forward, as the fiscal stimulus is rolled out, the likely increase in US current account deficits may put downward pressure on the dollar, especially if US yields remain relatively restrained by monetary policy.
Positive sentiment towards EMEs, amid challenges
EME assets saw heightened volatility in January as global vaccination efforts hit various roadblocks. When the dollar strengthened, it did so most against the currencies of the EMEs most affected by the pandemic. Sentiment towards EME assets as a whole remained generally favourable throughout most of the review period, although differentiation appeared to increase across some dimensions.
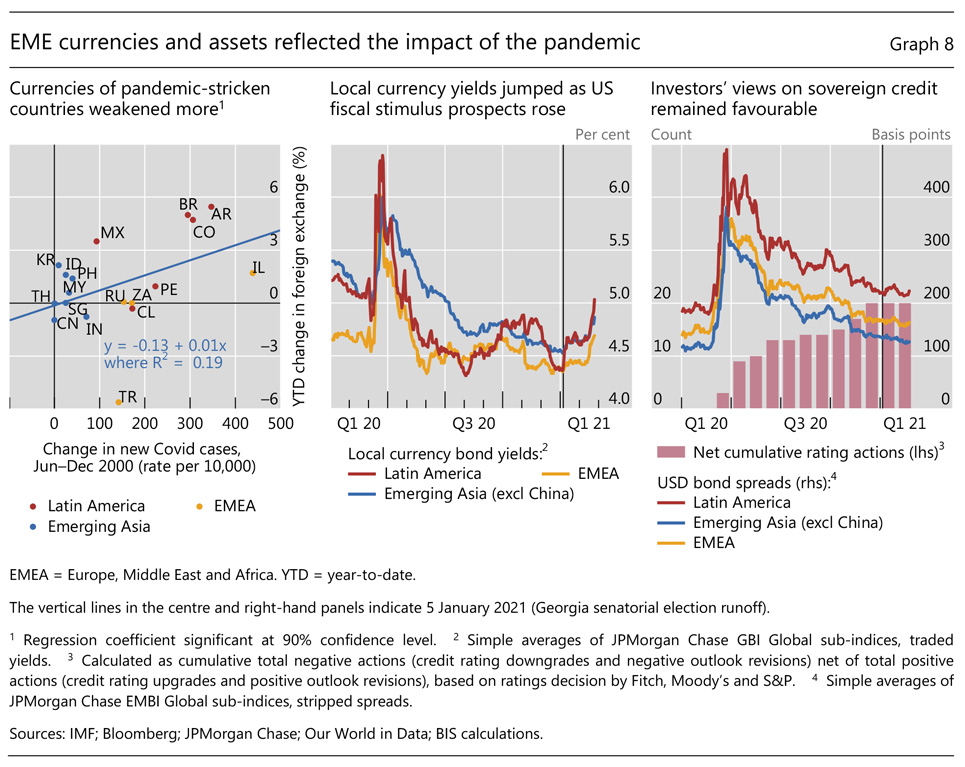
Pandemic management and associated monetary policy actions showed through in exchange rates. As the dollar appreciated somewhat after December, countries with higher infection rates during H2 2020 saw their currencies depreciate more (Graph 8, left-hand panel). In particular, currencies fell the most in South America, where looser monetary policies were needed to cushion the blow of higher infection rates. Policy rates in the region had dropped by 200 basis points on average, substantially more than in most other EMEs. In contrast, the currencies of Asian countries, which sustained lower infection rates, proved more resilient.
Some of the largest EMEs had seen inflation escalating since mid-2020. During the review period, monthly inflation figures surpassed central bank targets of those economies. Substantially higher food prices, as stated earlier, added to inflationary pressures. Central banks may thus face challenging trade-offs, with inflation prompting them to tighten monetary conditions pre-emptively, before economic activity has fully recovered from the pandemic shock. In this context, favourable global financial conditions would provide valuable room for manoeuvre.
Government bond yields, however, met a turning point in January. Going into the end of 2020, local currency-denominated bond yields had continued to fall on the back of investors' relentless search for yield (Graph 8, centre panel). As the "reflation" trade scenario shaped up in early January, yields began to rise again, and then jumped up towards the end of the review period, together with AE yields. The increase in yields was sharpest for Latin American countries, possibly revealing investors' higher inflation and depreciation expectations for the region.
Overall, investors maintained a sanguine view of EME government credit. Spreads on US dollar-denominated debt continued to tighten up to the end of the review period (Graph 8, right-hand panel, lines), irrespective of the jitters in local currency yields. Sovereign spreads were approaching early 2020 levels at the regional level, even though EMEs' credit ratings had worsened since the outbreak of the pandemic (right-hand panel, bars). That said, investors differentiated across individual jurisdictions. EMEs with higher credit ratings at the end of the review period (BBB+ or better) faced credit default swap spreads about 100 basis points lower than other EMEs (with ratings BBB– or worse).
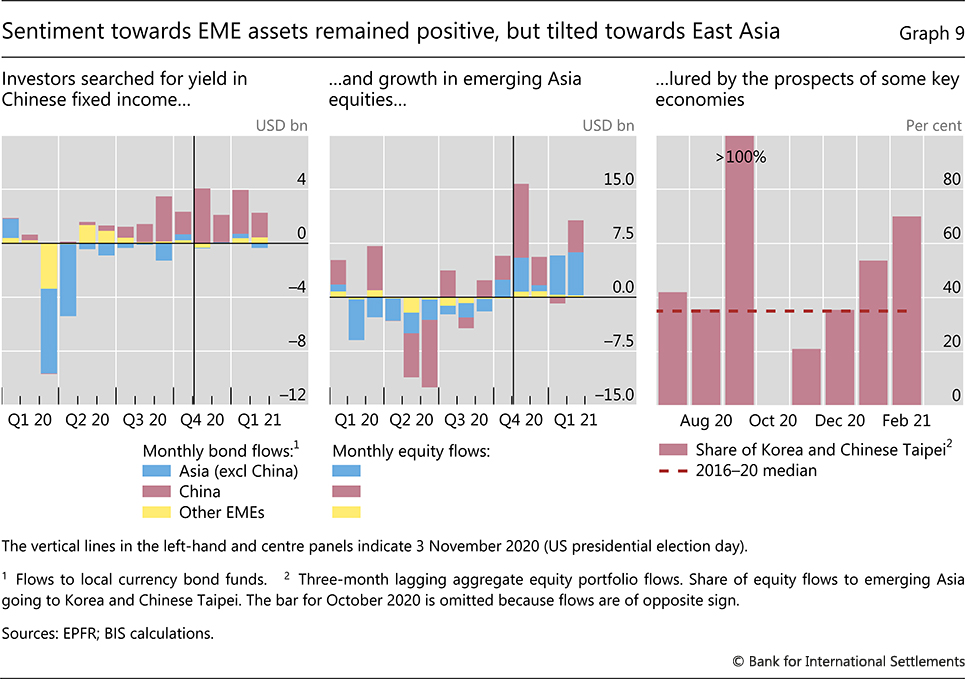
Portfolio flows through the review period also revealed a positive tilt towards some EMEs. Flows into bond funds strengthened after the US election, and investors focused their search for yield on China (Graph 9, left-hand panel). In early 2021, portfolio equity flows rotated towards emerging Asia (centre panel), consistent with investors pursuing growth in some key economies in the region (right-hand panel).
1 The period under review extends from 1 December 2020 to 22 February 2021.
2 Inflation break-even rates for a given maturity are calculated as the difference between the yields of nominal bonds and inflation-linked bonds of the same maturity.
3 Inflation break-even rates are a common measure of inflation compensation. Such compensation is made up of two components: market expectations of average inflation during the life of the bonds, and an inflation risk premium to compensate investors for holding nominal bonds, which expose them to inflation risk.