Mind the buybacks, beware of the leverage
In the light of the economic toll of the Covid-19 pandemic, a natural question is whether the substantial amount of buybacks conducted in recent years has undermined corporate resilience and increased the need for public support. Buybacks are a means to distribute cash to shareholders. They are of concern for two reasons: first, managers could use them to artificially increase stock prices in order to boost performance pay; second, they could be a tool to raise leverage to excessive levels. There is some evidence that managers use buybacks opportunistically, but little indication of detrimental effects on long-term company value. However, buybacks appear instrumental in meeting leverage targets. Therefore, the main policy issue is leverage, and buybacks are of concern mostly in their role as leverage management tools.1
JEL classification: G33, G35.
Policymakers across the world committed large sums to support private business through the Covid-19 pandemic. This came on the heels of a steady increase in buybacks, also known as share repurchases. Was there a link between substantial buybacks and the need for public assistance? This feature focuses mainly on US non-financial corporates and highlights that repurchases mostly served the purpose of leverage targeting. Thus, buybacks appear of concern to the extent that leverage is.
Overall corporate payouts rose substantially in recent years. Between 2010 and 2019, US firms distributed $4 trillion in dividends and $6 trillion in buybacks, or $4 trillion net of equity issuance. Net repurchases amounted on average to about 1.5% of market capitalisation per year.
Stock buybacks can be a double-edged sword from investors' perspective. They can support a firm's market price by signalling undervaluation, achieving tax efficiency gains relative to dividends or helping avoid wasteful expenditures by managers. Still, they could be detrimental to longer-run firm value if executives use them simply to increase their performance pay. However, there is only limited evidence for this.
Key takeaways
- Corporate stock buybacks have roughly tripled in the last decade, often to attain desired leverage, or debt as a share of assets.
- Firms' desired leverage can be excessive if companies do not account for all financial distress costs, including those potentially shifted to the public purse as a result of bailouts.
- Policy discussions on financial stability should focus on leverage rather than buybacks.
Statistical data: data behind all graphs
In addition, buybacks are instrumental in meeting leverage targets. If investors failed to measure properly financial distress costs or shifted these costs to creditors or the public purse, these targets would be too high. Excessive leverage is a financial stability concern.
The remainder of the feature describes recent trends in buybacks, before exploring the reasons for repurchases. It then investigates how past buybacks affected returns during the initial pandemic shock, and links buybacks to the broader discussion on the financial stability implications of corporate leverage.
The evolution of buybacks over time
While share buybacks are conceptually similar to dividends, the two forms of disbursement to shareholders have evolved differently over time. As a powerful tool for leverage management, buybacks complement and reinforce the effect of debt issuance on firms' capital structure.
In a stock buyback, a company returns capital to shareholders by repurchasing its own shares. Equity decreases and leverage rises, more rapidly so when funds are obtained by issuing debt. As an example, a firm with $100 in assets, $30 in debt and $70 in equity starts with leverage equal to 0.3 ($30 debt divided by $100 assets). A $10 buyback financed by selling assets would raise leverage to 0.33 ($30 debt over $90 assets). Had the buyback been funded with $10 of new debt, leverage would have climbed to 0.4 ($40 debt relative to $100 assets).
Like dividends, buybacks are a form of capital distribution. In the example above, the firm could also disburse funds through dividends, with similar effects on leverage. There are three important differences between dividends and buybacks. First, firms are reluctant to cut the former, because investors value smooth dependable income, but use the latter more flexibly, for instance to disburse one-off cash windfalls. Second, while managers could use buybacks to artificially inflate earnings per share (EPS) and stock prices, dividends have no effect on EPS and mechanically reduce stock prices on ex dividend dates. Third, dividends are paid mostly by mature firms, while buybacks are common among high-growth firms as well (Farre-Mensa et al (2014)).
Payouts to shareholders rose quickly in the aftermath of the Great Financial Crisis (GFC). In 2019, US firms repurchased own shares worth $800 billion (Graph 1, first panel; all figures are in 2019 US dollars). Net of equity issuance, the 2019 tally reached $600 billion. Net buybacks can turn negative, and they did during the GFC, as firms issued equity to shore up their balance sheets. Dividends had been somewhat higher than net buybacks until 2005, when the latter surged just before the GFC and dropped precipitously thereafter (second panel). Underscoring the structural differences between dividends and buybacks, the former were remarkably smooth, while the latter proved procyclical and co-moved with equity valuations (grey bars).
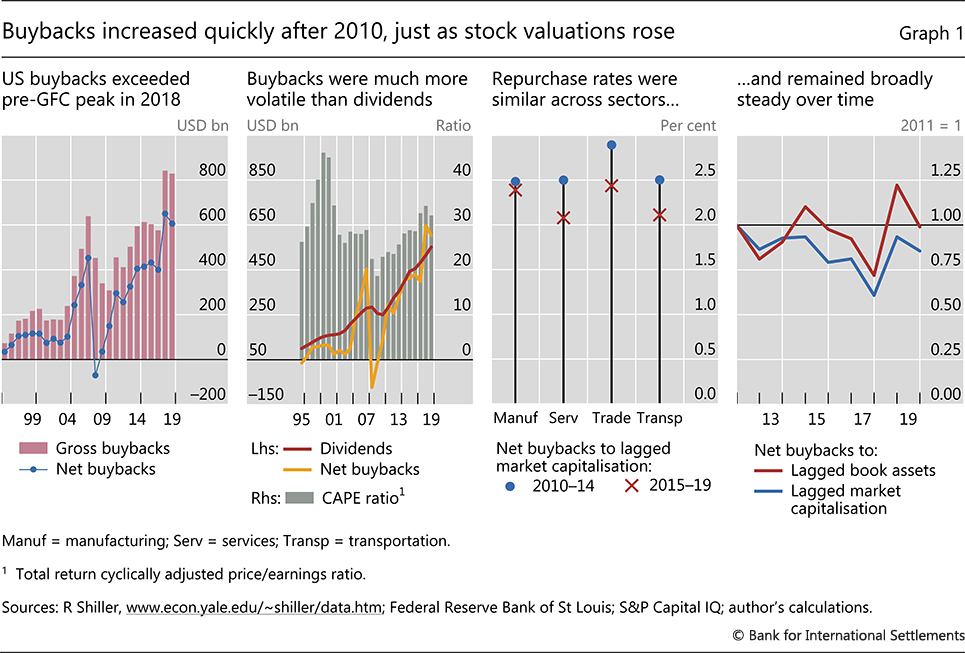
Similar trends could be observed globally. Aside from the United States, the five countries with the largest 2019 buyback amounts - Japan, the United Kingdom, France, Canada and China - recorded repurchases that were jointly worth $130 billion in that year. While this total was only a fraction of US buybacks, it quadrupled relative to 2010. The country level increases were particularly pronounced in China, where repurchases rose tenfold to $17 billion, and in Japan, where they added up to $52 billion, for a fivefold rise, on the heels of stronger investor activism.
The rest of this feature zooms in on US data on non-financial corporates' buybacks. Given the substantial size and longer history of share repurchases in the United States, these data offer rich information on time trends and cross-company patterns. The determinants and effects of buybacks appear similar in most countries (Manconi et al (2019)).
While repurchases have risen in dollar terms, they have remained stable relative to company size. The repurchase rate - or net buybacks as a fraction of stock market capitalisation - was similar across sectors that represented the vast majority of non-financial buybacks conducted after 2010, and mostly hovered just above 2% (Graph 1, third panel). It was also broadly stable over time, albeit with some year-on-year variation (fourth panel). Scaling net buybacks by book assets yields similar patterns.
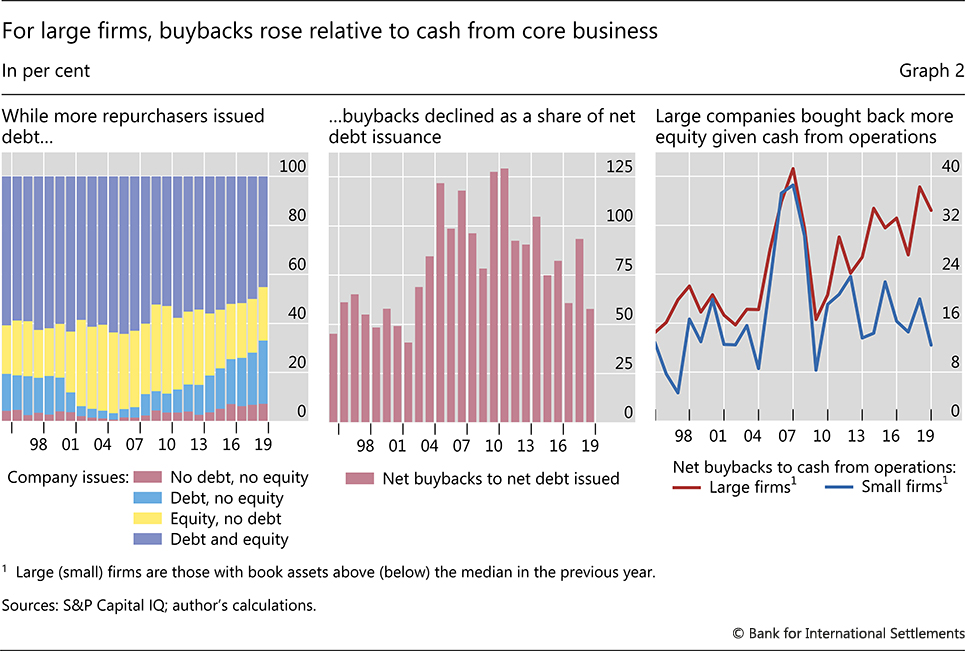
Repurchases were partly funded with external finance. Virtually all companies that undertook buybacks in a given year also raised funds from investors during the same period, often through a mix of equity and debt (Graph 2, left-hand panel). Repurchasing shares while also issuing equity might appear counterintuitive. However, it can occur when companies seek to offset the issuance of stock for employees' compensation. In addition, periodic equity issuance subjects firms to the scrutiny of financial markets, irrespective of planned buybacks.
While more repurchasers issued debt only, buybacks were not the main reason for rising debt issuance. About 25% of the companies that bought back stock issued debt but no equity in 2019 (Graph 2, left-hand panel). As illustrated in the example at the beginning of this section, this trend has contributed to a faster rise in leverage. However, starting in 2010 buybacks represented a progressively smaller share of debt issuance, trending down towards early 2000s levels (centre panel). This indicates that buybacks were not the main cause of the post-GFC rise in corporate debt.
After 2000, internally generated funds became more important in financing buybacks. For one, economic growth resulted in rising profitability. In addition, firms exhibited a higher propensity to distribute available income. Kahle and Stulz (2020) find that cumulative corporate payouts from 2000 to 2018 were higher than those from 1971 to 1999 and that two thirds of the increase was due to this higher propensity.
The propensity to distribute cash has differed across company size. For larger firms, repurchases as a fraction of cash from operations doubled between 2004 and 2019, to above 30%. For smaller firms, this fraction hovered around 15% with the brief exception of the GFC (Graph 2, right-hand panel).
Why do companies repurchase their own shares?
The decision to buy back equity can reflect a variety of motives, and an extensive academic literature allows us to classify these motives based on whether the likely effect on firm value is positive, negative or uncertain.
A classification of buyback based on their effects on firm value
In a number of cases, repurchases improve a firm's market value. For instance, if managers perceive equity as undervalued, they can credibly signal their assessment to investors through buybacks. In addition, using repurchases to disburse funds when capital gains are taxed less than dividends increases net distributions, all else equal. Furthermore, by substituting equity with debt, firms can lower funding costs when debt risk premia are relatively low, especially in the presence of search for yield. And, by reducing funds that managers can invest at their discretion, repurchases lessen the risk of wasteful expenditures.
However, buybacks can be detrimental when they reflect conflicts of interest. Executive compensation linked to stock prices or EPS targets can lead managers to repurchase equity with the narrow objective of boosting their pay. Managers would not bear the full costs of this action: the resulting increase in leverage increases the likelihood of financial distress, but it is likely to materialise well after managers have received their compensation. Effectively, managers would shift risks to shareholders. In these circumstances, buybacks would be excessive from investors' longer-term perspective.
Finally, buybacks can be used to fine-tune the capital structure. Since repurchases always affect leverage, all else equal, they are a powerful tool to achieve a specific leverage target. Used for this purpose, they seek to bring in benefits for shareholders such as higher return-on-equity, but their net impact on long-term company value is not clear-cut. To assess this impact, it is necessary to also consider financial distress costs, such as weaker pricing power or higher bankruptcy risk.
Importantly, leverage can have positive effects on company value but still be excessive from the perspective of society as a whole. Such is the case when some financial distress costs are shifted to creditors or the public purse, with financial stability implications.
Limited scope for opportunistic buybacks
Findings in the academic literature suggest that misalignment of managers' and investors' incentives was not a major driver of buybacks.
One indication in this direction is that sub-par corporate governance appears to have limited effects on post-repurchase performance. Before 2000, opportunistic buybacks - in which managers repurchase stock largely for private benefit - were more likely in companies with poor corporate governance (Caton et al (2016)). These firms would experience weaker post-repurchase growth in terms of both stock returns and operating income. Studies indicate that the importance of governance for performance after buybacks decreased after 2000, probably due to enhanced regulations and disclosures.
In addition, incentives linked to executive pay seem to have had a weak influence on repurchase patterns. To be sure, available evidence suggests that companies prefer to pay out with buybacks, rather than with dividends, when managers hold more stock options (Fenn and Liang (2001)). The effect, however, is largely confined to the choice of capital distribution method, rather than the amount distributed (Kahle (2002)). That is, managers would decide to distribute persistent excess cash flows with buybacks, even if, in the absence of stock options, they would have used dividends. Importantly, they would generally not distribute more funds through buybacks than they would have through dividends.
Compensation practices have also evolved. Executive stock options have become relatively less popular, in favour of arrangements whereby executive performance pay is not negatively affected by dividend payments. As such, managers' incentive to distribute capital with repurchases rather than dividends has weakened (Bonaimé et al (2019)). Still, bonuses linked to EPS, which increase with buybacks, increase the likelihood of repurchases when EPS targets are about to be missed by small amounts (Almeida et al (2016)).
Ultimately, if repurchases mainly reflected managerial opportunism and were thus detrimental to investors, they would entice negative market reactions over the long run. There is little evidence that this has been the case. After accounting for broad risk factors, long-term stock returns are typically positive following buyback announcements and higher than for non-repurchasers (Peyer and Vermaelen (2009), Dittmar and Field (2015)). Similar patterns hold across most countries (Manconi et al (2019)). Even in the presence of substantial executive stock options, buybacks do not cause negative reactions (Kahle (2002)). Firms with executive bonuses tied to EPS targets also experience long-term returns in line with those of comparable firms that did not repurchase stock (Cheng et al (2015)).
Buybacks as a leverage management tool
Corporate assets grew faster than equity over the past decade. In the non-financial corporate sector, book assets expanded by 75% between 2010 and 2019. Book equity rose at a similar pace through 2013, before slowing and ultimately rising by 48% over the same period (Graph 3, first panel). The overall effect was a noticeable rise in median leverage, with debt climbing from 21% to 32% of book assets (second panel, solid yellow line). The increase in leverage was similar for the more leveraged firms, namely those at the 90th percentile of the cross-sectional distribution of leverage ratios in a given year. For these companies, debt amounted to nearly 60% of book assets in 2019, up from 48% in 2010 (second panel, solid purple line).
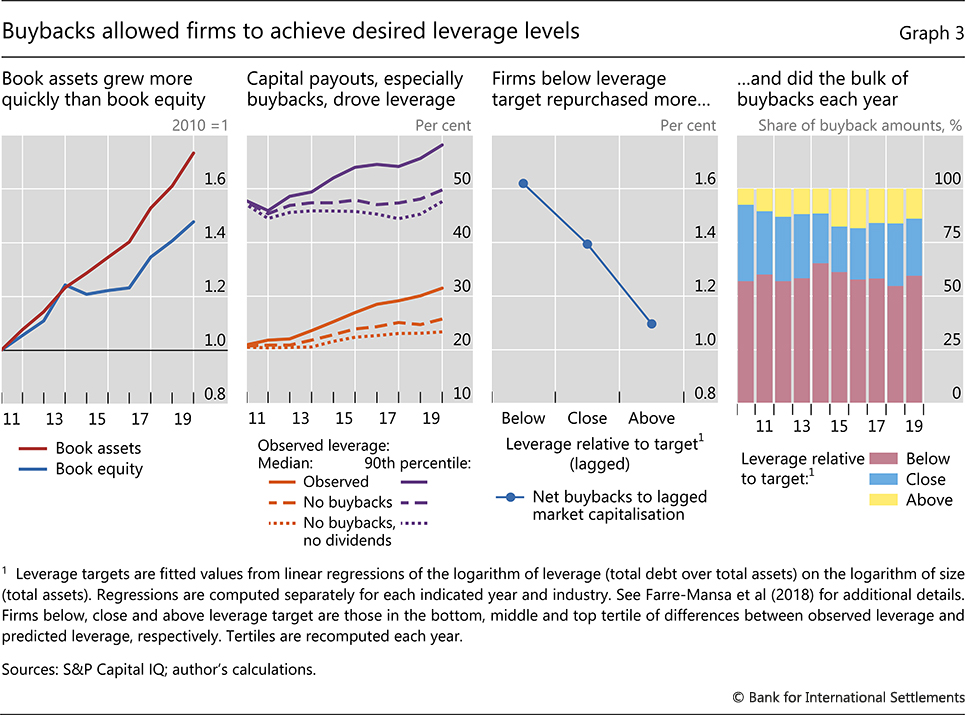
Capital distributions supported the increase in leverage. Given historical debt dynamics, adding repurchases and dividends back to company assets would have substantially dampened the increase in leverage (Graph 3, second panel, dotted lines). Importantly, the effect of adding back share repurchases (difference between solid and dashed lines) would have been much greater than that of adding back dividends (difference between dotted and dashed lines).2
Being an important leverage management tool, buybacks were concentrated in firms that sought to keep up with the leverage of their peers. Yearly repurchases were substantially higher for firms with leverage below the level prevalent in their main industry - henceforth "target leverage" (Graph 3, third panel; see also Farre-Mensa et al (2018)). Peer effects are important determinants of capital structure decisions, especially for smaller firms and in more concentrated industries, and can make leverage more procyclical in response to macroeconomic factors like the cost of capital (Leary and Roberts (2014)). In aggregate, companies below target leverage accounted for around 60% of total buybacks each year, with limited annual variation (fourth panel).
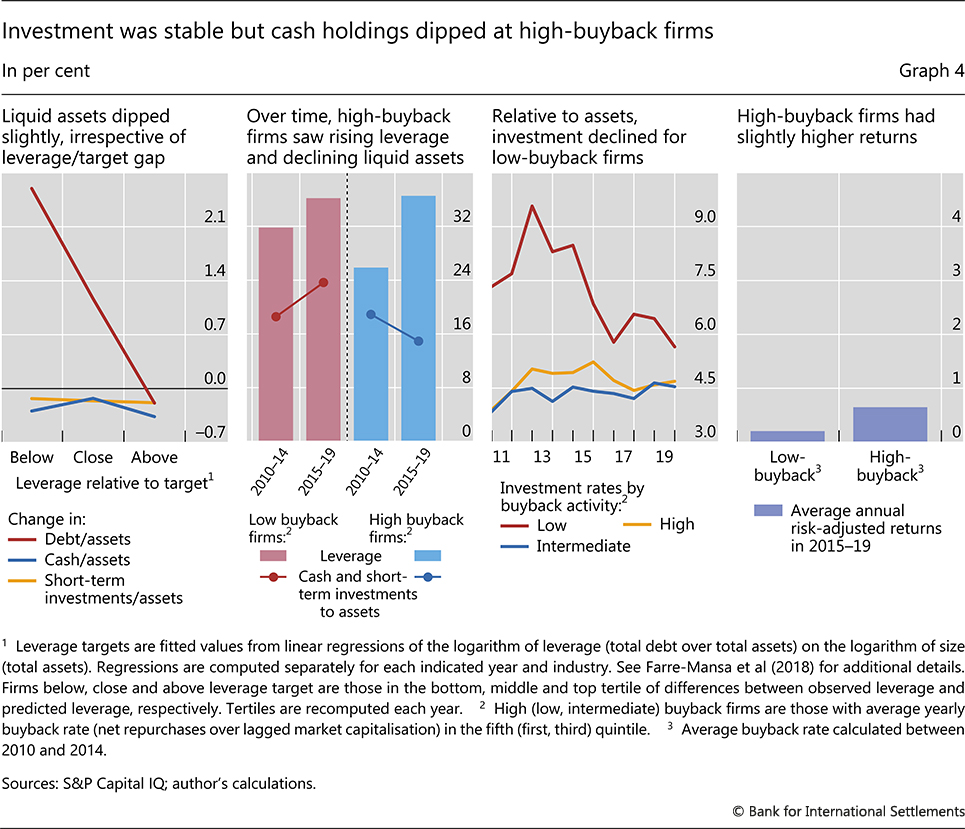
As further proof that they were mostly used to manage leverage, buybacks appeared to have limited effects on other key ratios. In particular, leverage targeting was not strongly linked to changes in holdings of cash and short-term investments (Graph 4, first panel), even though high-buyback firms did see material declines in liquid assets relative to book assets over time (second panel).
In aggregate, buybacks also seemed to have limited bearing on investment. Investment rates dropped noticeably in time for low-buyback companies and were broadly stable for the rest (Graph 4, third panel). Low-buyback companies are relatively small, and their higher investment rates mirror faster asset growth.
Likewise, repurchases have had a minor effect on risk-adjusted stock returns. In the five years before the Covid-19 pandemic, such returns were quite similar across repurchase levels (Graph 4, fourth panel). While high-buybacks firms did return more, their edge over low-buyback companies was small, 0.40% per year on average.
Buybacks or leverage? Evidence on risk drivers from the March 2020 shock
Gauging the effect of leverage on firms' performance is not straightforward, as it depends on market conditions. Admittedly, firms with higher leverage tend to have lower credit ratings, which signal higher default risk (Graph 5, left-hand panel). Stock returns, however, appear to reflect little of this higher default risk in normal times. Indeed, tail and downside risks were virtually identical for high- and low-leverage firms during periods of low and intermediate market stress between 2010 and 2019 (centre and right-hand panels).
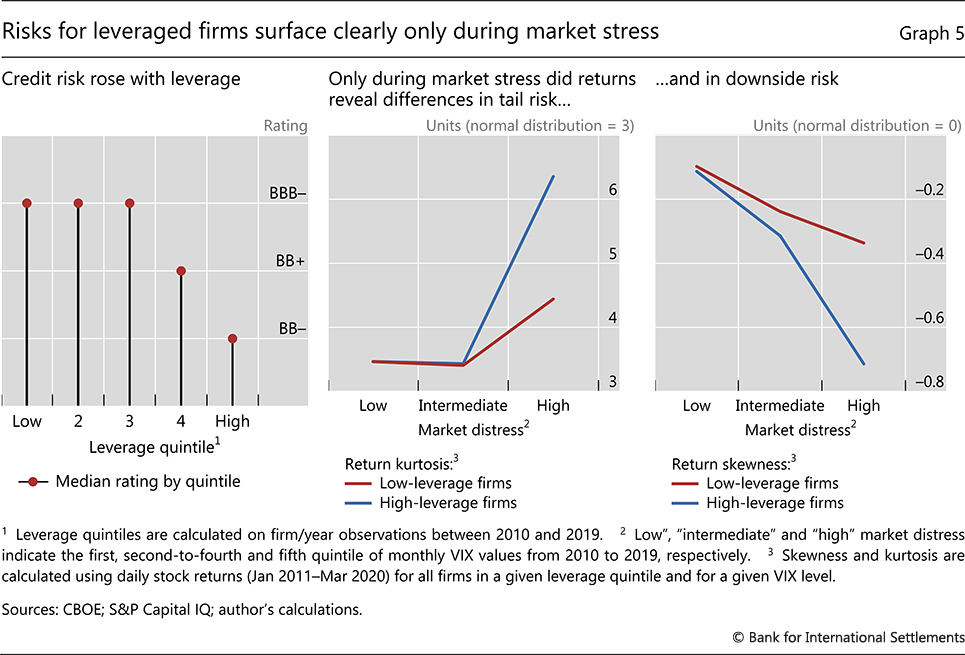
The effect of leverage does become apparent during periods of pronounced market turmoil. In such instances, shocks are substantial enough to clearly reveal drivers of stock returns. During times of high market stress, tail and downside risks rose markedly for high-leverage firms (Graph 5, centre and right-hand panels).
This evidence suggests that the initial pandemic shock in March 2020 can offer useful clues to understand the role of leverage for firms' performance and how it relates to that of buybacks. Concretely, if share buybacks drove company risk independently of leverage, firms with high buyback rates would have had lower returns after controlling for leverage. This argument suggests sorting firms into four investment portfolios with high/low leverage and high/low buyback propensity.
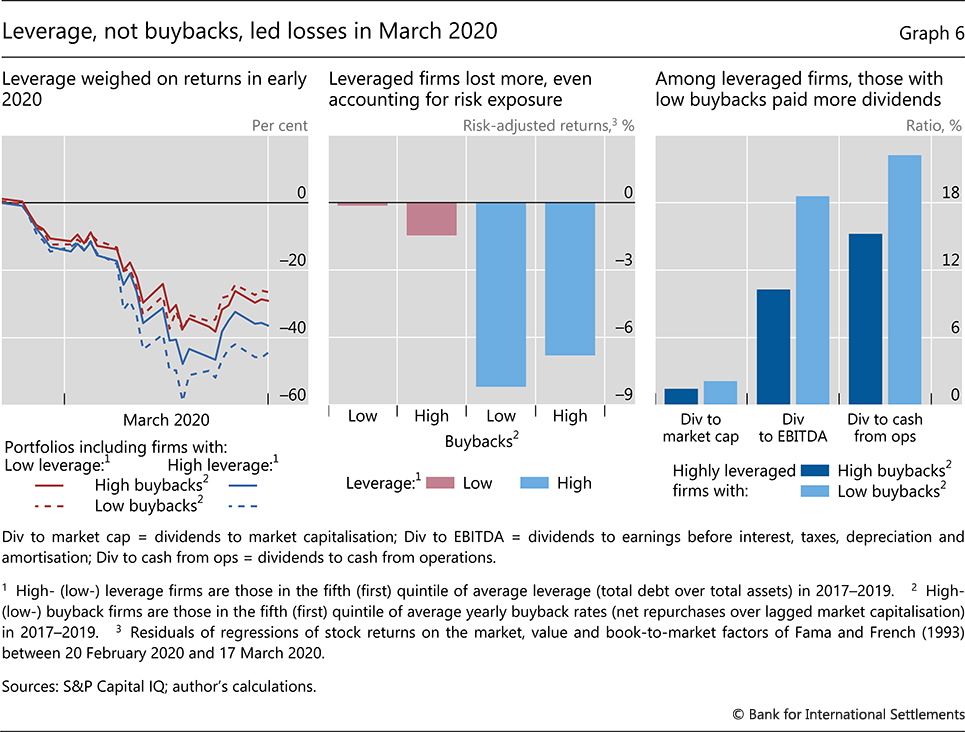
At the height of the pandemic shock, past repurchases adversely affected stock returns only through leverage. Between mid-February and end-March, high-leverage firms lost appreciably more than low-leverage firms (in line with the results of Ramelli and Wagner (2020)). Crucially, this pattern held irrespective of the amount of equity bought back during the previous three years (Graph 6, left-hand panel).
While the previous analysis treats leverage and buybacks as the only drivers of stock returns, taking into account other factors reinforces the message. Netting out the effect of such factors reveals limited implications of past buybacks, given leverage (Graph 6, centre panel). In fact, low-buyback/high-leverage companies actually experienced lower risk-adjusted returns than high-buyback/high-leverage companies. An important distinguishing feature of low-buyback firms is that they have tended to pay out more dividends (right-hand panel). Investors might have retrenched from them as the magnitude of the economic damage wrought by the pandemic increased the likelihood that dividends would be cut in the near future.
Conclusions
Buybacks are relevant for policy discussions, but largely as a leverage management tool. Policymakers' focus on leverage stems from the key role of capital structure dynamics in economic cycles, financial cycles and financial intermediation capacity. In general, a build-up in leverage precedes a decline in economic activity.
Companies can pursue excessively high leverage for a number of reasons. For one, opaqueness could blur the link between leverage and the likelihood and cost of financial distress. In this instance, more information may lead shareholders to target lower leverage. Alternatively, the focus on short-term results could lead managers and shareholders to largely disregard longer-term costs of distress, especially if these are borne by creditors, employees or the public sector. In this case, high leverage is part of a strategically chosen capital structure.
This article has argued that share buybacks affect firms' performance and financial resilience mostly through leverage. While there is some indication that managers use buybacks opportunistically to meet performance pay targets, this does not seem to adversely affect long-run company value. There is, however, clear evidence that companies make extensive use of share repurchases to meet leverage targets. The initial phase of the pandemic fallout in March 2020 put the spotlight on leverage: irrespective of past buyback activity, firms with high leverage saw considerably lower returns than their low-leverage peers. Thus, investors and policymakers should be mindful of buybacks as a leverage management tool, but they should particularly beware of leverage, as it ultimately matters for economic activity and financial stability.
References
Almeida, H, V Fos and M Kronlund (2016): "The real effects of share repurchases", Journal of Financial Economics, vol 119, no 1.
Bonaimé, A, K Kahle, D Moore and A Nemani (2019): "Does employee compensation still impact payout policy?", mimeo.
Caton, G, J Goh, Y Lee and S Linn (2016): "Governance and post-repurchase performance", Journal of Corporate Finance, vol 39.
Cheng, Y, J Harford and T Zhang (2015): "Bonus-driven repurchases", Journal of Financial and Quantitative Analysis, vol 50, no 3.
Dittmar, A and L Field (2015): "Can managers time the market? Evidence using repurchase price data", Journal of Financial Economics, vol 115, no 2.
Fama, E and K French (1993): "Common risk factors in the returns on stocks and bonds", Journal of Financial Economics, vol 33, no 1.
Farre-Mensa, J, R Michaely and M Schmalz (2014): "Payout policy", Annual Review of Financial Economics, vol 6, no 1.
--- (2018): "Financing payouts", mimeo.
Fenn, G and N Liang (2001): "Corporate payout policy and managerial stock incentives", Journal of Financial Economics, vol 60, no 1.
Kahle, K (2002): "When a buyback isn't a buyback: open market repurchases and employee options", Journal of Financial Economics, vol 63, no 2.
Kahle, K and R Stulz (2020): "Why are corporate payouts so high in the 2000s?", NBER Working Paper, no 26958.
Leary, M and M Roberts (2014): "Do peer firms affect corporate financial policy", Journal of Finance, vol 69, no 1.
Manconi, A, U Peyer and T Vermaelen (2019): "Are buybacks good for long-term shareholder value? Evidence from buybacks around the world", Journal of Financial and Quantitative Analysis, vol 54, no 5.
Peyer, U and T Vermaelen (2009): "The nature and persistence of buyback anomalies", Review of Financial Studies, vol 22, no 4.
Ramelli, S and A Wagner (2020): "Feverish stock price reactions to COVID-19", Review of Corporate Finance Studies, forthcoming.
1 The author thanks Claudio Borio, Stijn Claessens, Benoît Mojon, Andreas Schrimpf, José María Serena Garralda, Hyun Song Shin, Nikola Tarashev and Philip Wooldridge for valuable comments and suggestions, and Anamaria Illes and Jose María Vidal Pastor for excellent research assistance. The views expressed in this article are those of the author and do not necessarily reflect those of the Bank for International Settlements.
2 The picture is different in countries where buybacks are considerably less prevalent than in the United States. Notably, in both Europe and Japan, the contribution of dividends to the evolution of leverage between 2010 and 2019 was roughly three times larger than that of buybacks.